| Param | Original file | Final file |
|---|---|---|
| Filename | modeM0/AS1A10_053T34_9000004192_29199cztM0_level2.evt | modeM0/AS1A10_053T34_9000004192_29199cztM0_level2_quad_clean.evt |
| Size (bytes) | 497,108,160 | 63,253,440 |
| Size | 474.1 MB | 60.3 MB |
| Events in quadrant A | 2,519,033 | 404,629 |
| Events in quadrant B | 2,814,553 | 403,981 |
| Events in quadrant C | 5,043,601 | 370,077 |
| Events in quadrant D | 4,328,684 | 375,120 |
| Mode M9 | |||
|---|---|---|---|
| Quadrant | BADHDUFLAG | Total packets | Discarded packets |
| A | 0 | 7 | 0 |
| B | 0 | 7 | 0 |
| C | 0 | 7 | 0 |
| D | 0 | 7 | 0 |
| Mode SS | |||
|---|---|---|---|
| Quadrant | BADHDUFLAG | Total packets | Discarded packets |
| A | 0 | 106 | 0 |
| B | 0 | 106 | 0 |
| C | 0 | 106 | 0 |
| D | 0 | 106 | 0 |
| Mode M0 | |||
|---|---|---|---|
| Quadrant | BADHDUFLAG | Total packets | Discarded packets |
| A | 0 | 10768 | 2 |
| B | 0 | 11605 | 1 |
| C | 0 | 18712 | 1 |
| D | 0 | 16556 | 1 |
| Quadrant | Total seconds | Saturated seconds | Saturation percentage |
|---|---|---|---|
| A | 5150 | 31 | 0.601942% |
| B | 5150 | 99 | 1.922330% |
| C | 5150 | 591 | 11.475728% |
| D | 5150 | 236 | 4.582524% |
Noise dominated data is calculated using 1-second bins in cleaned event files. If a bin has >2000 counts, and if more than 50% of those come from <1% of pixels, then it is considered to be noise-dominated and hence unusable.
| Quadrant | # 1 sec bins | Bins with >0 counts | Bins with >2000 counts | High rate bins dominated by noise | Noise dominated (total time) | Noise dominated (detector-on time) | Marked lightcurve |
|---|---|---|---|---|---|---|---|
| A | 5840 | 5151 | 0 | 0 | 0.00% | 0.00% | 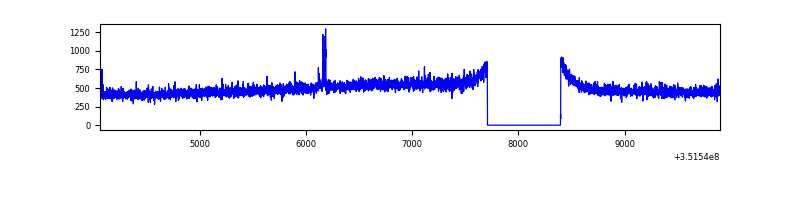 |
| B | 5840 | 5151 | 15 | 15 | 0.26% | 0.29% | 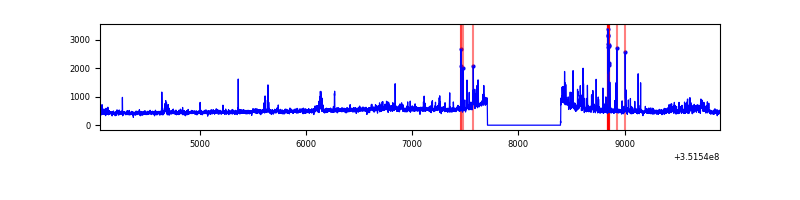 |
| C | 5840 | 5151 | 343 | 343 | 5.87% | 6.66% | 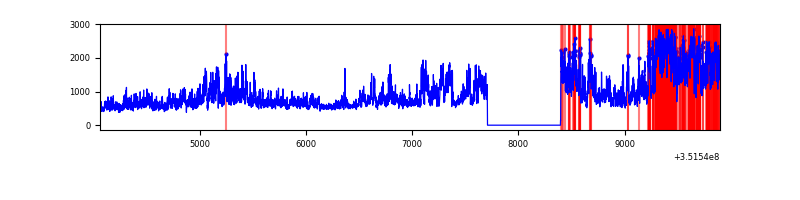 |
| D | 5840 | 5151 | 172 | 172 | 2.95% | 3.34% | 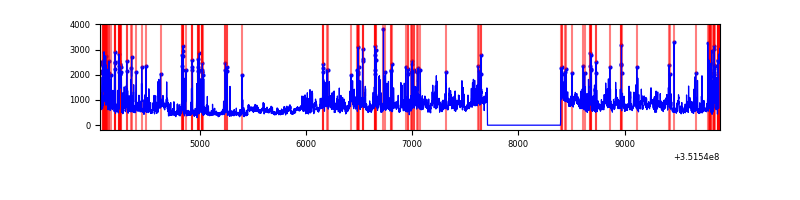 |
Top three noisy pixels from each quadrant. If the there are fewer than three noisy pixels in the level2.evt file, extra rows are filled as -1
| Pixel properties | Quadrant properties | ||||||
|---|---|---|---|---|---|---|---|
| Quadrant | DetID | PixID | Counts | Sigma | Mean | Median | Sigma |
| A | 15 | 169 | 17628 | 129.44 | 648 | 634 | 131.3 |
| A | 13 | 254 | 10318 | 73.76 | 648 | 634 | 131.3 |
| A | 3 | 137 | 6414 | 44.03 | 648 | 634 | 131.3 |
| B | 0 | 183 | 120297 | 951.76 | 643 | 626 | 125.7 |
| B | 5 | 255 | 83442 | 658.65 | 643 | 626 | 125.7 |
| B | 0 | 229 | 28431 | 221.14 | 643 | 626 | 125.7 |
| C | 3 | 233 | 2566464 | 17969.88 | 606 | 610 | 142.8 |
| C | 14 | 238 | 98352 | 684.53 | 606 | 610 | 142.8 |
| C | 2 | 114 | 12253 | 81.54 | 606 | 610 | 142.8 |
| D | 1 | 52 | 823167 | 5594.64 | 617 | 603 | 147.0 |
| D | 8 | 195 | 595678 | 4047.38 | 617 | 603 | 147.0 |
| D | 2 | 250 | 271771 | 1844.34 | 617 | 603 | 147.0 |
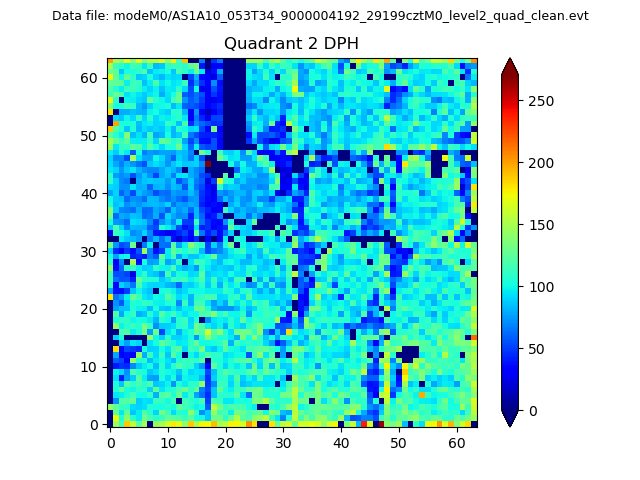
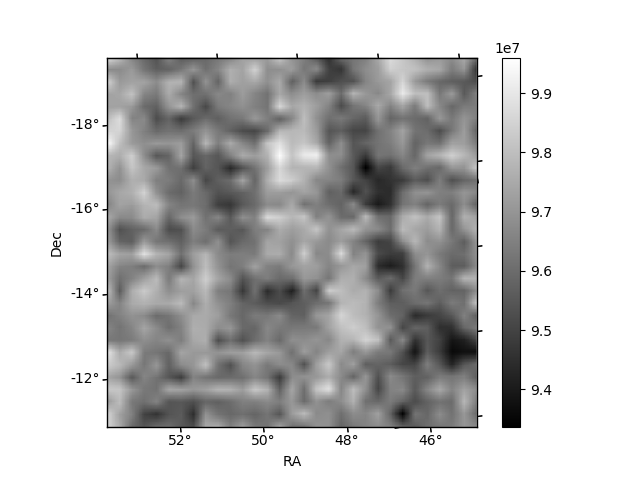
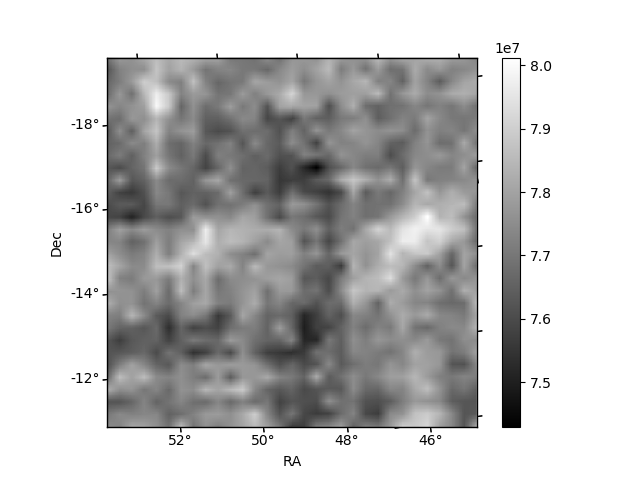
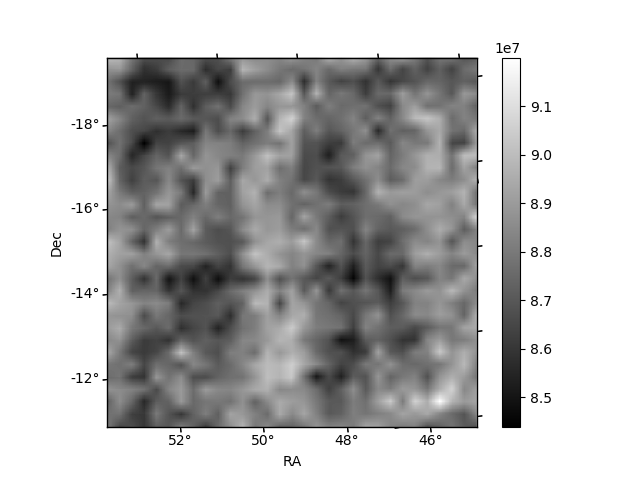
Histogram calculated using DETX and DETY for each event in the final _common_clean file
| Quadrant A | 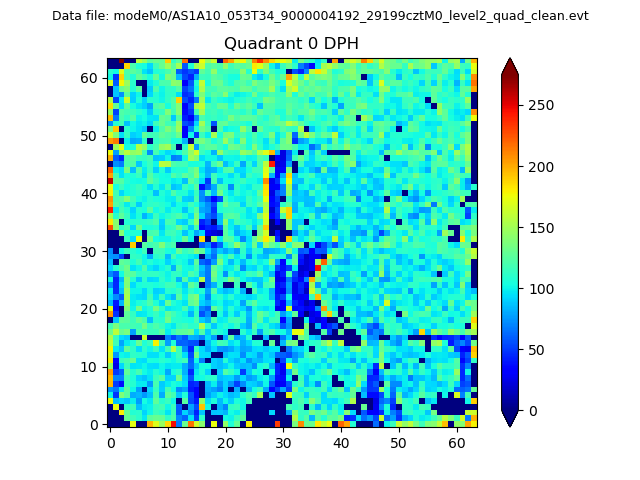 |
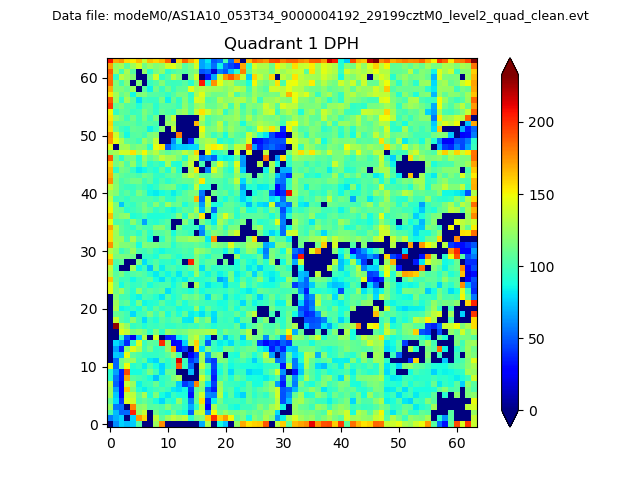 |
Quadrant B |
|---|---|---|---|
| Quadrant D | 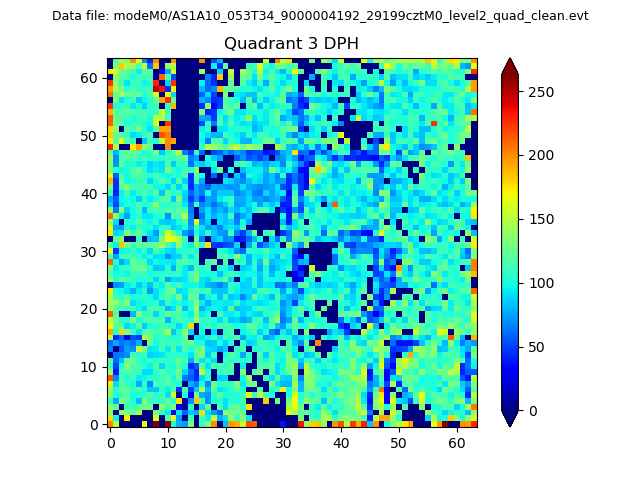 |
 |
Quadrant C |
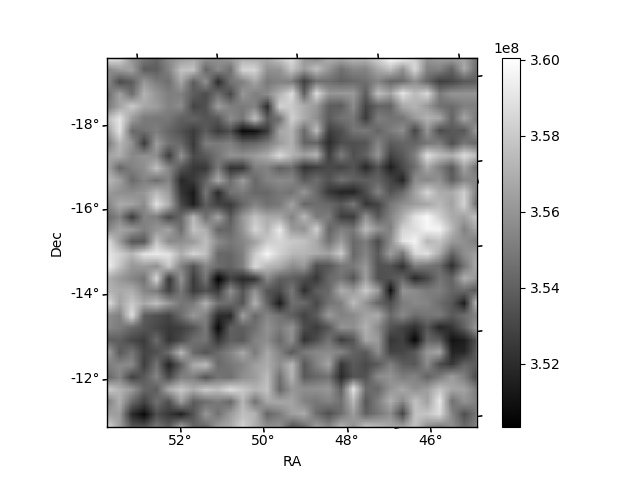
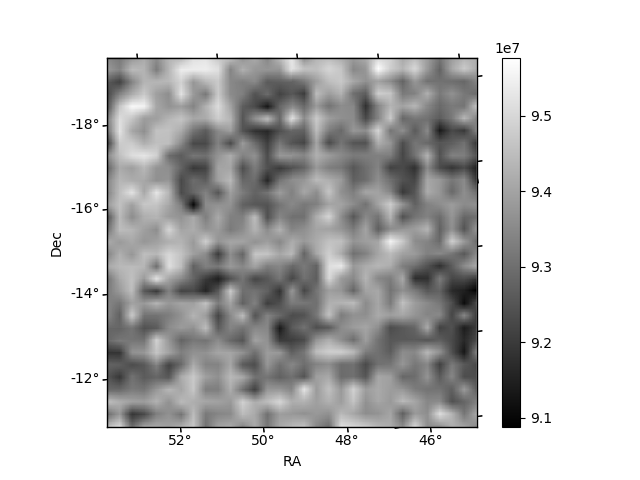
| Plot type | Count rate plots | Images |
|---|---|---|
| Comparison with Poisson distribution Blue bars denote a histogram of data divided into 1 sec bins. Red curve is a Poisson curve with rate = median count rate of data. |
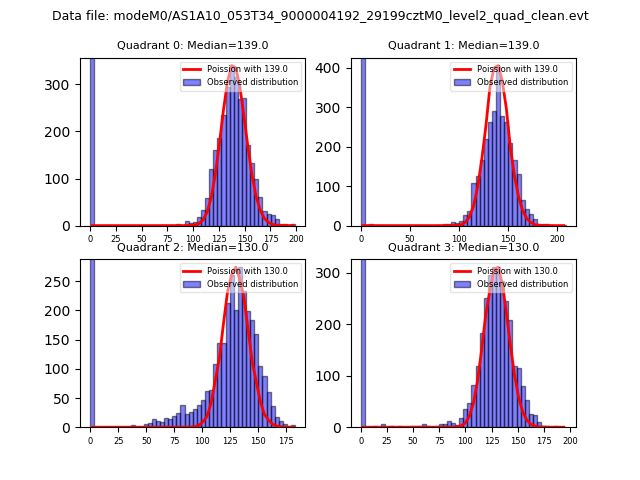 |
 |
| Quadrant-wise count rates Data is divided into 100 sec bins |
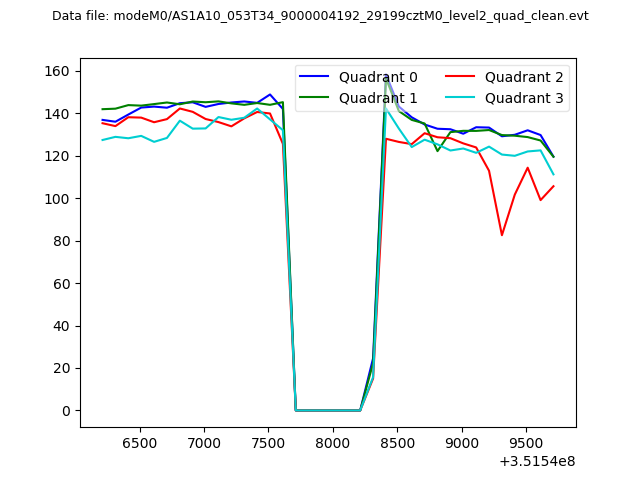 |
|
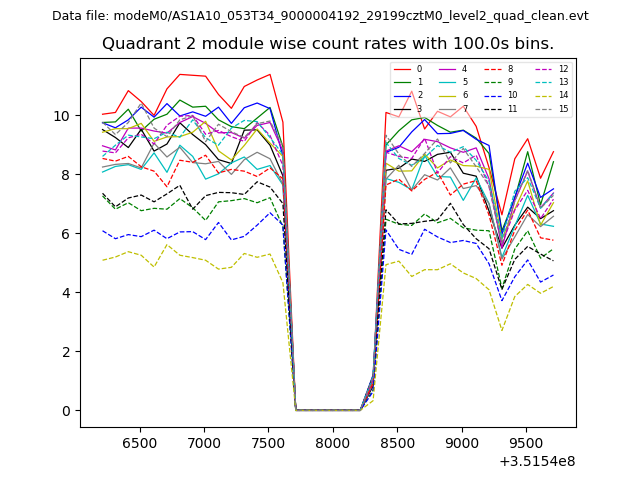
| Module-wise count rates for Quadrant A Data is divided into 100 sec bins |
 |
 |
| Module-wise count rates for Quadrant B Data is divided into 100 sec bins |
 |
 |
| Module-wise count rates for Quadrant C Data is divided into 100 sec bins |
 |
 |
| Module-wise count rates for Quadrant D Data is divided into 100 sec bins |
 |
 |
| Parameter | Plot |
|---|---|
| CZT HV Monitor | 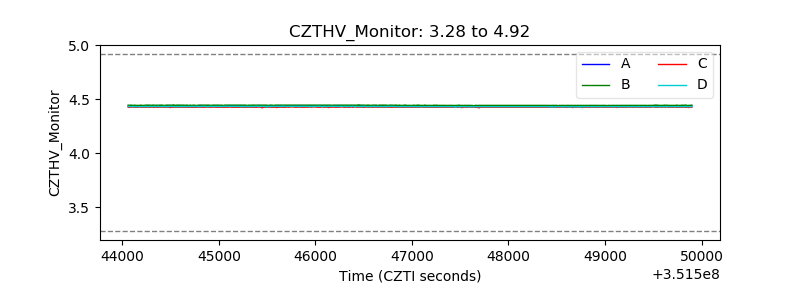 |
| D_VDD | 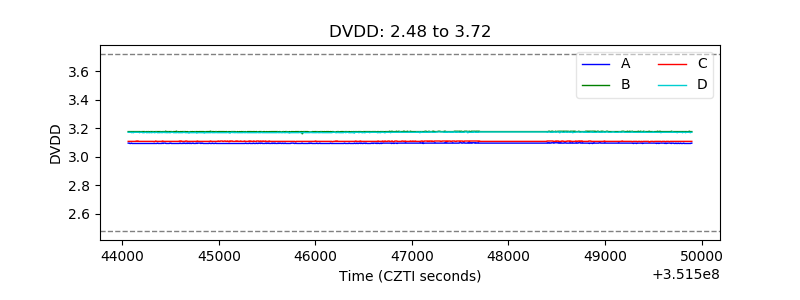 |
| Temperature 1 | 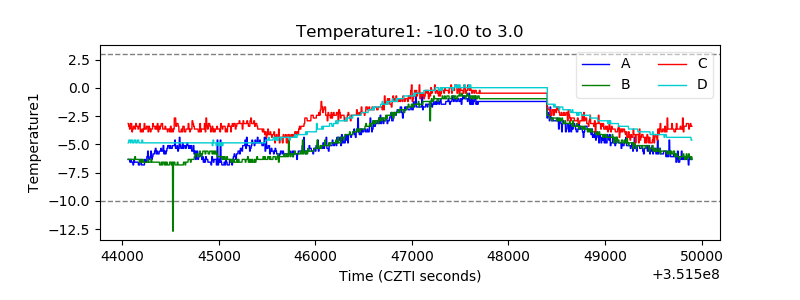 |
| Veto HV Monitor | 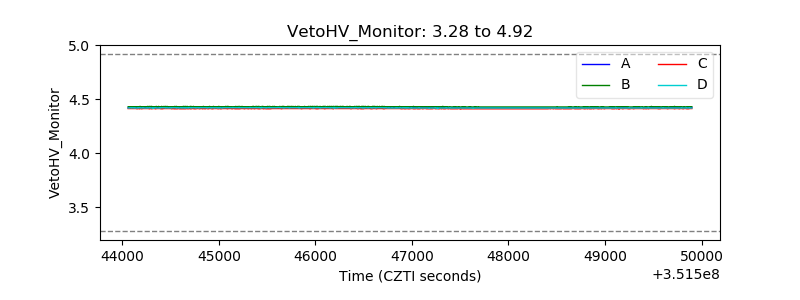 |
| Veto LLD | 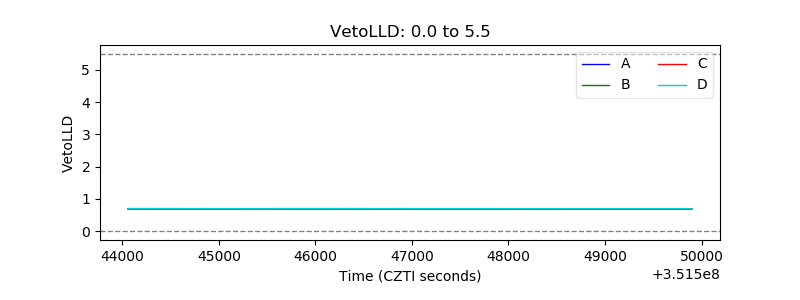 |
| Alpha Counter | 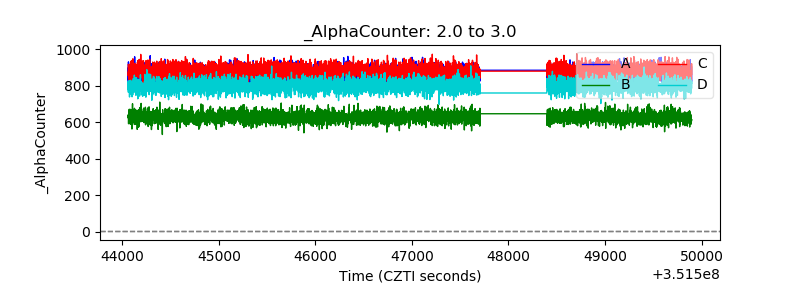 |
| _CPM_Rate | 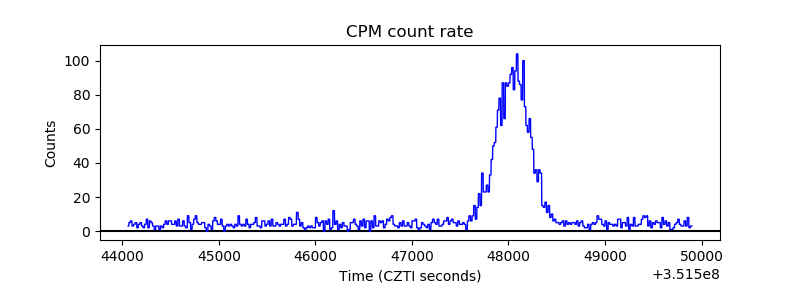 |
| CZT Counter | 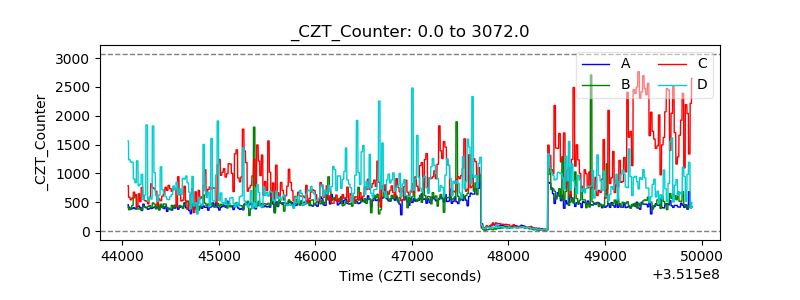 |
| +2.5 Volts monitor | 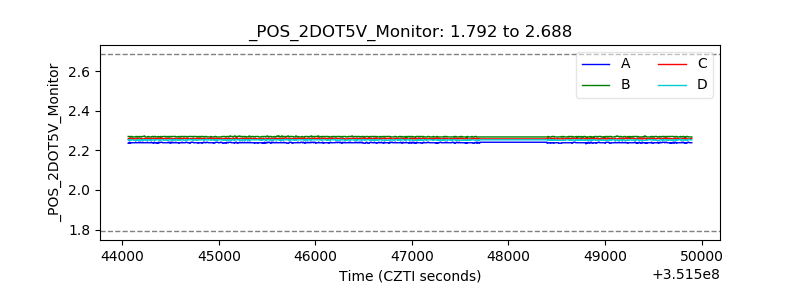 |
| +5 Volts monitor | 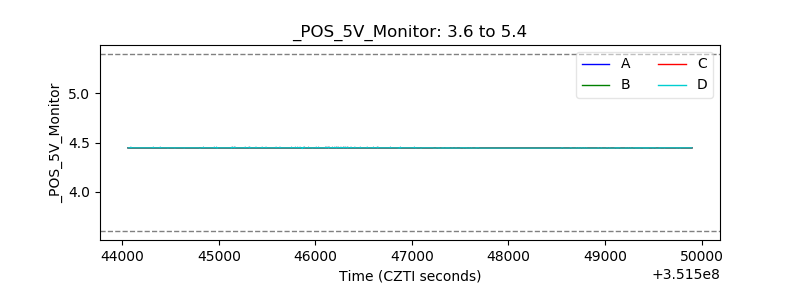 |
| _ROLL_ROT | 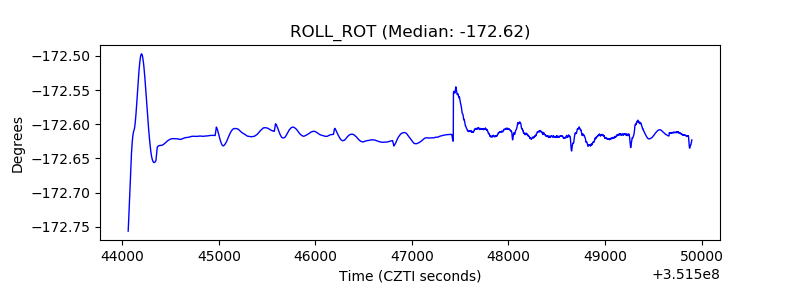 |
| _Roll_DEC |  |
| _Roll_RA | 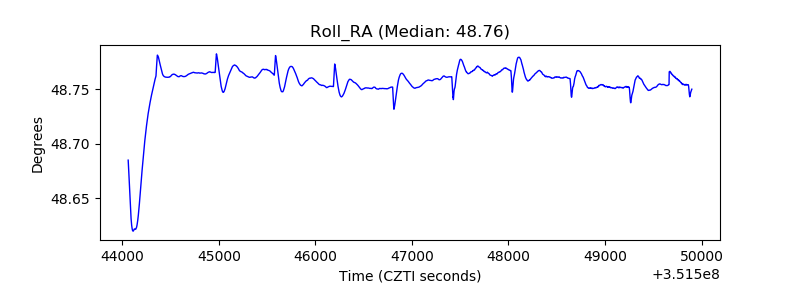 |
| Veto Counter |  |