| Param | Original file | Final file |
|---|---|---|
| Filename | modeM0/AS1A10_053T34_9000004192_29200cztM0_level2.evt | modeM0/AS1A10_053T34_9000004192_29200cztM0_level2_quad_clean.evt |
| Size (bytes) | 866,151,360 | 91,984,320 |
| Size | 826.0 MB | 87.7 MB |
| Events in quadrant A | 3,464,877 | 610,523 |
| Events in quadrant B | 4,071,891 | 608,622 |
| Events in quadrant C | 10,633,154 | 529,243 |
| Events in quadrant D | 7,575,723 | 534,132 |
| Mode M9 | |||
|---|---|---|---|
| Quadrant | BADHDUFLAG | Total packets | Discarded packets |
| A | 0 | 3 | 0 |
| B | 0 | 3 | 0 |
| C | 0 | 3 | 0 |
| D | 0 | 3 | 0 |
| Mode SS | |||
|---|---|---|---|
| Quadrant | BADHDUFLAG | Total packets | Discarded packets |
| A | 0 | 146 | 0 |
| B | 0 | 146 | 0 |
| C | 0 | 146 | 0 |
| D | 0 | 146 | 0 |
| Mode M0 | |||
|---|---|---|---|
| Quadrant | BADHDUFLAG | Total packets | Discarded packets |
| A | 0 | 14907 | 1 |
| B | 0 | 16722 | 1 |
| C | 0 | 36689 | 1 |
| D | 0 | 27443 | 1 |
| Quadrant | Total seconds | Saturated seconds | Saturation percentage |
|---|---|---|---|
| A | 7211 | 38 | 0.526973% |
| B | 7212 | 113 | 1.566833% |
| C | 7212 | 2014 | 27.925679% |
| D | 7212 | 965 | 13.380477% |
Noise dominated data is calculated using 1-second bins in cleaned event files. If a bin has >2000 counts, and if more than 50% of those come from <1% of pixels, then it is considered to be noise-dominated and hence unusable.
| Quadrant | # 1 sec bins | Bins with >0 counts | Bins with >2000 counts | High rate bins dominated by noise | Noise dominated (total time) | Noise dominated (detector-on time) | Marked lightcurve |
|---|---|---|---|---|---|---|---|
| A | 7516 | 7212 | 0 | 0 | 0.00% | 0.00% | 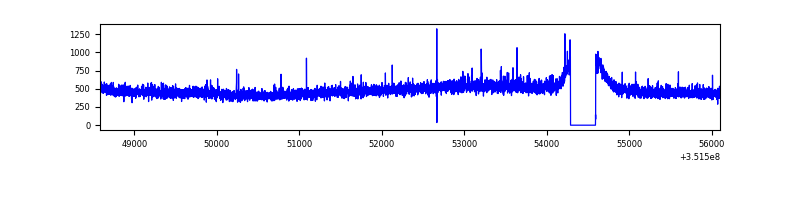 |
| B | 7517 | 7213 | 30 | 30 | 0.40% | 0.42% | 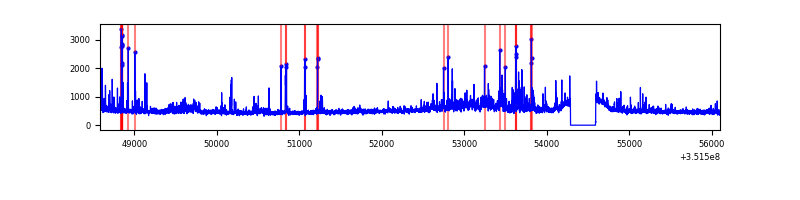 |
| C | 7517 | 7213 | 1319 | 1319 | 17.55% | 18.29% | 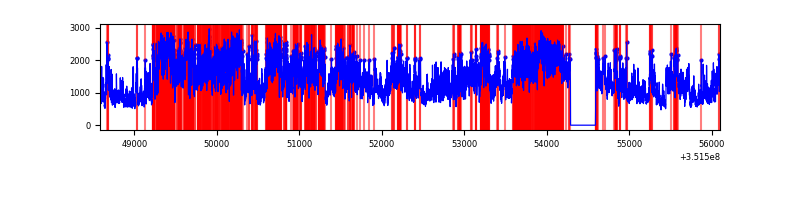 |
| D | 7517 | 7213 | 832 | 832 | 11.07% | 11.53% | 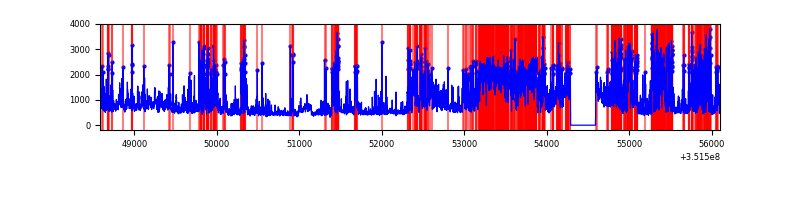 |
Top three noisy pixels from each quadrant. If the there are fewer than three noisy pixels in the level2.evt file, extra rows are filled as -1
| Pixel properties | Quadrant properties | ||||||
|---|---|---|---|---|---|---|---|
| Quadrant | DetID | PixID | Counts | Sigma | Mean | Median | Sigma |
| A | 15 | 169 | 33914 | 185.08 | 887 | 867 | 178.6 |
| A | 13 | 254 | 15116 | 79.8 | 887 | 867 | 178.6 |
| A | 3 | 137 | 8572 | 43.15 | 887 | 867 | 178.6 |
| B | 0 | 183 | 327615 | 1924.09 | 882 | 863 | 169.8 |
| B | 5 | 255 | 96013 | 560.29 | 882 | 863 | 169.8 |
| B | 0 | 229 | 81137 | 472.7 | 882 | 863 | 169.8 |
| C | 3 | 233 | 7384180 | 39403.34 | 794 | 801 | 187.4 |
| C | 14 | 238 | 126983 | 673.4 | 794 | 801 | 187.4 |
| C | 2 | 114 | 16456 | 83.55 | 794 | 801 | 187.4 |
| D | 1 | 52 | 3168218 | 15836.78 | 820 | 795 | 200.0 |
| D | 8 | 195 | 607195 | 3031.94 | 820 | 795 | 200.0 |
| D | 2 | 250 | 396825 | 1980.11 | 820 | 795 | 200.0 |
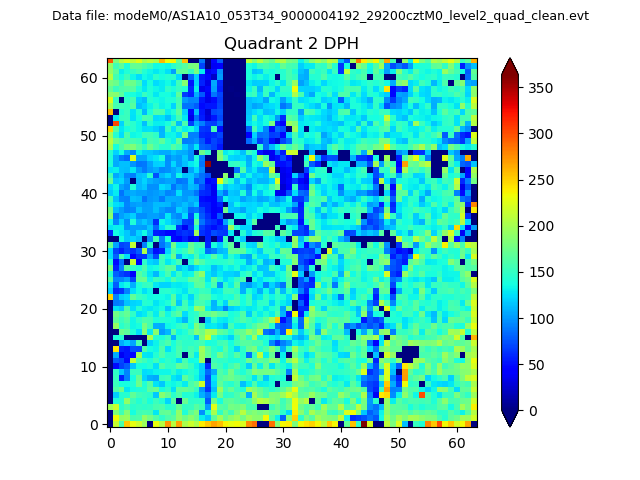
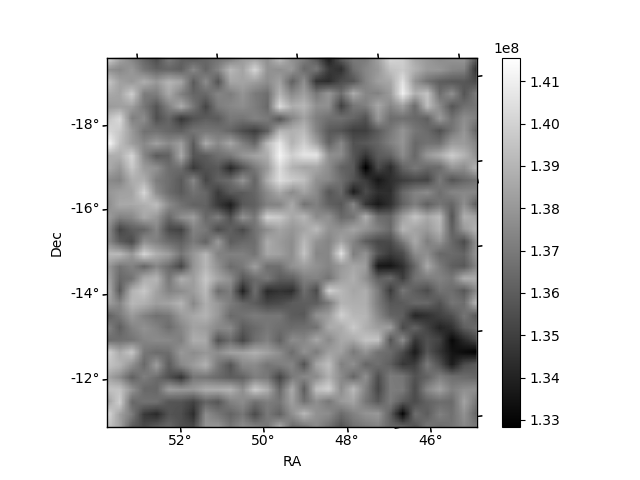
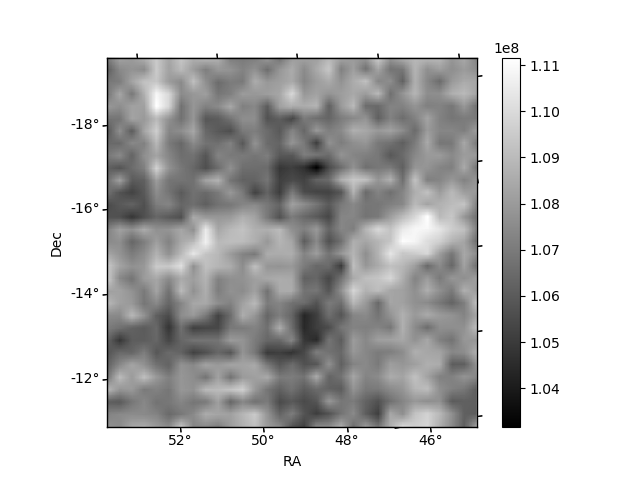
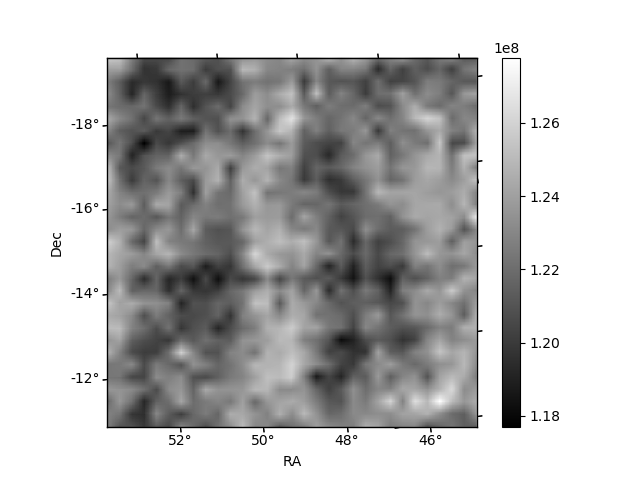
Histogram calculated using DETX and DETY for each event in the final _common_clean file
| Quadrant A | 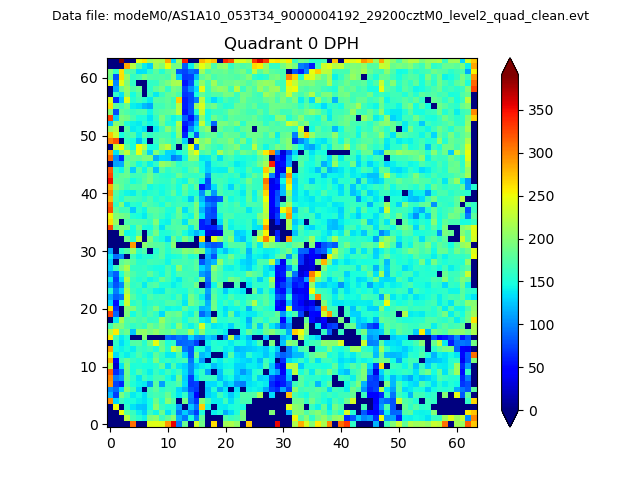 |
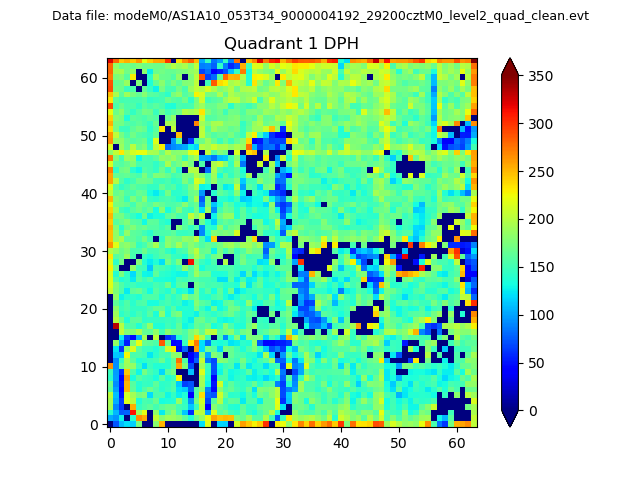 |
Quadrant B |
|---|---|---|---|
| Quadrant D | 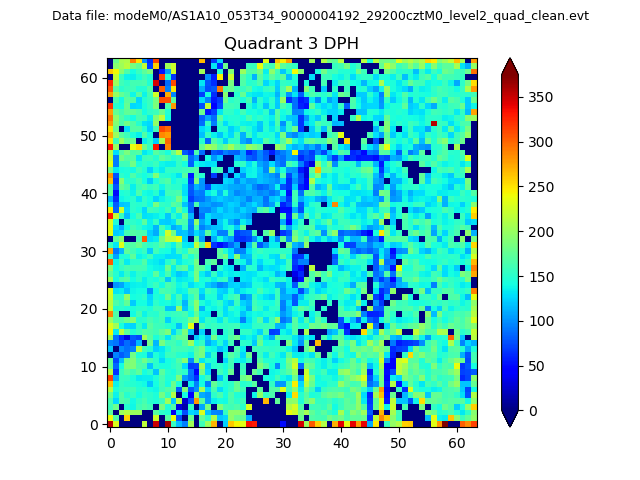 |
 |
Quadrant C |
| Plot type | Count rate plots | Images |
|---|---|---|
| Comparison with Poisson distribution Blue bars denote a histogram of data divided into 1 sec bins. Red curve is a Poisson curve with rate = median count rate of data. |
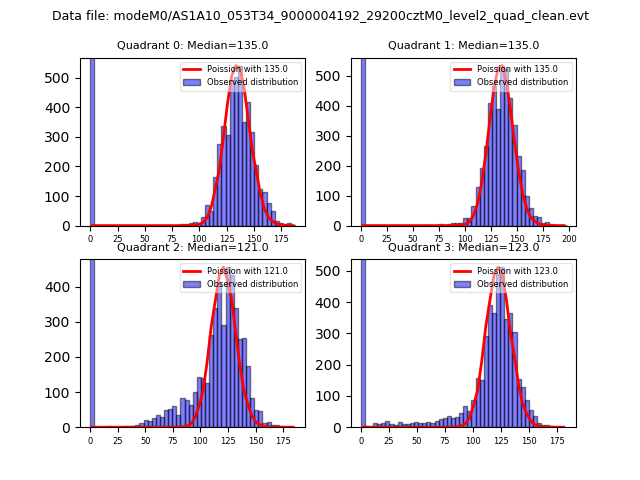 |
 |
| Quadrant-wise count rates Data is divided into 100 sec bins |
 |
|
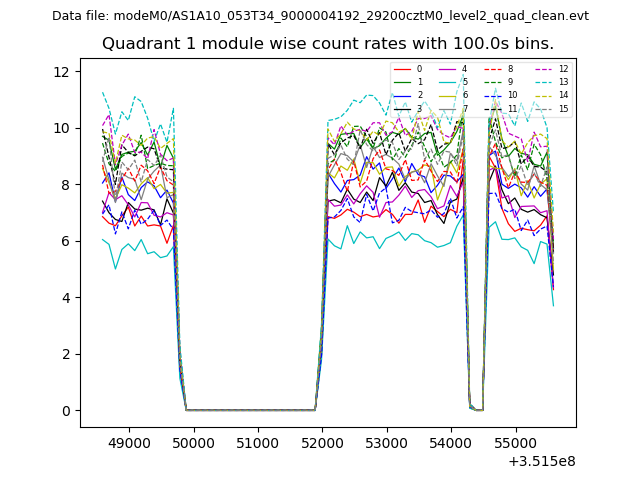
| Module-wise count rates for Quadrant A Data is divided into 100 sec bins |
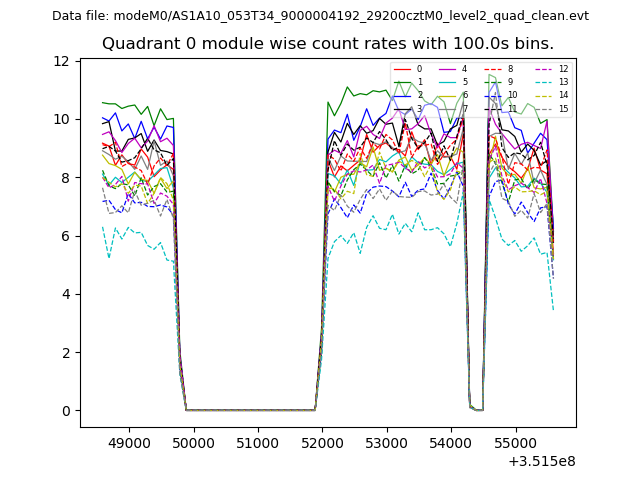 |
 |
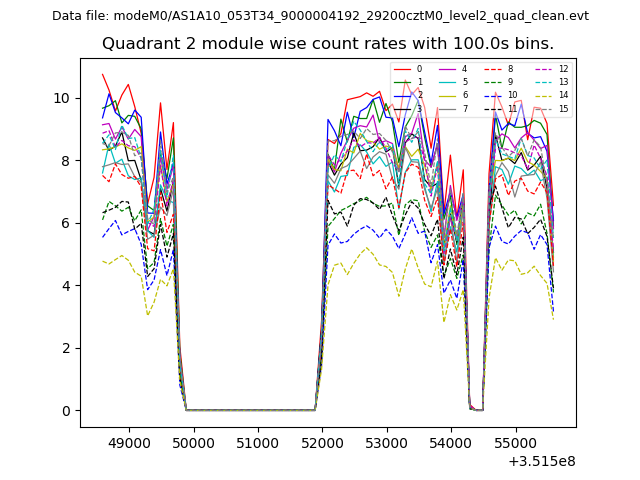
| Module-wise count rates for Quadrant B Data is divided into 100 sec bins |
 |
 |
| Module-wise count rates for Quadrant C Data is divided into 100 sec bins |
 |
 |
| Module-wise count rates for Quadrant D Data is divided into 100 sec bins |
 |
 |
| Parameter | Plot |
|---|---|
| CZT HV Monitor | 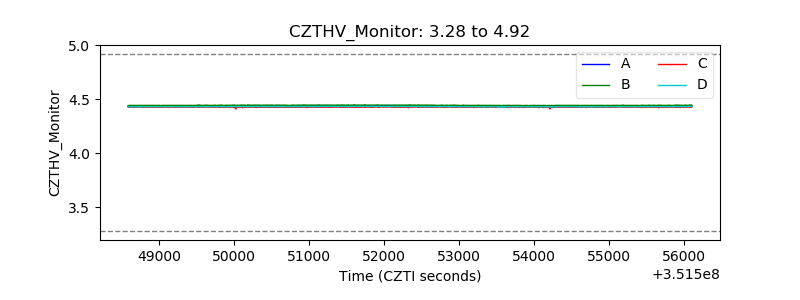 |
| D_VDD | 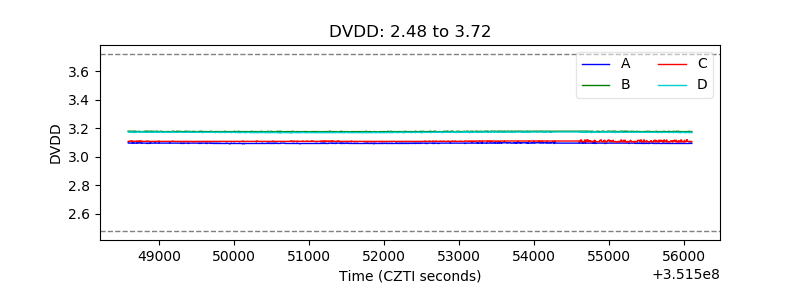 |
| Temperature 1 | 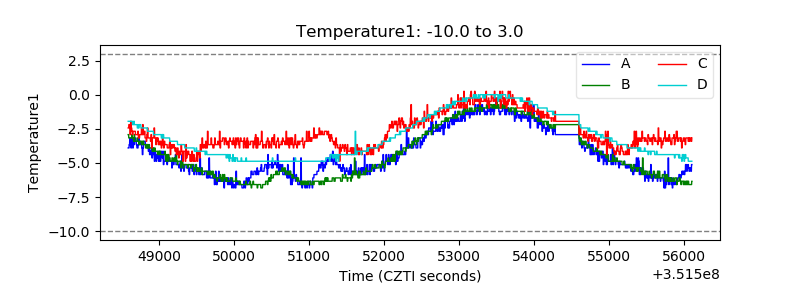 |
| Veto HV Monitor | 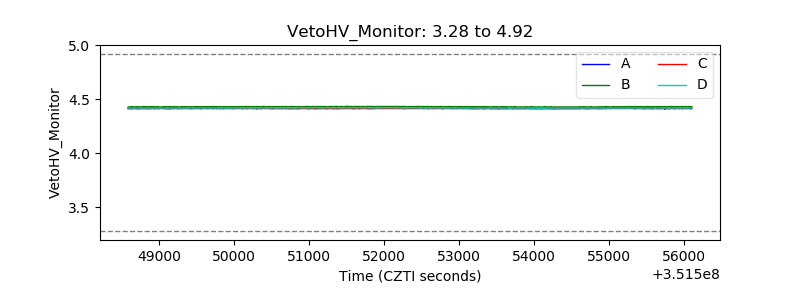 |
| Veto LLD | 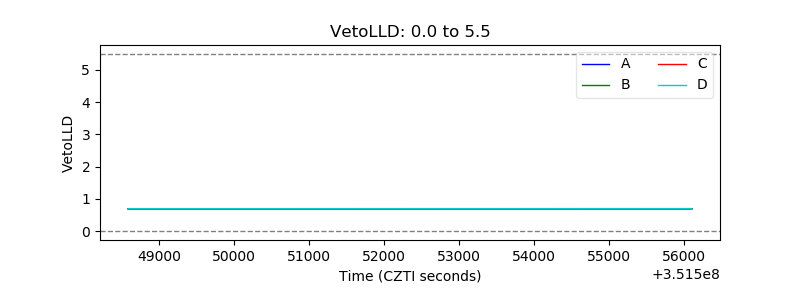 |
| Alpha Counter | 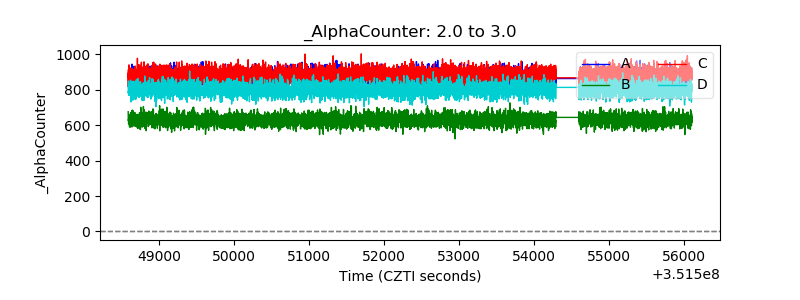 |
| _CPM_Rate | 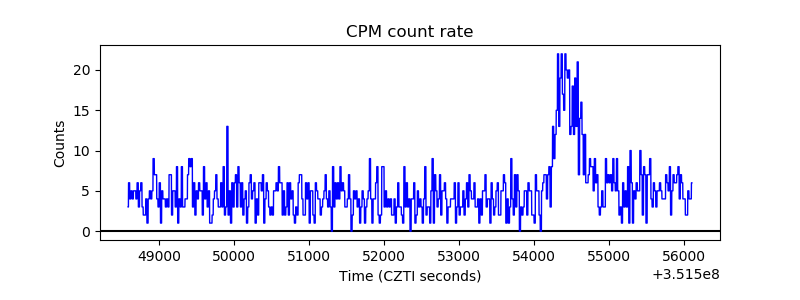 |
| CZT Counter | 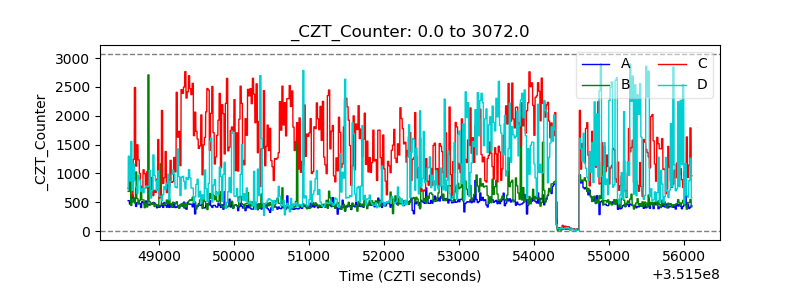 |
| +2.5 Volts monitor |  |
| +5 Volts monitor |  |
| _ROLL_ROT | 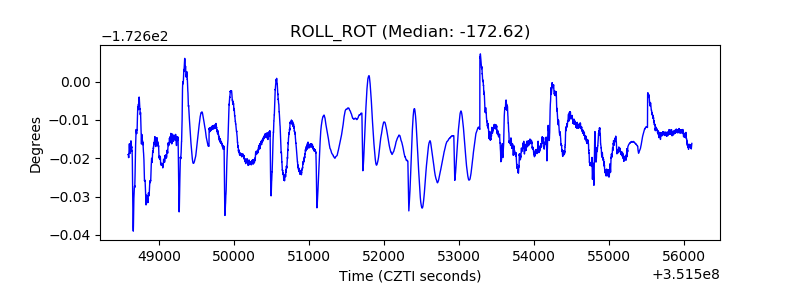 |
| _Roll_DEC | 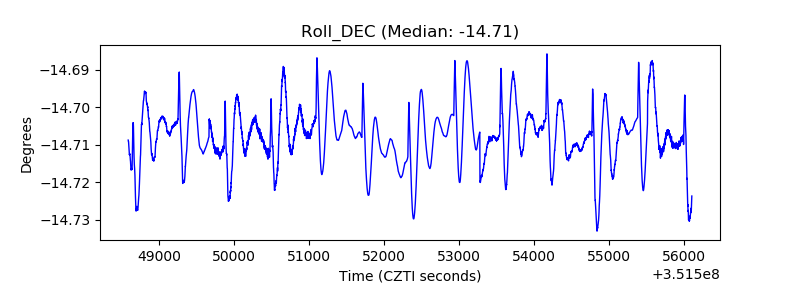 |
| _Roll_RA | 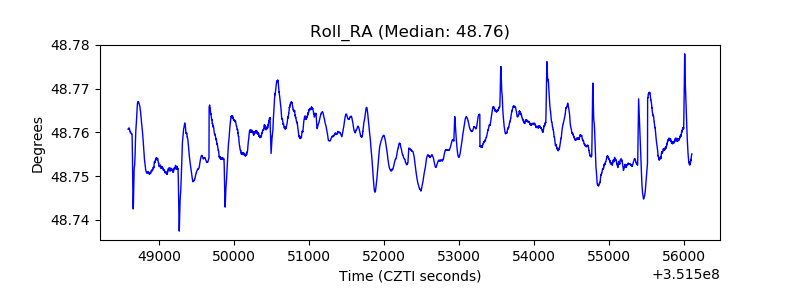 |
| Veto Counter | 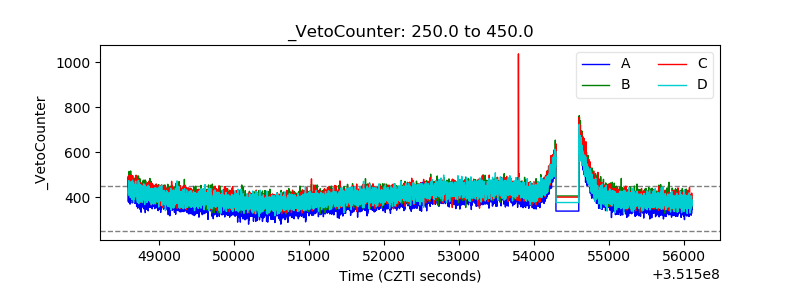 |