| Param | Original file | Final file |
|---|---|---|
| Filename | modeM0/AS1A10_053T34_9000004192_29201cztM0_level2.evt | modeM0/AS1A10_053T34_9000004192_29201cztM0_level2_quad_clean.evt |
| Size (bytes) | 773,202,240 | 89,890,560 |
| Size | 737.4 MB | 85.7 MB |
| Events in quadrant A | 3,631,808 | 573,444 |
| Events in quadrant B | 4,034,931 | 572,721 |
| Events in quadrant C | 7,923,997 | 538,811 |
| Events in quadrant D | 7,309,752 | 504,729 |
| Mode M9 | |||
|---|---|---|---|
| Quadrant | BADHDUFLAG | Total packets | Discarded packets |
| A | 0 | 2 | 0 |
| B | 0 | 2 | 0 |
| C | 0 | 2 | 0 |
| D | 0 | 2 | 0 |
| Mode SS | |||
|---|---|---|---|
| Quadrant | BADHDUFLAG | Total packets | Discarded packets |
| A | 0 | 156 | 0 |
| B | 0 | 156 | 0 |
| C | 0 | 156 | 0 |
| D | 0 | 156 | 0 |
| Mode M0 | |||
|---|---|---|---|
| Quadrant | BADHDUFLAG | Total packets | Discarded packets |
| A | 0 | 15715 | 1 |
| B | 0 | 16833 | 1 |
| C | 0 | 28882 | 3 |
| D | 0 | 27000 | 1 |
| Quadrant | Total seconds | Saturated seconds | Saturation percentage |
|---|---|---|---|
| A | 7644 | 53 | 0.693354% |
| B | 7645 | 109 | 1.425768% |
| C | 7644 | 665 | 8.699634% |
| D | 7644 | 805 | 10.531136% |
Noise dominated data is calculated using 1-second bins in cleaned event files. If a bin has >2000 counts, and if more than 50% of those come from <1% of pixels, then it is considered to be noise-dominated and hence unusable.
| Quadrant | # 1 sec bins | Bins with >0 counts | Bins with >2000 counts | High rate bins dominated by noise | Noise dominated (total time) | Noise dominated (detector-on time) | Marked lightcurve |
|---|---|---|---|---|---|---|---|
| A | 7874 | 7646 | 0 | 0 | 0.00% | 0.00% | 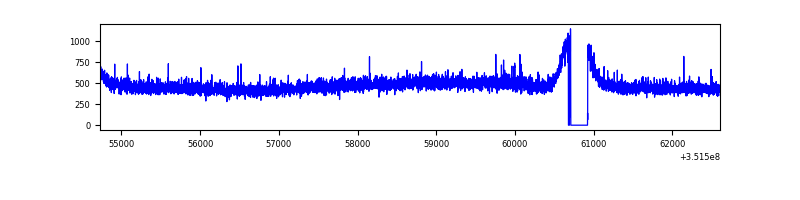 |
| B | 7875 | 7647 | 5 | 5 | 0.06% | 0.07% | 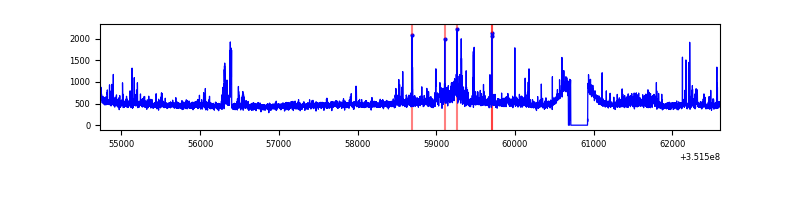 |
| C | 7874 | 7646 | 269 | 269 | 3.42% | 3.52% | 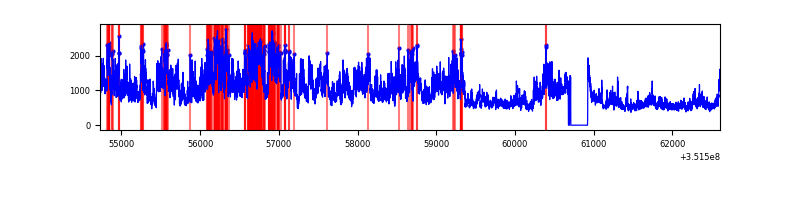 |
| D | 7874 | 7646 | 707 | 707 | 8.98% | 9.25% | 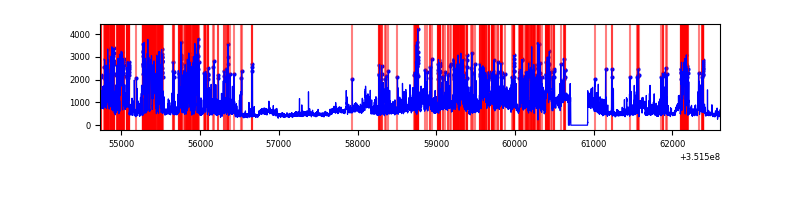 |
Top three noisy pixels from each quadrant. If the there are fewer than three noisy pixels in the level2.evt file, extra rows are filled as -1
| Pixel properties | Quadrant properties | ||||||
|---|---|---|---|---|---|---|---|
| Quadrant | DetID | PixID | Counts | Sigma | Mean | Median | Sigma |
| A | 15 | 169 | 15877 | 79.06 | 936 | 917 | 189.2 |
| A | 13 | 254 | 15870 | 79.02 | 936 | 917 | 189.2 |
| A | 3 | 137 | 9137 | 43.44 | 936 | 917 | 189.2 |
| B | 0 | 183 | 172004 | 945.19 | 932 | 906 | 181.0 |
| B | 0 | 229 | 106786 | 584.91 | 932 | 906 | 181.0 |
| B | 10 | 245 | 48143 | 260.95 | 932 | 906 | 181.0 |
| C | 3 | 233 | 4304326 | 20647.99 | 884 | 891 | 208.4 |
| C | 14 | 238 | 139624 | 665.64 | 884 | 891 | 208.4 |
| C | 2 | 114 | 18383 | 83.93 | 884 | 891 | 208.4 |
| D | 1 | 52 | 2628038 | 12398.14 | 868 | 843 | 211.9 |
| D | 8 | 195 | 851599 | 4014.85 | 868 | 843 | 211.9 |
| D | 12 | 233 | 264369 | 1243.62 | 868 | 843 | 211.9 |
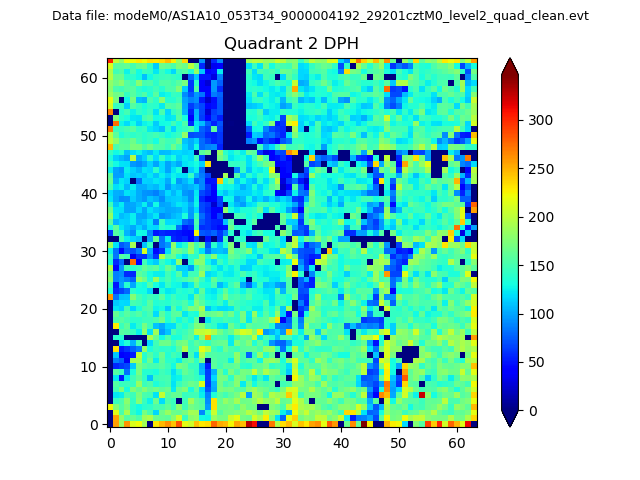
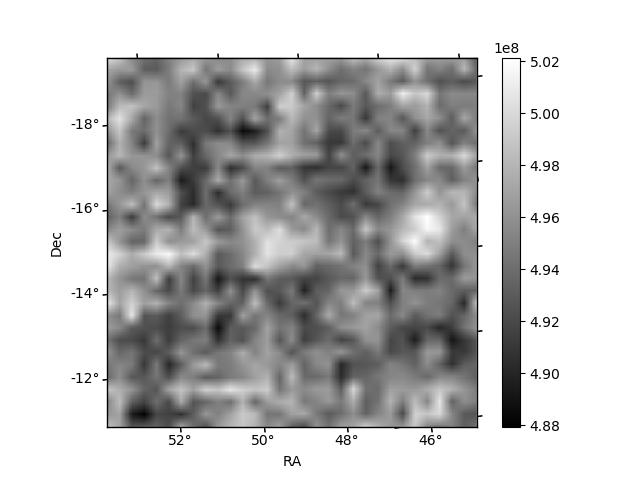
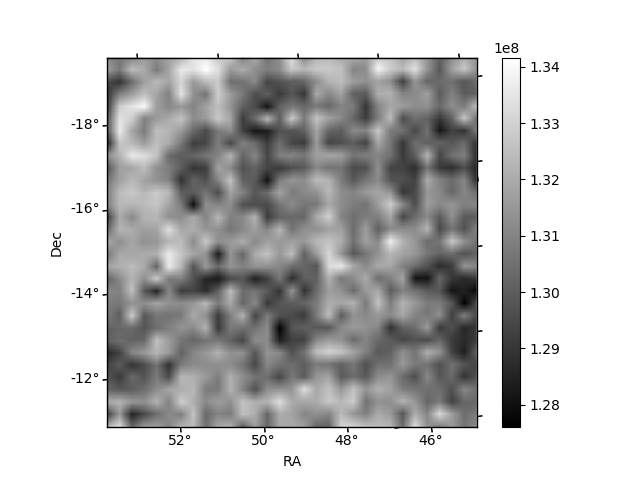
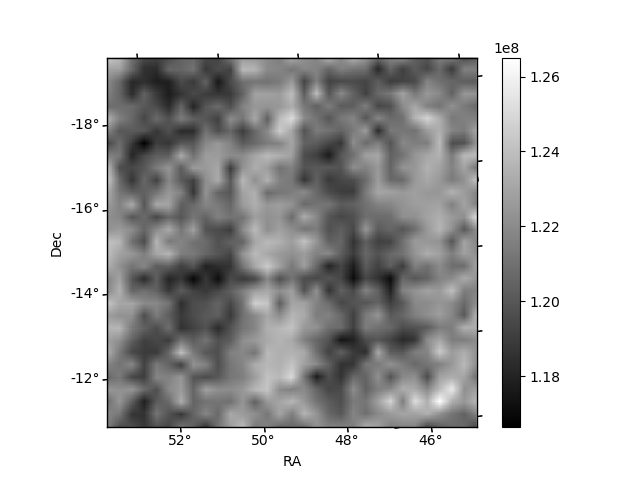
Histogram calculated using DETX and DETY for each event in the final _common_clean file
| Quadrant A | 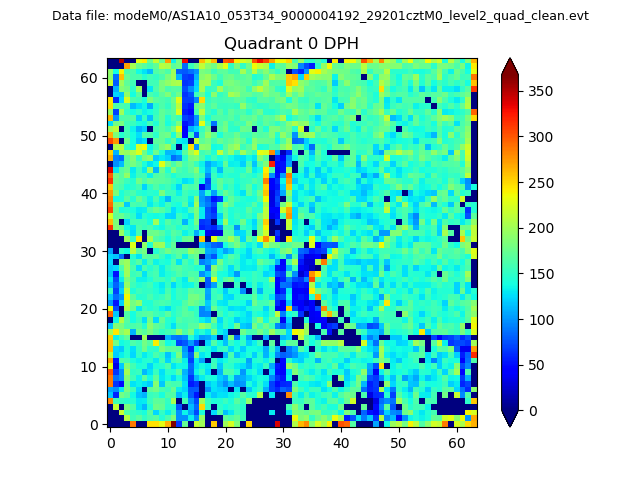 |
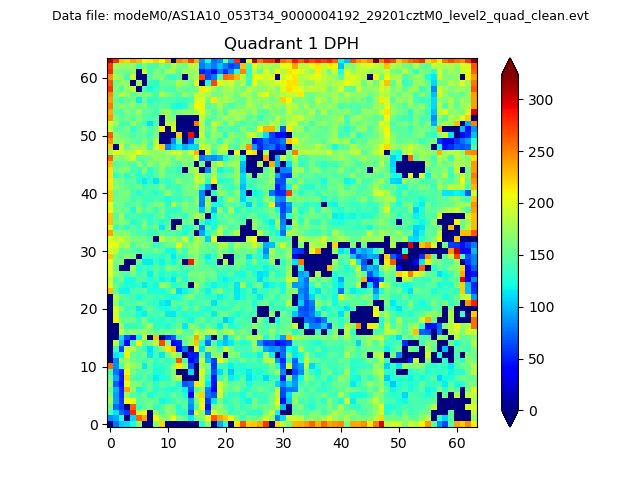 |
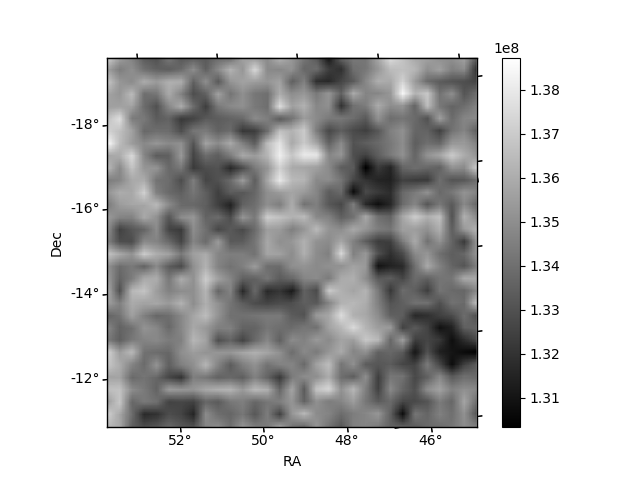
Quadrant B |
|---|---|---|---|
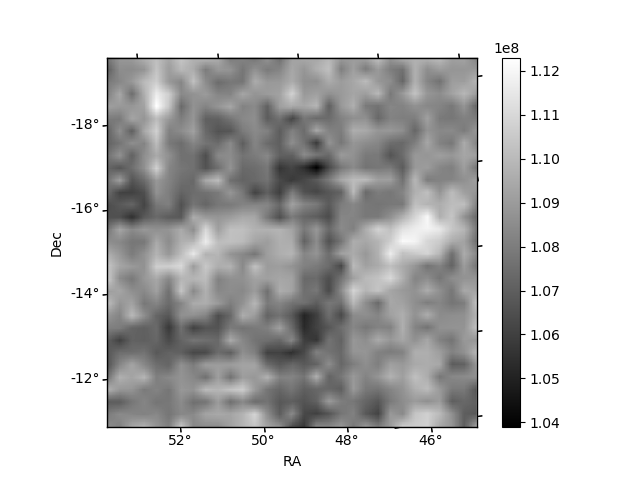
| Quadrant D | 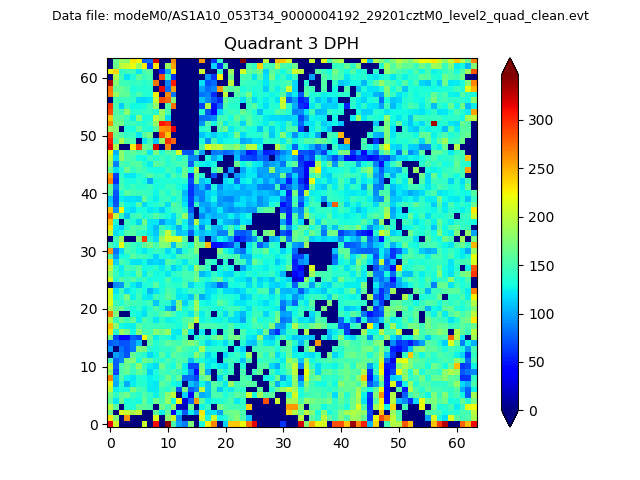 |
 |
Quadrant C |
| Plot type | Count rate plots | Images |
|---|---|---|
| Comparison with Poisson distribution Blue bars denote a histogram of data divided into 1 sec bins. Red curve is a Poisson curve with rate = median count rate of data. |
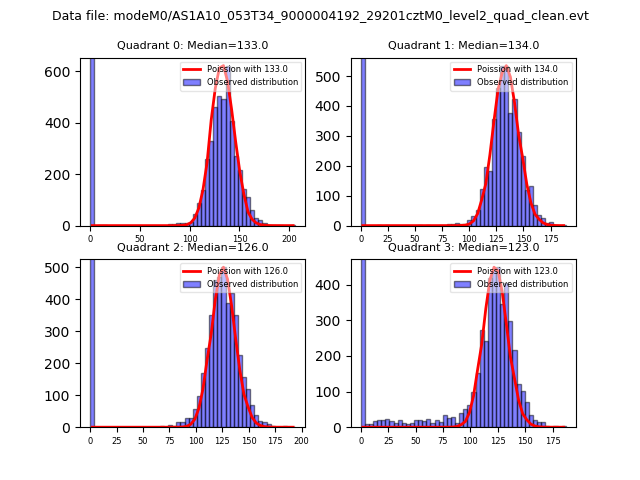 |
 |
| Quadrant-wise count rates Data is divided into 100 sec bins |
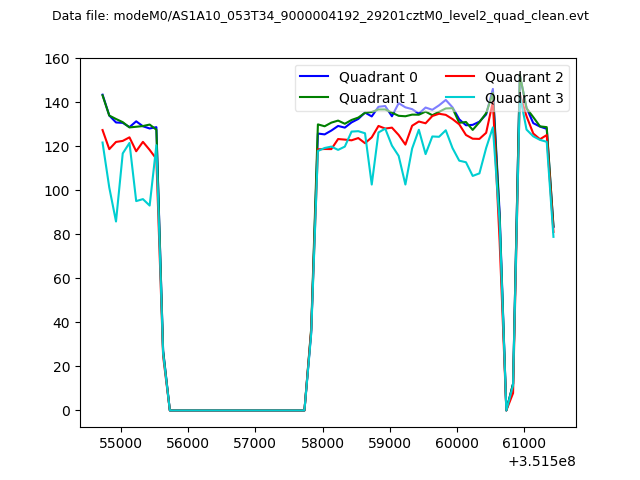 |
|
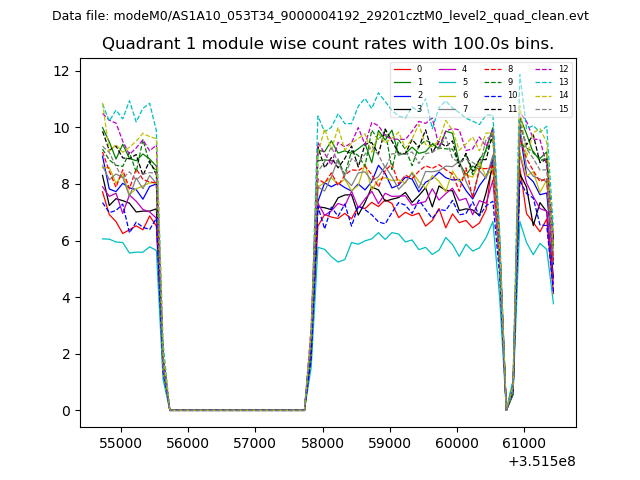
| Module-wise count rates for Quadrant A Data is divided into 100 sec bins |
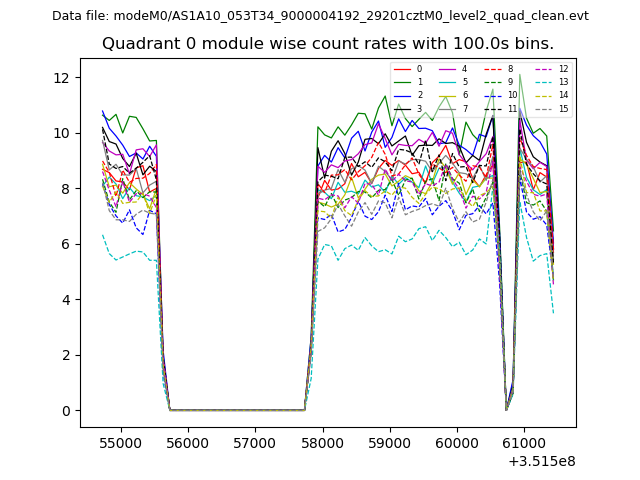 |
 |
| Module-wise count rates for Quadrant B Data is divided into 100 sec bins |
 |
 |
| Module-wise count rates for Quadrant C Data is divided into 100 sec bins |
 |
 |
| Module-wise count rates for Quadrant D Data is divided into 100 sec bins |
 |
 |
| Parameter | Plot |
|---|---|
| CZT HV Monitor |  |
| D_VDD | 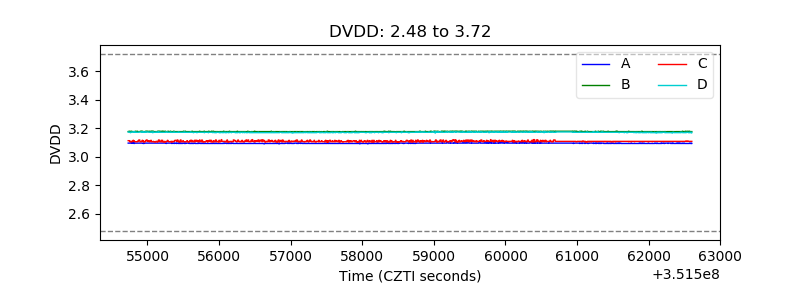 |
| Temperature 1 | 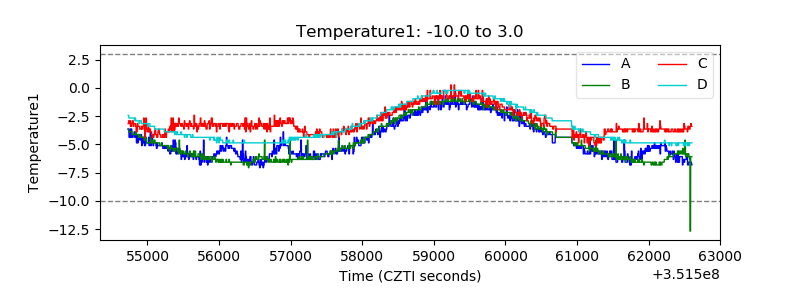 |
| Veto HV Monitor | 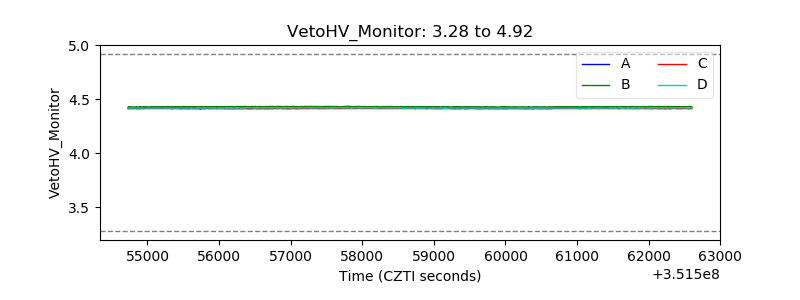 |
| Veto LLD | 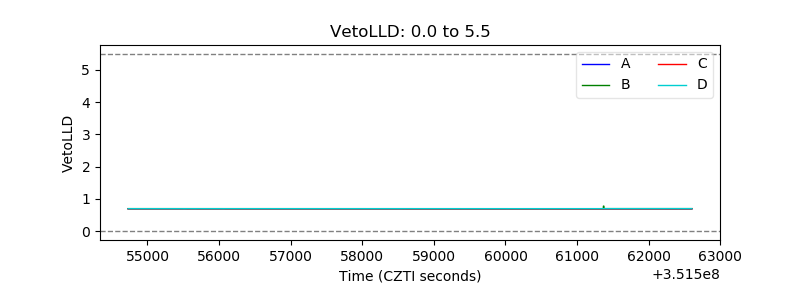 |
| Alpha Counter | 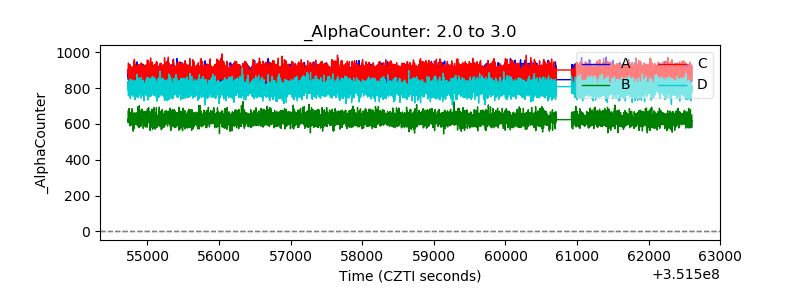 |
| _CPM_Rate | 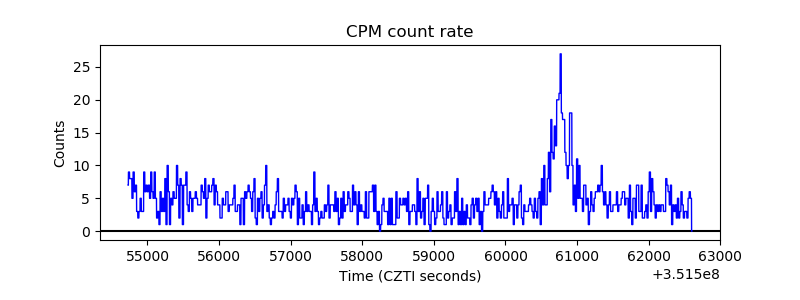 |
| CZT Counter | 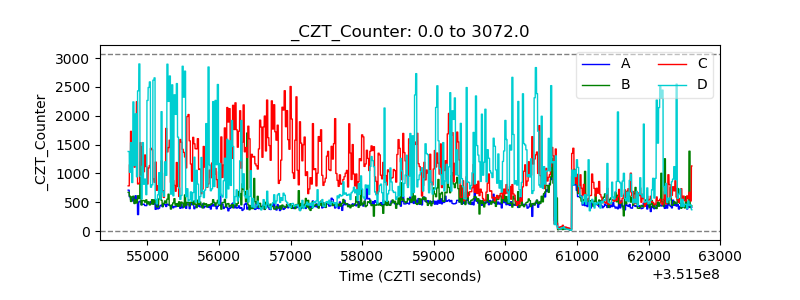 |
| +2.5 Volts monitor |  |
| +5 Volts monitor |  |
| _ROLL_ROT | 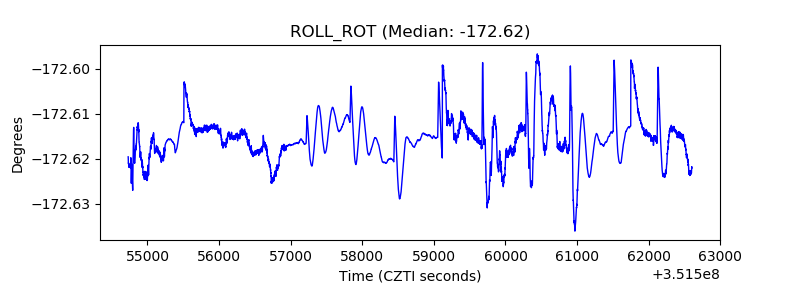 |
| _Roll_DEC | 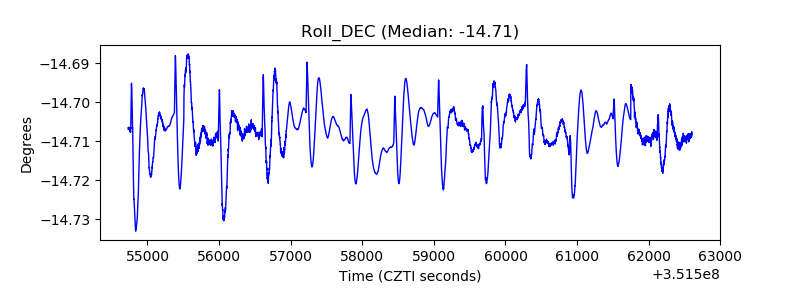 |
| _Roll_RA | 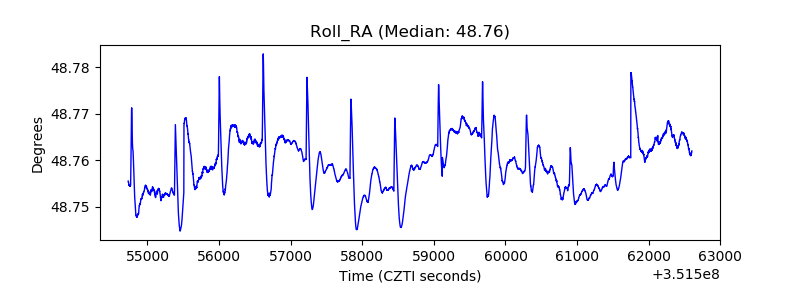 |
| Veto Counter | 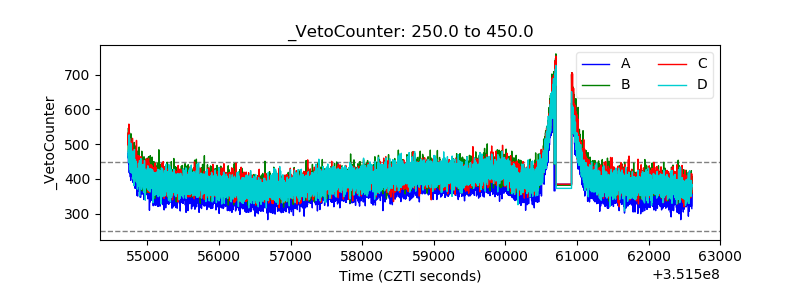 |