| Param | Original file | Final file |
|---|---|---|
| Filename | modeM0/AS1A10_053T34_9000004192_29205cztM0_level2.evt | modeM0/AS1A10_053T34_9000004192_29205cztM0_level2_quad_clean.evt |
| Size (bytes) | 330,848,640 | 44,579,520 |
| Size | 315.5 MB | 42.5 MB |
| Events in quadrant A | 1,154,047 | 318,016 |
| Events in quadrant B | 1,464,967 | 313,265 |
| Events in quadrant C | 4,157,913 | 260,865 |
| Events in quadrant D | 3,072,326 | 277,418 |
| Mode SS | |||
|---|---|---|---|
| Quadrant | BADHDUFLAG | Total packets | Discarded packets |
| A | 0 | 50 | 0 |
| B | 0 | 50 | 0 |
| C | 0 | 50 | 0 |
| D | 0 | 50 | 0 |
| Mode M0 | |||
|---|---|---|---|
| Quadrant | BADHDUFLAG | Total packets | Discarded packets |
| A | 0 | 5018 | 0 |
| B | 0 | 5944 | 0 |
| C | 0 | 14129 | 0 |
| D | 0 | 10855 | 0 |
| Quadrant | Total seconds | Saturated seconds | Saturation percentage |
|---|---|---|---|
| A | 2499 | 4 | 0.160064% |
| B | 2499 | 21 | 0.840336% |
| C | 2499 | 893 | 35.734294% |
| D | 2499 | 375 | 15.006002% |
Noise dominated data is calculated using 1-second bins in cleaned event files. If a bin has >2000 counts, and if more than 50% of those come from <1% of pixels, then it is considered to be noise-dominated and hence unusable.
| Quadrant | # 1 sec bins | Bins with >0 counts | Bins with >2000 counts | High rate bins dominated by noise | Noise dominated (total time) | Noise dominated (detector-on time) | Marked lightcurve |
|---|---|---|---|---|---|---|---|
| A | 2499 | 2499 | 0 | 0 | 0.00% | 0.00% | 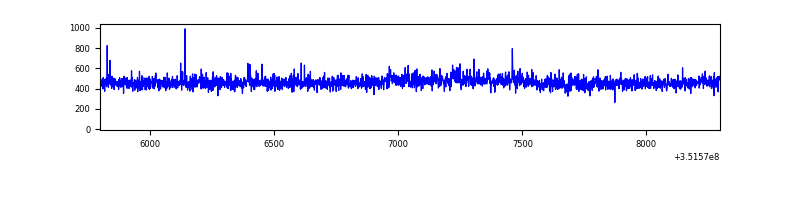 |
| B | 2499 | 2499 | 9 | 9 | 0.36% | 0.36% | 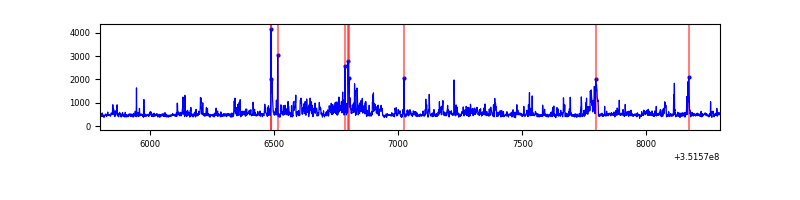 |
| C | 2499 | 2499 | 841 | 841 | 33.65% | 33.65% | 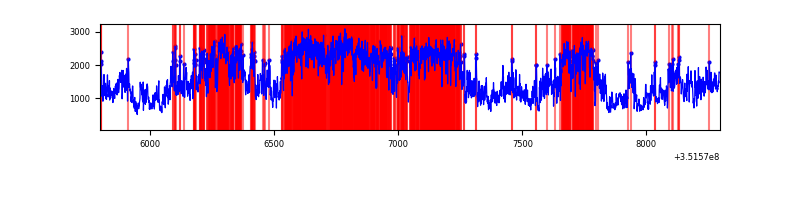 |
| D | 2499 | 2499 | 371 | 371 | 14.85% | 14.85% | 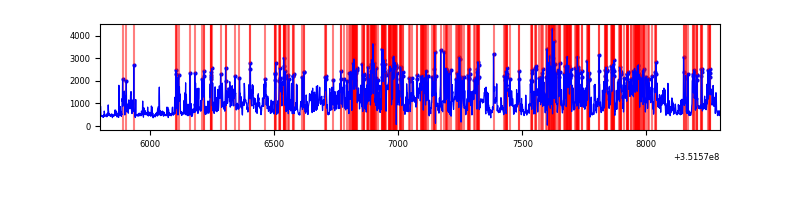 |
Top three noisy pixels from each quadrant. If the there are fewer than three noisy pixels in the level2.evt file, extra rows are filled as -1
| Pixel properties | Quadrant properties | ||||||
|---|---|---|---|---|---|---|---|
| Quadrant | DetID | PixID | Counts | Sigma | Mean | Median | Sigma |
| A | 0 | 13 | 22188 | 356.49 | 293 | 286 | 61.4 |
| A | 13 | 254 | 5239 | 80.62 | 293 | 286 | 61.4 |
| A | 3 | 137 | 2833 | 41.46 | 293 | 286 | 61.4 |
| B | 0 | 183 | 131176 | 2273.29 | 285 | 277 | 57.6 |
| B | 5 | 255 | 119916 | 2077.74 | 285 | 277 | 57.6 |
| B | 0 | 229 | 36061 | 621.44 | 285 | 277 | 57.6 |
| C | 3 | 233 | 3151734 | 52844.22 | 246 | 247 | 59.6 |
| C | 14 | 238 | 38186 | 636.16 | 246 | 247 | 59.6 |
| C | 2 | 114 | 5538 | 88.72 | 246 | 247 | 59.6 |
| D | 1 | 52 | 1585705 | 24359.9 | 264 | 257 | 65.1 |
| D | 8 | 195 | 337042 | 5174.59 | 264 | 257 | 65.1 |
| D | 12 | 233 | 59917 | 916.66 | 264 | 257 | 65.1 |
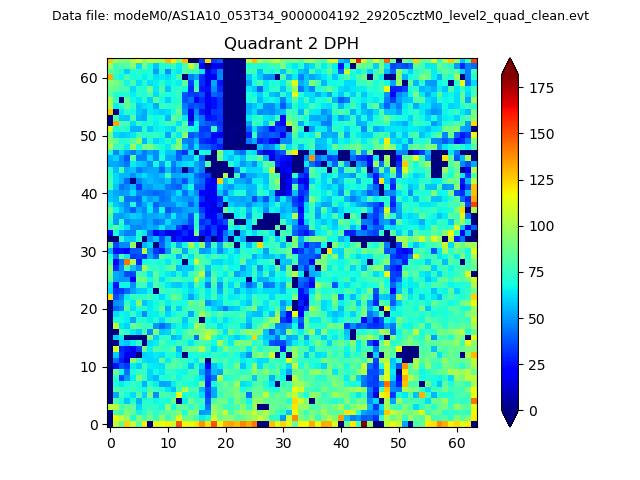
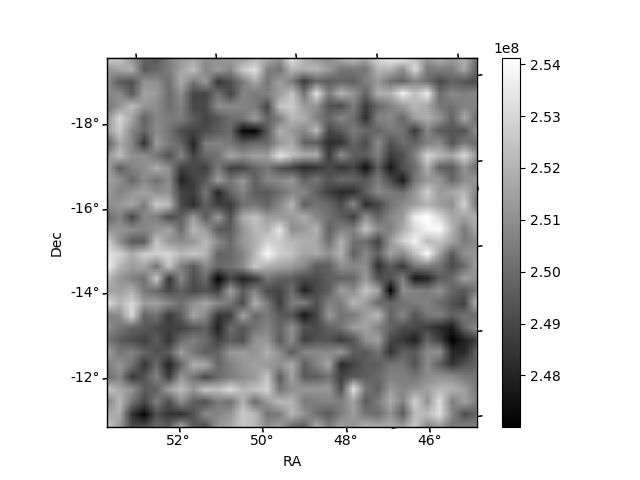
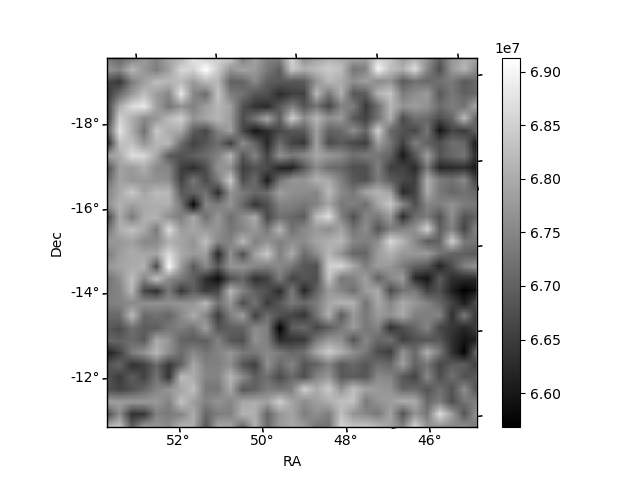
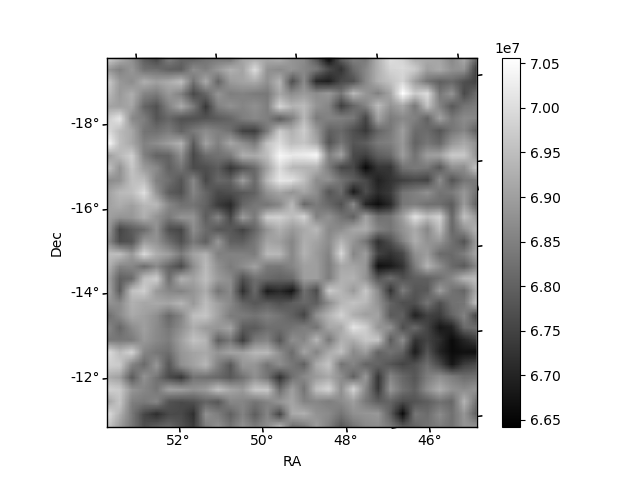
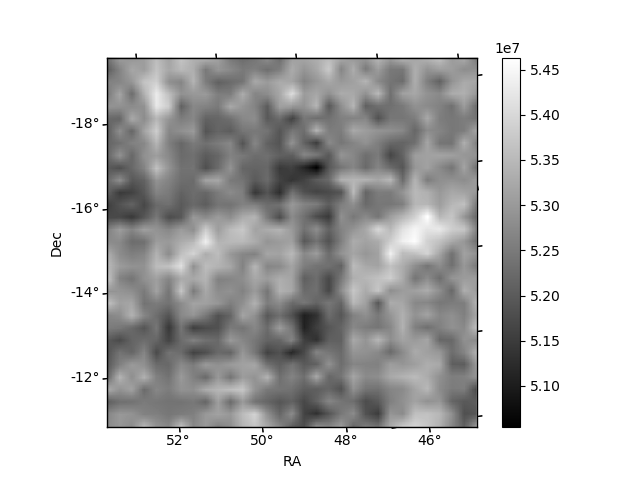
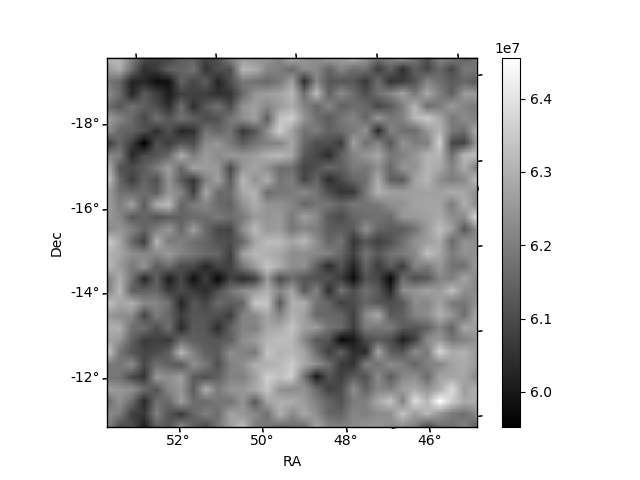
Histogram calculated using DETX and DETY for each event in the final _common_clean file
| Quadrant A | 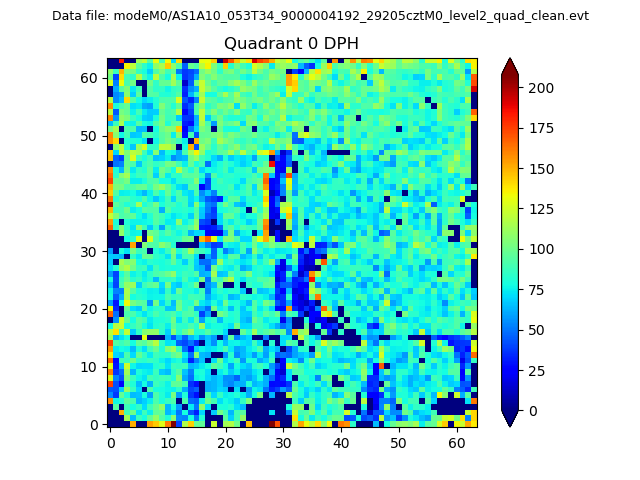 |
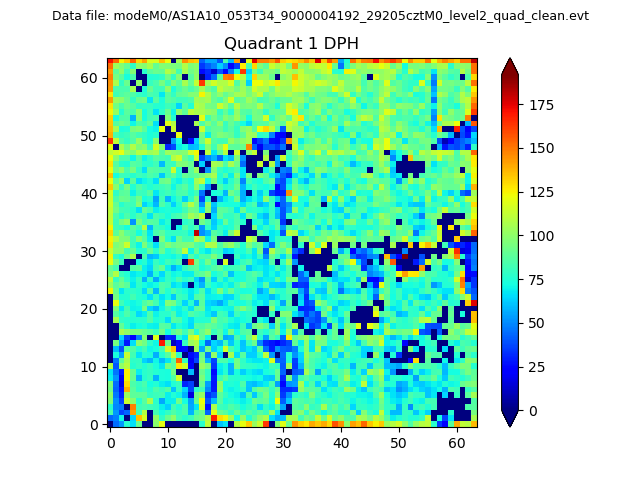 |
Quadrant B |
|---|---|---|---|
| Quadrant D | 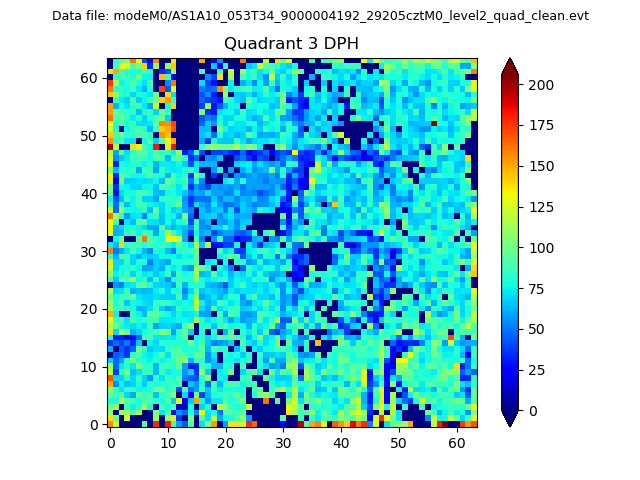 |
 |
Quadrant C |
| Plot type | Count rate plots | Images |
|---|---|---|
| Comparison with Poisson distribution Blue bars denote a histogram of data divided into 1 sec bins. Red curve is a Poisson curve with rate = median count rate of data. |
 |
 |
| Quadrant-wise count rates Data is divided into 100 sec bins |
 |
|
| Module-wise count rates for Quadrant A Data is divided into 100 sec bins |
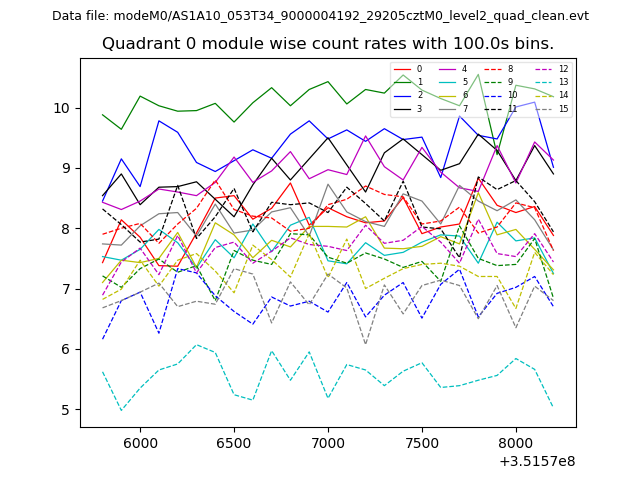 |
 |
| Module-wise count rates for Quadrant B Data is divided into 100 sec bins |
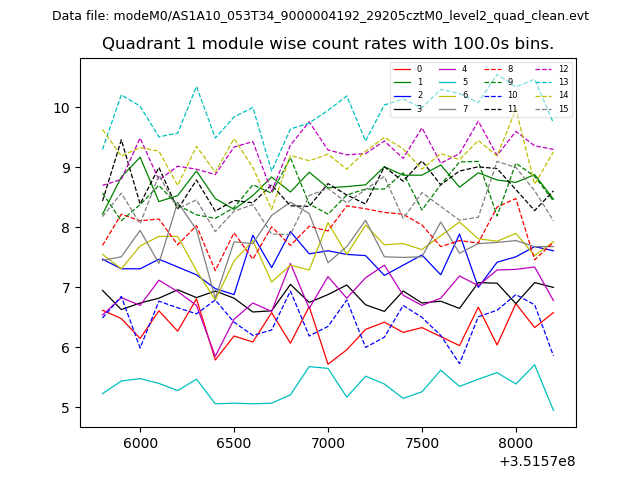 |
 |
| Module-wise count rates for Quadrant C Data is divided into 100 sec bins |
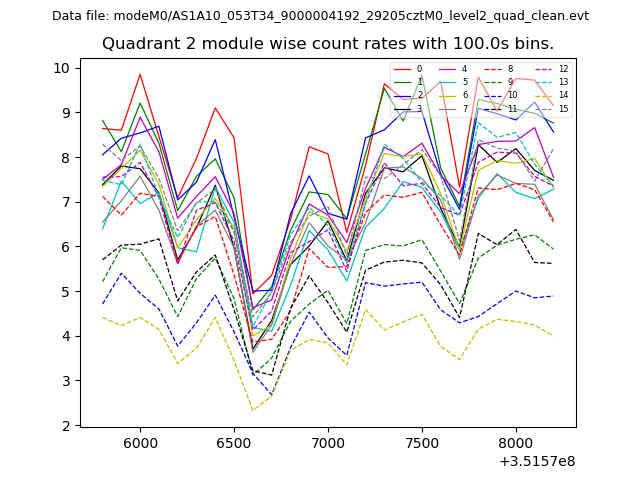 |
 |
| Module-wise count rates for Quadrant D Data is divided into 100 sec bins |
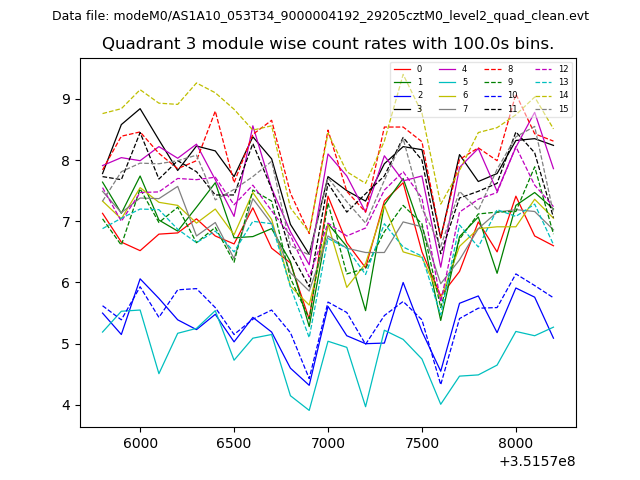 |
 |
| Parameter | Plot |
|---|---|
| CZT HV Monitor | 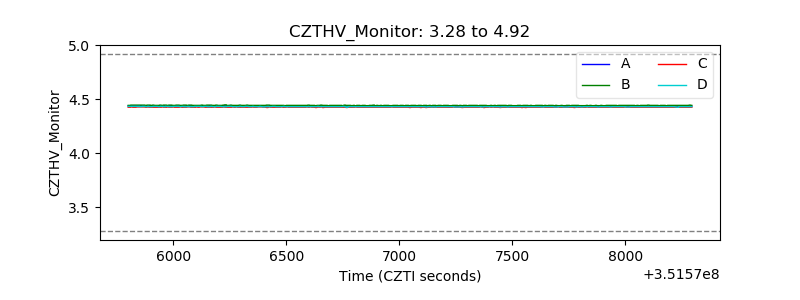 |
| D_VDD | 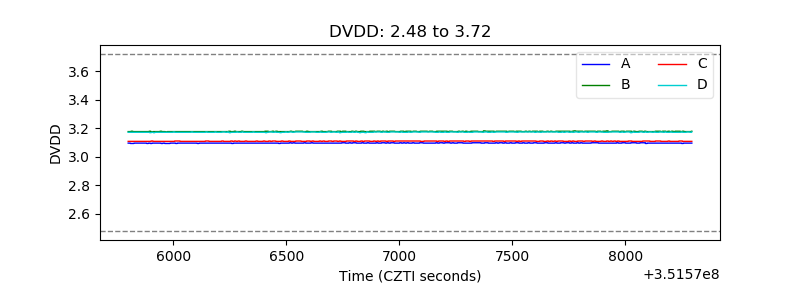 |
| Temperature 1 | 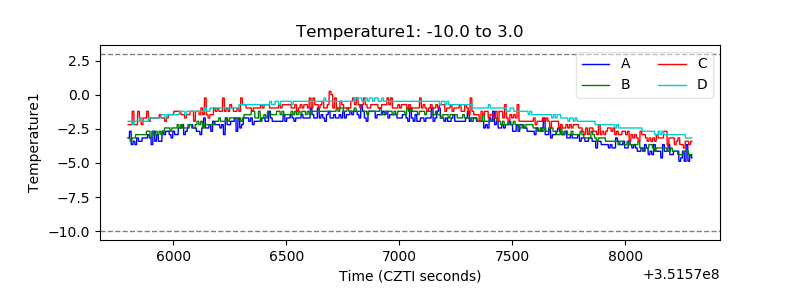 |
| Veto HV Monitor | 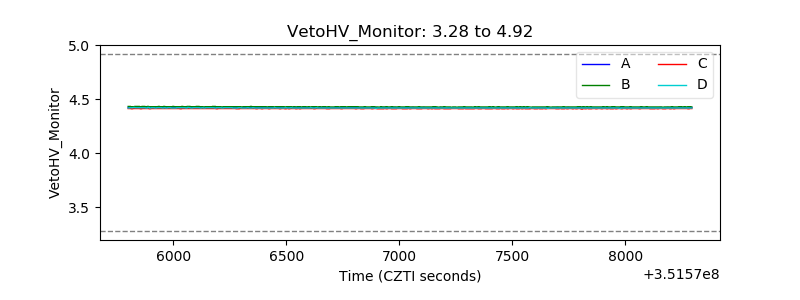 |
| Veto LLD | 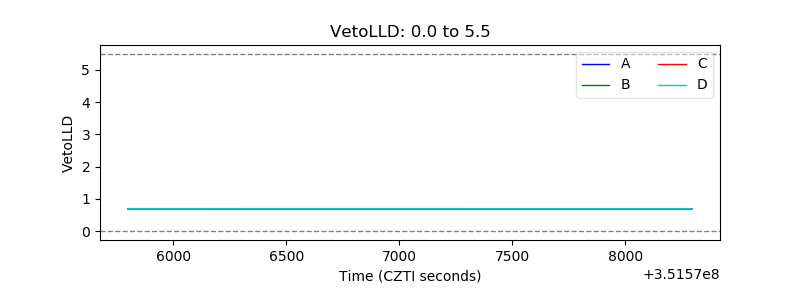 |
| Alpha Counter |  |
| _CPM_Rate | 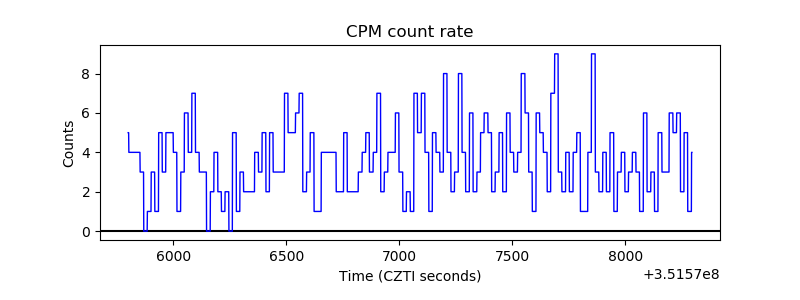 |
| CZT Counter | 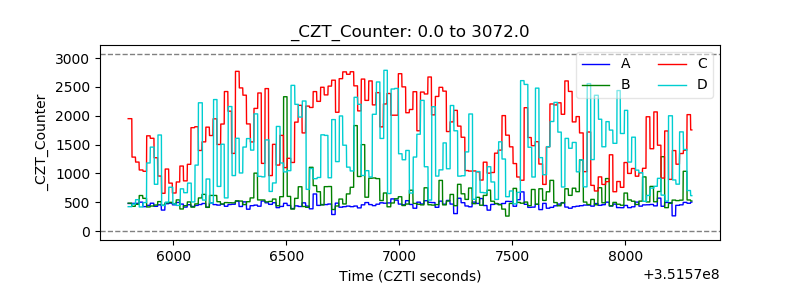 |
| +2.5 Volts monitor |  |
| +5 Volts monitor |  |
| _ROLL_ROT | 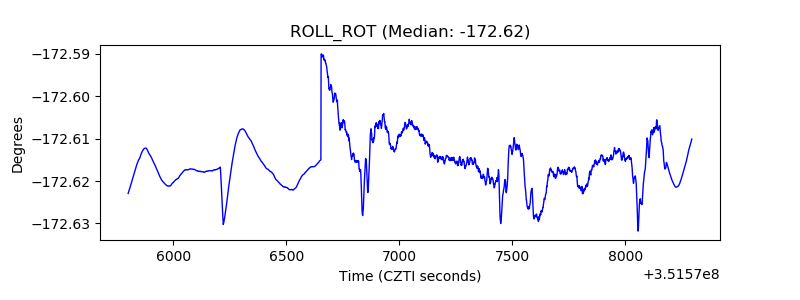 |
| _Roll_DEC | 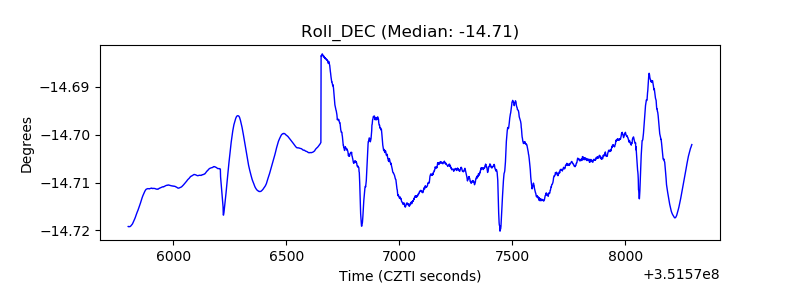 |
| _Roll_RA | 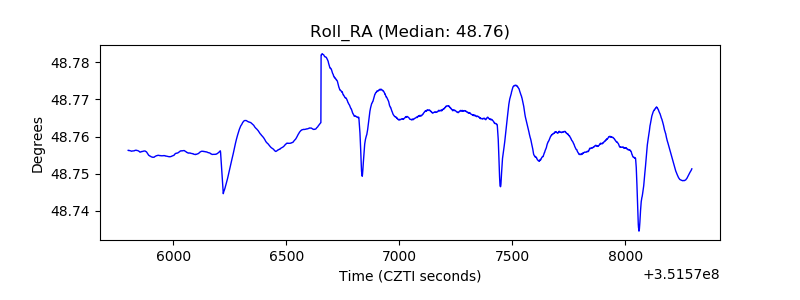 |
| Veto Counter | 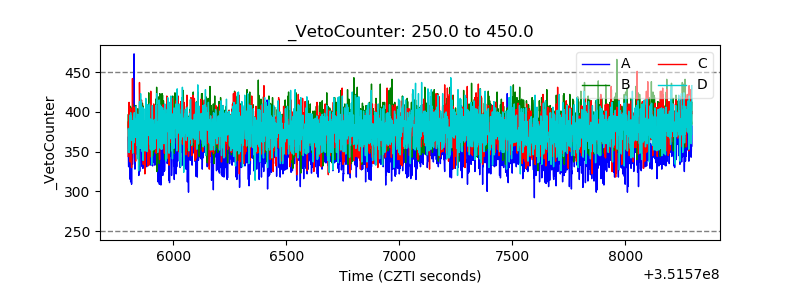 |