| Param | Original file | Final file |
|---|---|---|
| Filename | modeM0/AS1A10_053T41_9000004194cztM0_level2.fits | modeM0/AS1A10_053T41_9000004194cztM0_level2_quad_clean.evt |
| Size (bytes) | 88,539,840 | 80,291,520 |
| Size | 84.4 MB | 76.6 MB |
| Events in quadrant A | 559,286 | 517,245 |
| Events in quadrant B | 535,508 | 516,771 |
| Events in quadrant C | 464,272 | 313,653 |
| Events in quadrant D | 469,022 | 430,976 |
| Mode M9 | |||
|---|---|---|---|
| Quadrant | BADHDUFLAG | Total packets | Discarded packets |
| A | 0 | 16 | 0 |
| B | 0 | 16 | 0 |
| C | 0 | 16 | 0 |
| D | 0 | 16 | 0 |
| Mode SS | |||
|---|---|---|---|
| Quadrant | BADHDUFLAG | Total packets | Discarded packets |
| A | 0 | 192 | 0 |
| B | 0 | 192 | 0 |
| C | 0 | 192 | 0 |
| D | 0 | 192 | 0 |
| Mode M0 | |||
|---|---|---|---|
| Quadrant | BADHDUFLAG | Total packets | Discarded packets |
| A | 0 | 19144 | 0 |
| B | 0 | 21133 | 0 |
| C | 0 | 50827 | 0 |
| D | 0 | 26747 | 0 |
| Quadrant | Total seconds | Saturated seconds | Saturation percentage |
|---|---|---|---|
| A | 9399 | 48 | 0.510693% |
| B | 9399 | 170 | 1.808703% |
| C | 9399 | 3507 | 37.312480% |
| D | 9399 | 345 | 3.670603% |
Noise dominated data is calculated using 1-second bins in cleaned event files. If a bin has >2000 counts, and if more than 50% of those come from <1% of pixels, then it is considered to be noise-dominated and hence unusable.
| Quadrant | # 1 sec bins | Bins with >0 counts | Bins with >2000 counts | High rate bins dominated by noise | Noise dominated (total time) | Noise dominated (detector-on time) | Marked lightcurve |
|---|---|---|---|---|---|---|---|
| A | 10293 | 9398 | 0 | 0 | 0.00% | 0.00% |  |
| B | 10293 | 9397 | 0 | 0 | 0.00% | 0.00% | 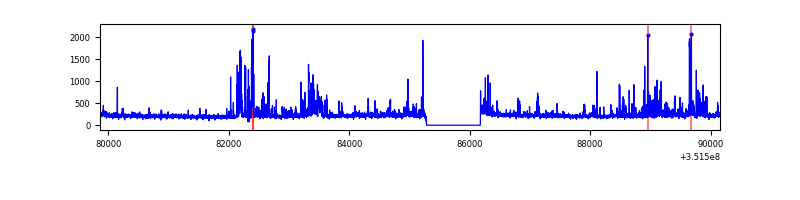 |
| C | 10293 | 9398 | 0 | 0 | 0.00% | 0.00% | 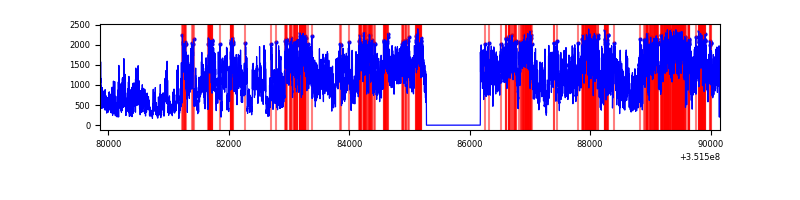 |
| D | 10293 | 9397 | 0 | 0 | 0.00% | 0.00% |  |
Top three noisy pixels from each quadrant. If the there are fewer than three noisy pixels in the level2.evt file, extra rows are filled as -1
| Pixel properties | Quadrant properties | ||||||
|---|---|---|---|---|---|---|---|
| Quadrant | DetID | PixID | Counts | Sigma | Mean | Median | Sigma |
| A | 0 | 29 | 503 | 9.77 | 145 | 137 | 37.5 |
| A | 7 | 110 | 443 | 8.17 | 145 | 137 | 37.5 |
| A | 0 | 30 | 434 | 7.93 | 145 | 137 | 37.5 |
| B | 2 | 9 | 452 | 10.43 | 142 | 136 | 30.3 |
| B | 2 | 8 | 381 | 8.09 | 142 | 136 | 30.3 |
| B | 5 | 232 | 372 | 7.79 | 142 | 136 | 30.3 |
| C | 1 | 80 | 352 | 7.21 | 122 | 114 | 33.0 |
| C | 1 | 81 | 348 | 7.09 | 122 | 114 | 33.0 |
| C | 12 | 241 | 338 | 6.79 | 122 | 114 | 33.0 |
| D | 15 | 46 | 380 | 6.96 | 133 | 121 | 37.2 |
| D | 4 | 246 | 374 | 6.8 | 133 | 121 | 37.2 |
| D | 1 | 3 | 352 | 6.21 | 133 | 121 | 37.2 |
Histogram calculated using DETX and DETY for each event in the final _common_clean file
| Quadrant A | 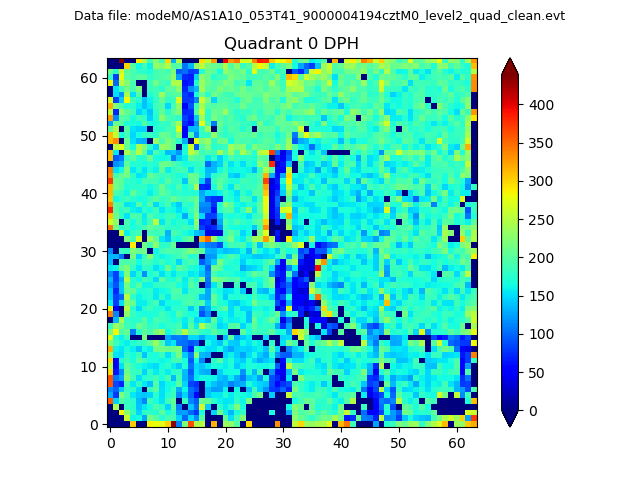 |
 |
Quadrant B |
|---|---|---|---|
| Quadrant D | 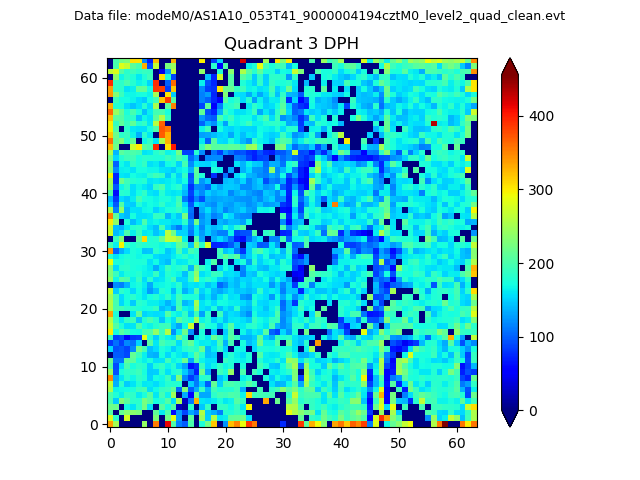 |
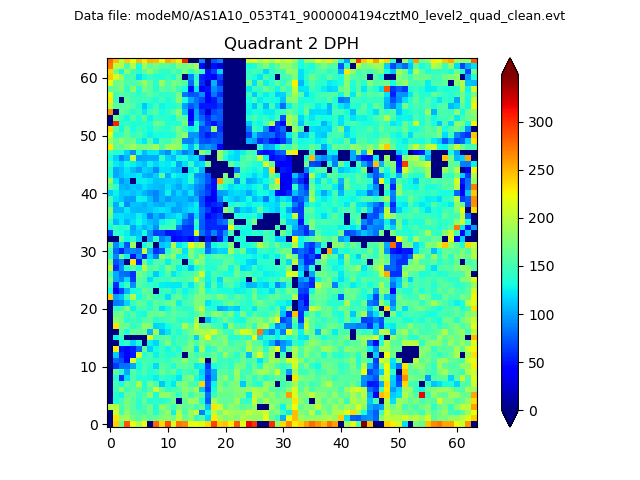 |
Quadrant C |
| Plot type | Count rate plots | Images |
|---|---|---|
| Comparison with Poisson distribution Blue bars denote a histogram of data divided into 1 sec bins. Red curve is a Poisson curve with rate = median count rate of data. |
 |
 |
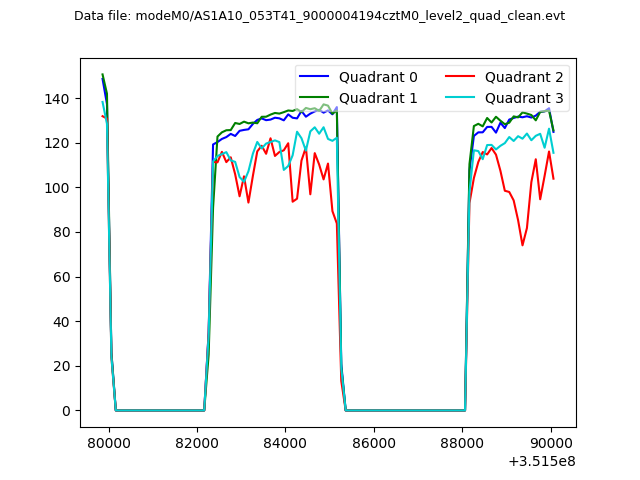
| Quadrant-wise count rates Data is divided into 100 sec bins |
 |
|
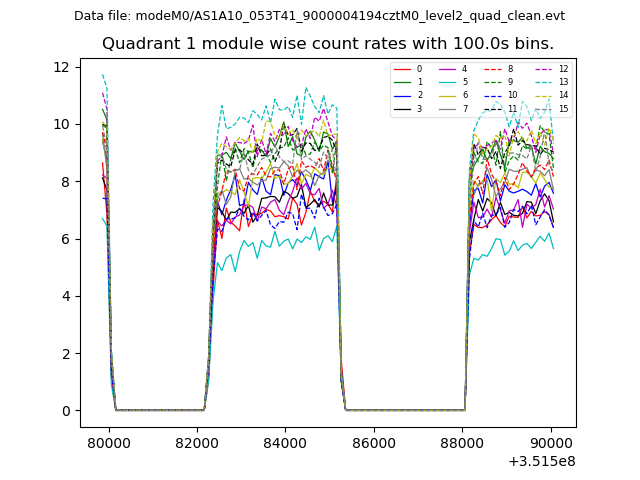
| Module-wise count rates for Quadrant A Data is divided into 100 sec bins |
 |
 |
| Module-wise count rates for Quadrant B Data is divided into 100 sec bins |
 |
 |
| Module-wise count rates for Quadrant C Data is divided into 100 sec bins |
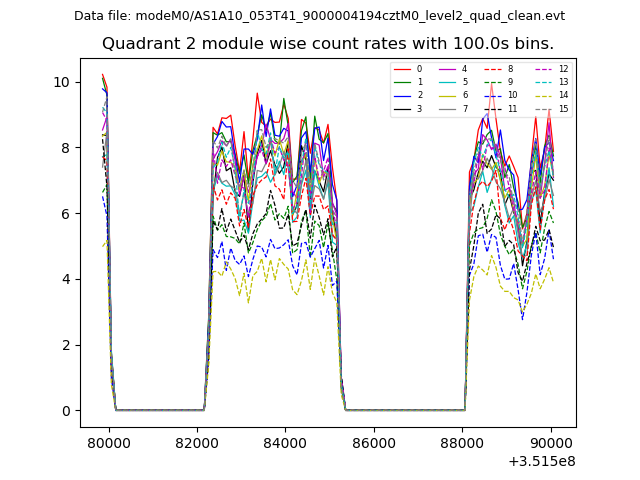 |
 |
| Module-wise count rates for Quadrant D Data is divided into 100 sec bins |
 |
 |
| Parameter | Plot |
|---|---|
| CZT HV Monitor |  |
| D_VDD | 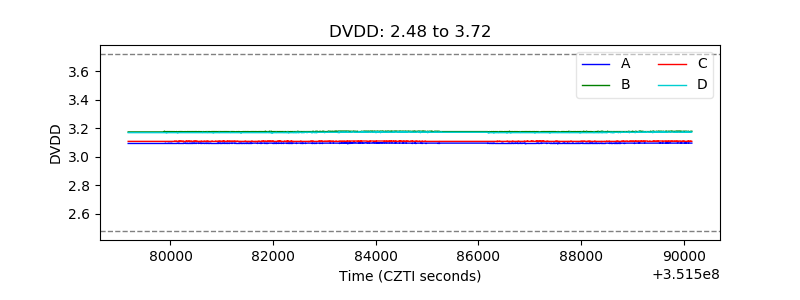 |
| Temperature 1 |  |
| Veto HV Monitor |  |
| Veto LLD | 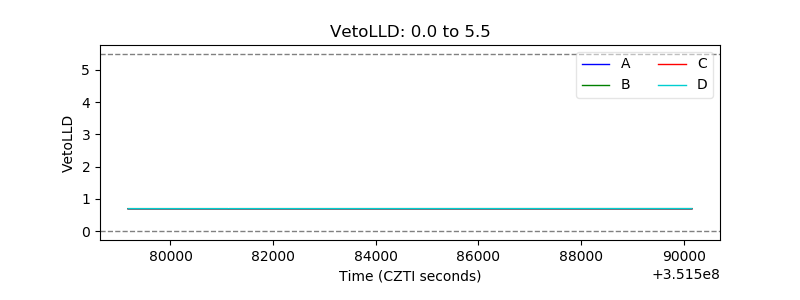 |
| Alpha Counter |  |
| _CPM_Rate | 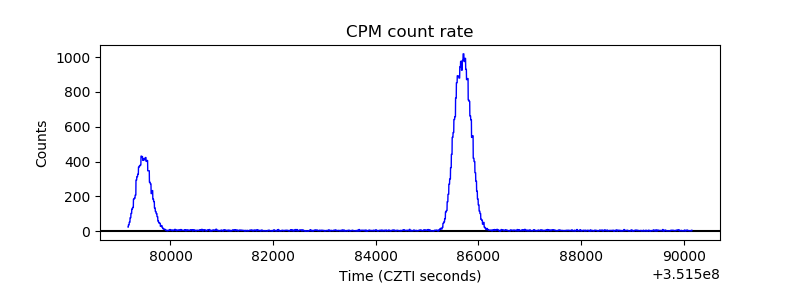 |
| CZT Counter |  |
| +2.5 Volts monitor | 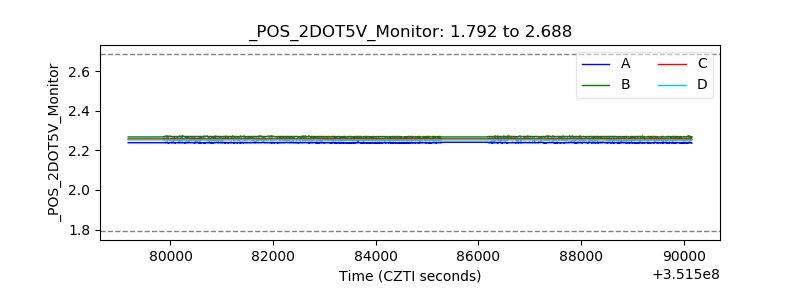 |
| +5 Volts monitor |  |
| _ROLL_ROT |  |
| _Roll_DEC |  |
| _Roll_RA | 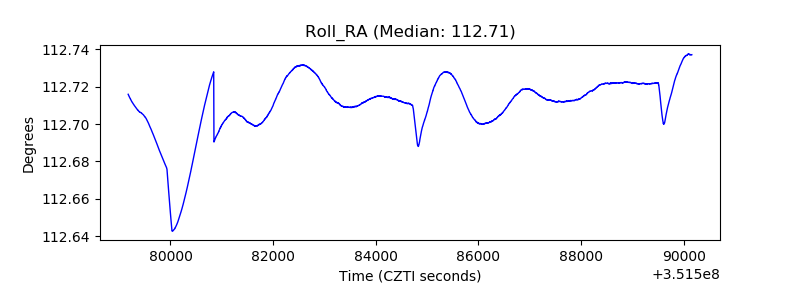 |
| Veto Counter | 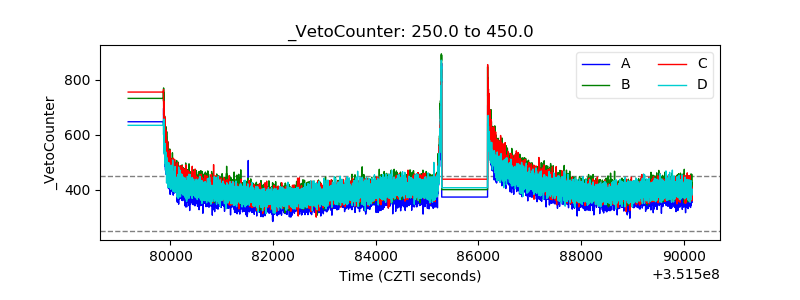 |