| Param | Original file | Final file |
|---|---|---|
| Filename | modeM0/AS1A10_053T41_9000004194_29205cztM0_level2.evt | modeM0/AS1A10_053T41_9000004194_29205cztM0_level2_quad_clean.evt |
| Size (bytes) | 769,636,800 | 67,003,200 |
| Size | 734.0 MB | 63.9 MB |
| Events in quadrant A | 3,342,507 | 412,314 |
| Events in quadrant B | 3,821,781 | 414,438 |
| Events in quadrant C | 10,379,398 | 347,067 |
| Events in quadrant D | 5,298,559 | 373,138 |
| Mode M9 | |||
|---|---|---|---|
| Quadrant | BADHDUFLAG | Total packets | Discarded packets |
| A | 0 | 16 | 0 |
| B | 0 | 16 | 0 |
| C | 0 | 16 | 0 |
| D | 0 | 16 | 0 |
| Mode SS | |||
|---|---|---|---|
| Quadrant | BADHDUFLAG | Total packets | Discarded packets |
| A | 0 | 142 | 0 |
| B | 0 | 142 | 0 |
| C | 0 | 142 | 0 |
| D | 0 | 142 | 0 |
| Mode M0 | |||
|---|---|---|---|
| Quadrant | BADHDUFLAG | Total packets | Discarded packets |
| A | 0 | 14148 | 2 |
| B | 0 | 15529 | 2 |
| C | 0 | 35724 | 2 |
| D | 0 | 20419 | 2 |
| Quadrant | Total seconds | Saturated seconds | Saturation percentage |
|---|---|---|---|
| A | 6906 | 46 | 0.666087% |
| B | 6906 | 148 | 2.143064% |
| C | 6906 | 2308 | 33.420214% |
| D | 6906 | 320 | 4.633652% |
Noise dominated data is calculated using 1-second bins in cleaned event files. If a bin has >2000 counts, and if more than 50% of those come from <1% of pixels, then it is considered to be noise-dominated and hence unusable.
| Quadrant | # 1 sec bins | Bins with >0 counts | Bins with >2000 counts | High rate bins dominated by noise | Noise dominated (total time) | Noise dominated (detector-on time) | Marked lightcurve |
|---|---|---|---|---|---|---|---|
| A | 7801 | 6907 | 0 | 0 | 0.00% | 0.00% | 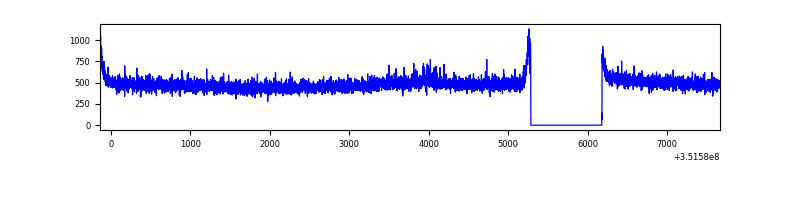 |
| B | 7801 | 6907 | 68 | 68 | 0.87% | 0.98% | 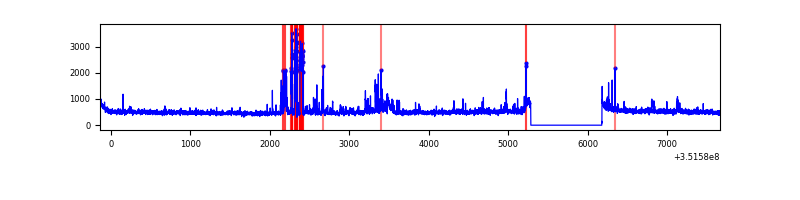 |
| C | 7801 | 6907 | 1524 | 1524 | 19.54% | 22.06% | 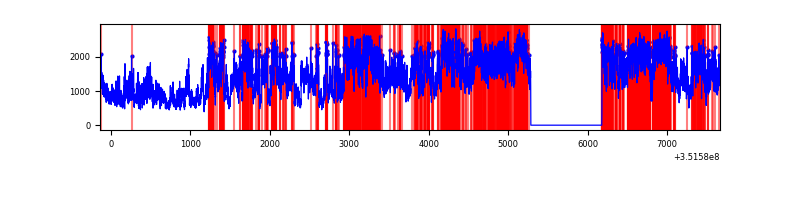 |
| D | 7801 | 6907 | 211 | 211 | 2.70% | 3.05% | 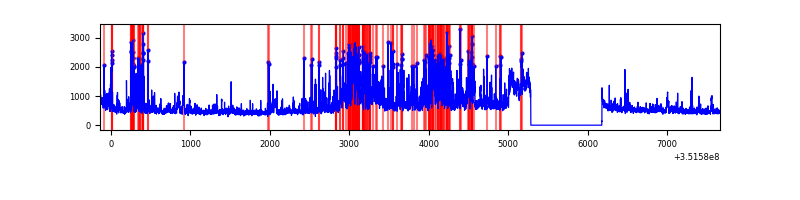 |
Top three noisy pixels from each quadrant. If the there are fewer than three noisy pixels in the level2.evt file, extra rows are filled as -1
| Pixel properties | Quadrant properties | ||||||
|---|---|---|---|---|---|---|---|
| Quadrant | DetID | PixID | Counts | Sigma | Mean | Median | Sigma |
| A | 0 | 13 | 34044 | 192.12 | 856 | 837 | 172.8 |
| A | 13 | 254 | 13154 | 71.26 | 856 | 837 | 172.8 |
| A | 3 | 137 | 8455 | 44.07 | 856 | 837 | 172.8 |
| B | 10 | 246 | 250070 | 1511.91 | 852 | 829 | 164.9 |
| B | 0 | 229 | 100650 | 605.52 | 852 | 829 | 164.9 |
| B | 10 | 245 | 65010 | 389.33 | 852 | 829 | 164.9 |
| C | 3 | 233 | 7304896 | 41441.04 | 754 | 760 | 176.3 |
| C | 14 | 238 | 120188 | 677.59 | 754 | 760 | 176.3 |
| C | 2 | 114 | 15701 | 84.77 | 754 | 760 | 176.3 |
| D | 1 | 52 | 1264722 | 6485.1 | 812 | 788 | 194.9 |
| D | 8 | 195 | 715873 | 3669.02 | 812 | 788 | 194.9 |
| D | 7 | 80 | 80024 | 406.55 | 812 | 788 | 194.9 |
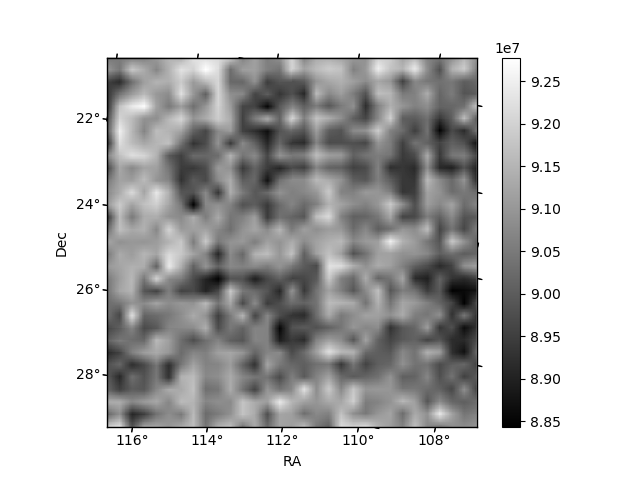
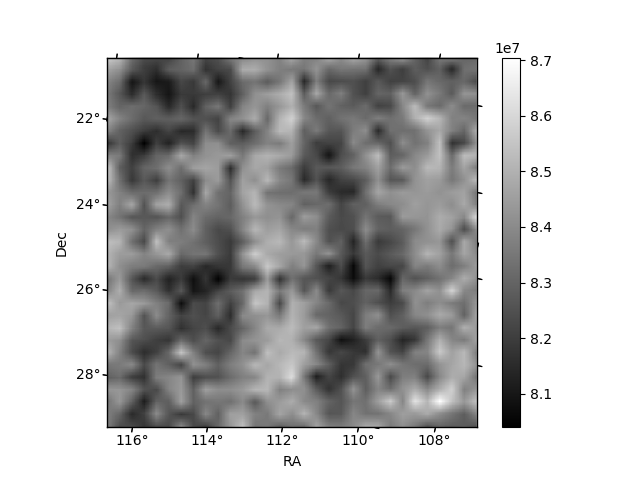
Histogram calculated using DETX and DETY for each event in the final _common_clean file
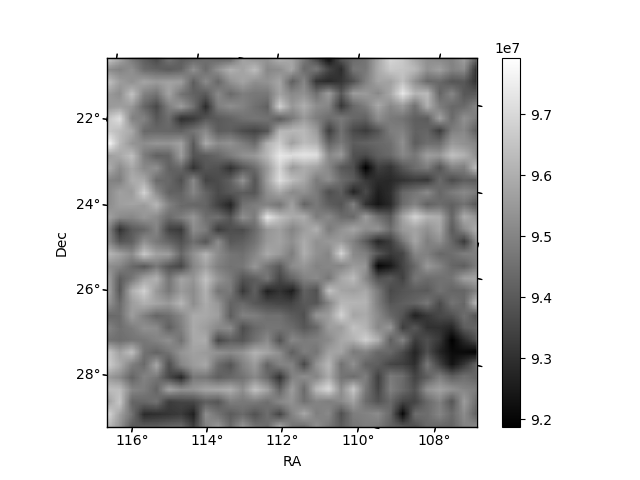
| Quadrant A | 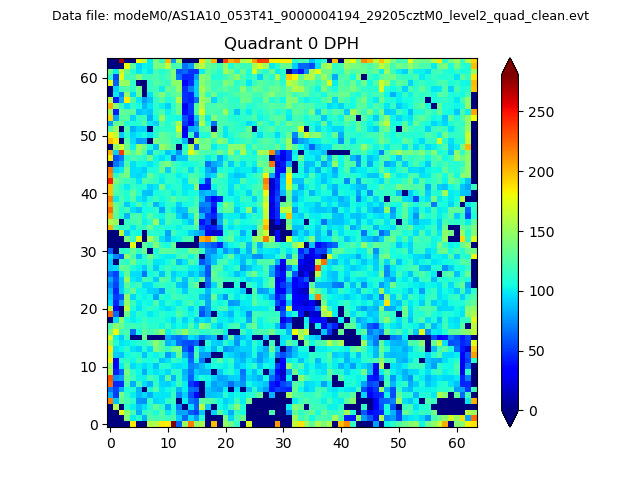 |
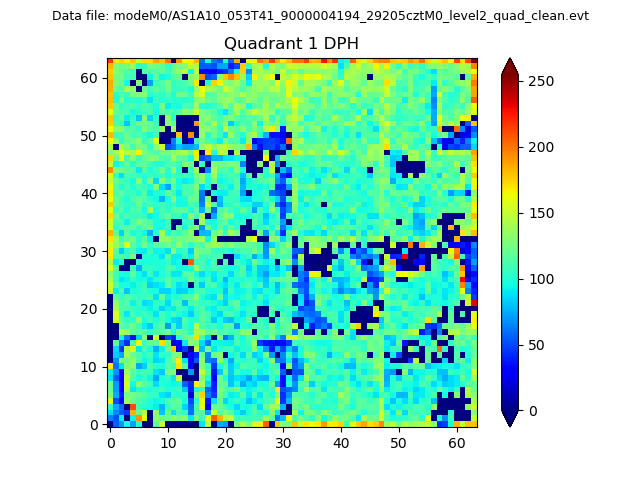 |
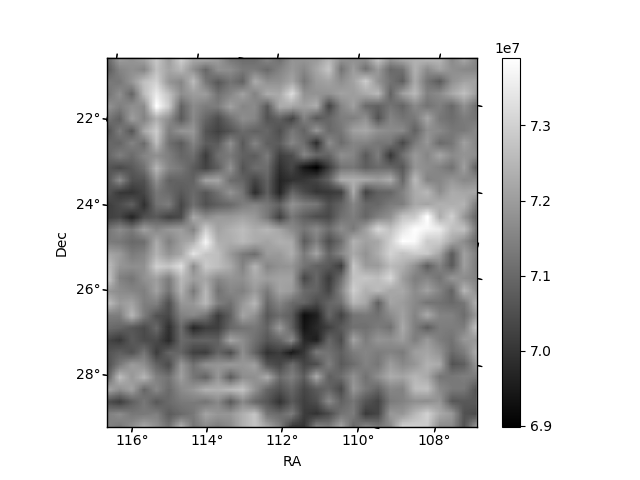
Quadrant B |
|---|---|---|---|
| Quadrant D | 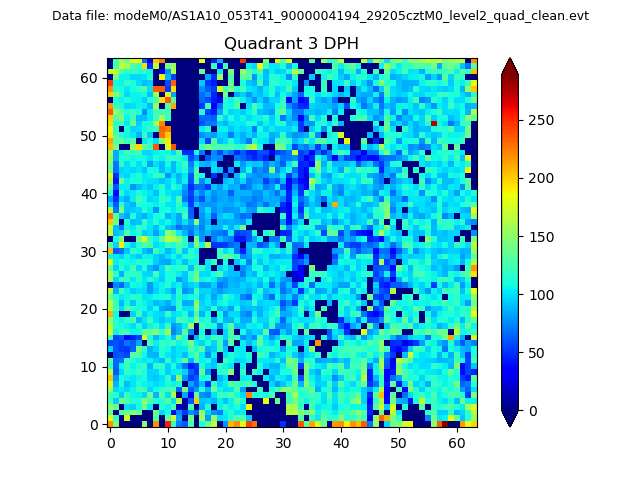 |
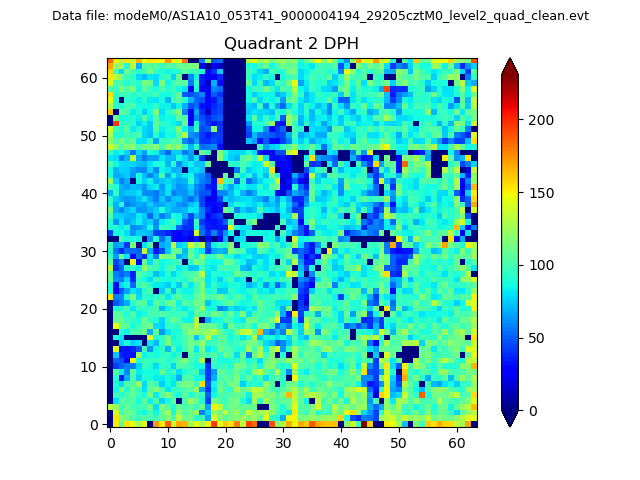 |
Quadrant C |
| Plot type | Count rate plots | Images |
|---|---|---|
| Comparison with Poisson distribution Blue bars denote a histogram of data divided into 1 sec bins. Red curve is a Poisson curve with rate = median count rate of data. |
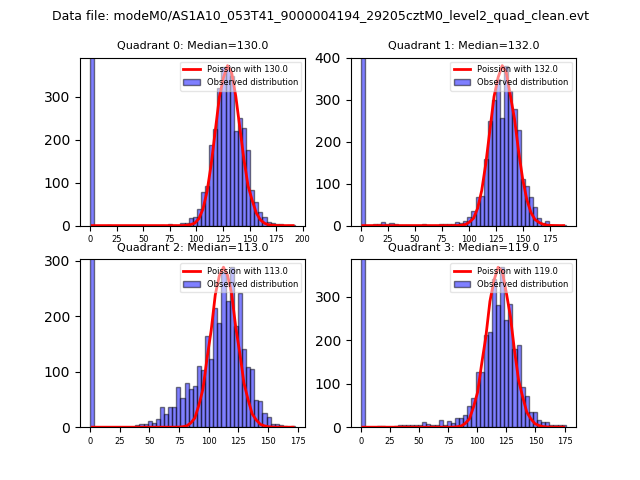 |
 |
| Quadrant-wise count rates Data is divided into 100 sec bins |
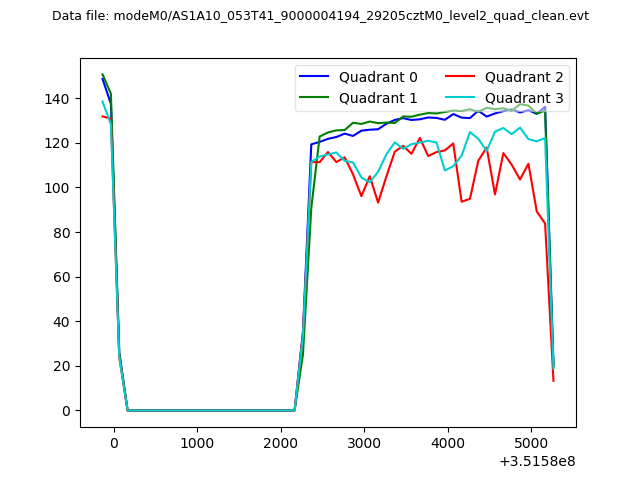 |
|
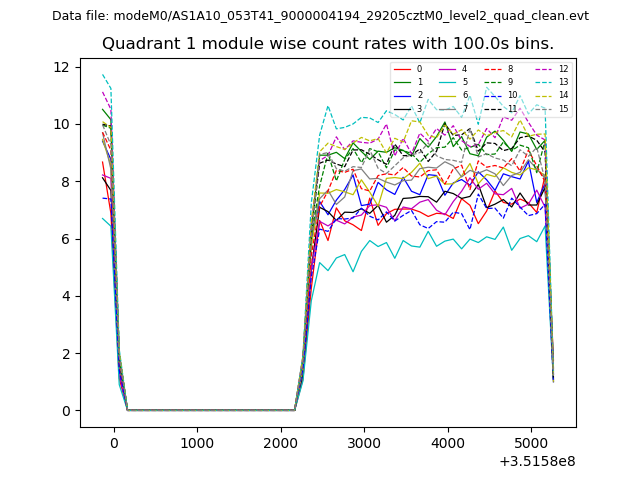
| Module-wise count rates for Quadrant A Data is divided into 100 sec bins |
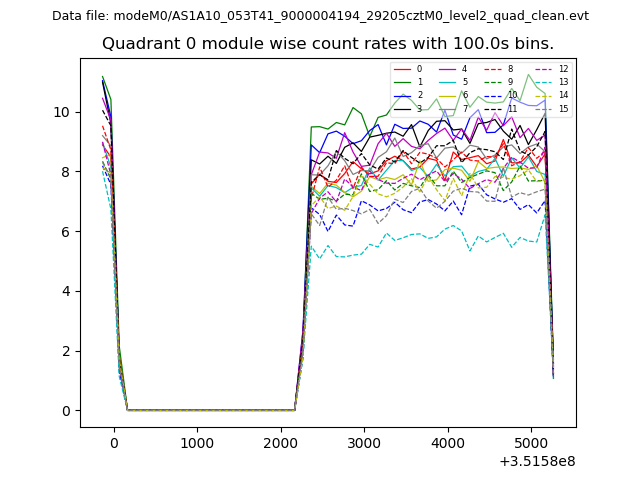 |
 |
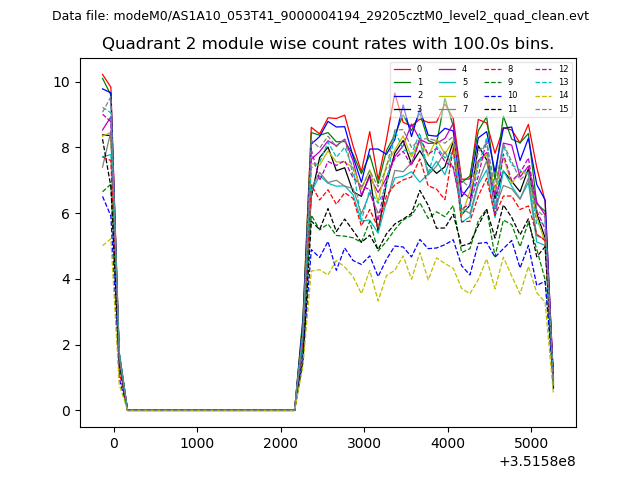
| Module-wise count rates for Quadrant B Data is divided into 100 sec bins |
 |
 |
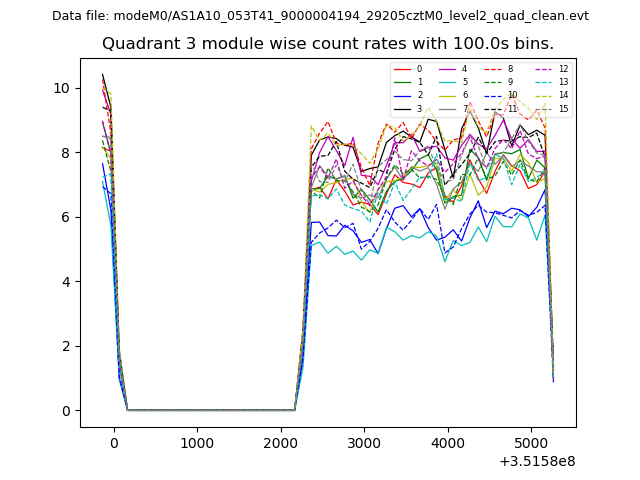
| Module-wise count rates for Quadrant C Data is divided into 100 sec bins |
 |
 |
| Module-wise count rates for Quadrant D Data is divided into 100 sec bins |
 |
 |
| Parameter | Plot |
|---|---|
| CZT HV Monitor | 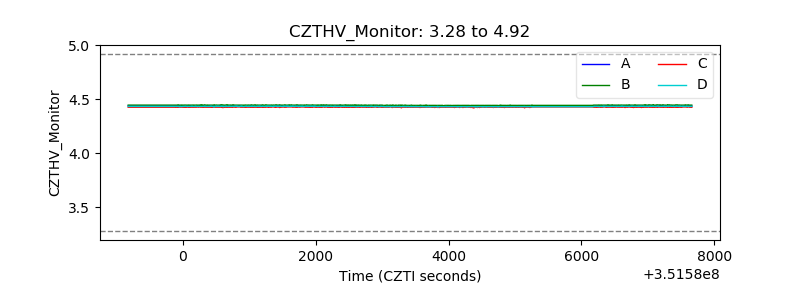 |
| D_VDD | 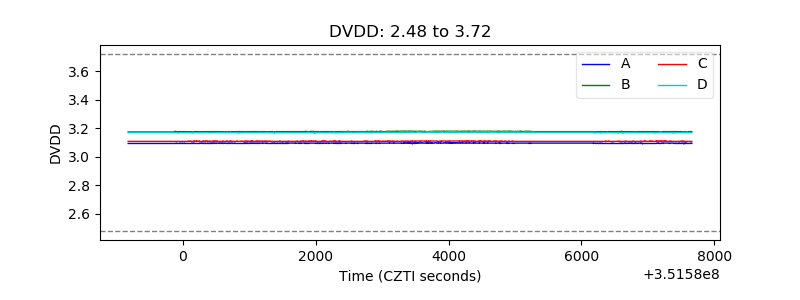 |
| Temperature 1 | 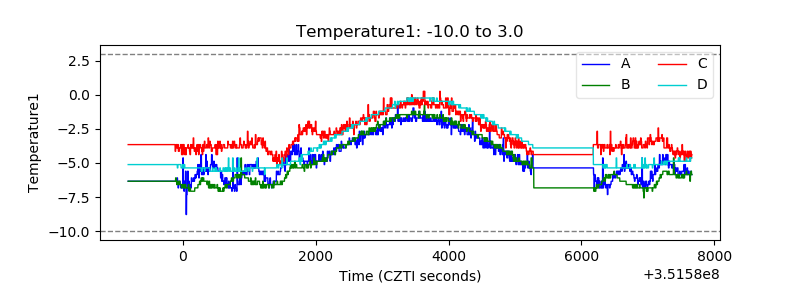 |
| Veto HV Monitor | 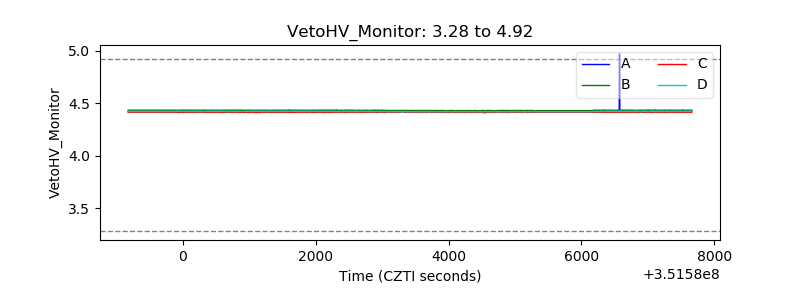 |
| Veto LLD | 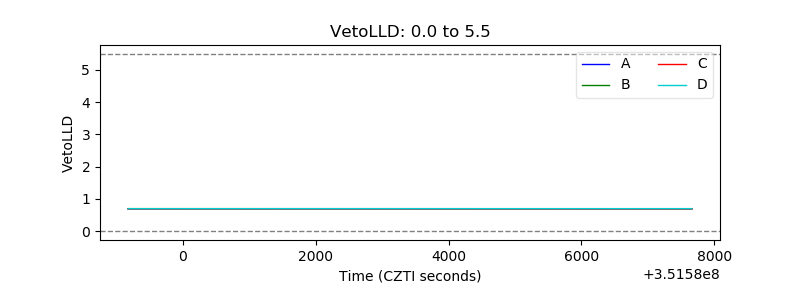 |
| Alpha Counter |  |
| _CPM_Rate |  |
| CZT Counter | 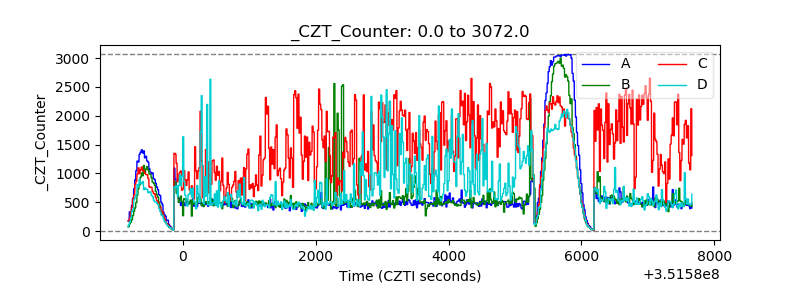 |
| +2.5 Volts monitor |  |
| +5 Volts monitor |  |
| _ROLL_ROT | 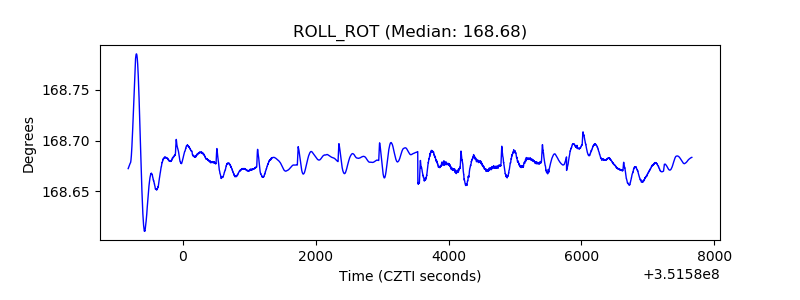 |
| _Roll_DEC | 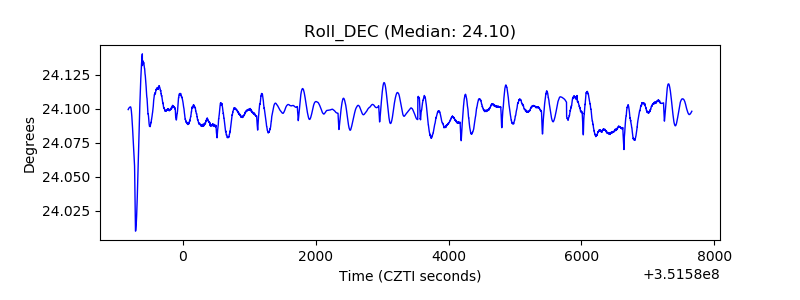 |
| _Roll_RA | 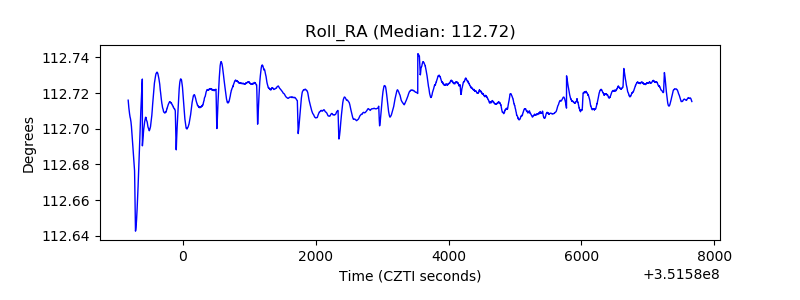 |
| Veto Counter | 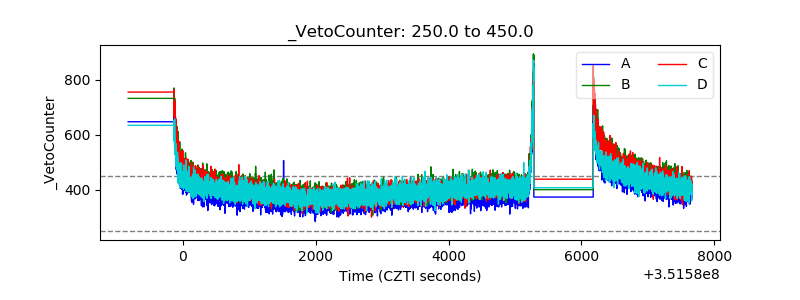 |