| Param | Original file | Final file |
|---|---|---|
| Filename | modeM0/AS1A10_053T41_9000004194_29206cztM0_level2.evt | modeM0/AS1A10_053T41_9000004194_29206cztM0_level2_quad_clean.evt |
| Size (bytes) | 456,986,880 | 40,944,960 |
| Size | 435.8 MB | 39.0 MB |
| Events in quadrant A | 1,905,579 | 256,214 |
| Events in quadrant B | 2,175,018 | 259,568 |
| Events in quadrant C | 7,099,055 | 204,237 |
| Events in quadrant D | 2,389,984 | 238,356 |
| Mode M9 | |||
|---|---|---|---|
| Quadrant | BADHDUFLAG | Total packets | Discarded packets |
| A | 0 | 8 | 0 |
| B | 0 | 9 | 0 |
| C | 0 | 9 | 0 |
| D | 0 | 9 | 0 |
| Mode SS | |||
|---|---|---|---|
| Quadrant | BADHDUFLAG | Total packets | Discarded packets |
| A | 0 | 80 | 0 |
| B | 0 | 80 | 0 |
| C | 0 | 80 | 0 |
| D | 0 | 80 | 0 |
| Mode M0 | |||
|---|---|---|---|
| Quadrant | BADHDUFLAG | Total packets | Discarded packets |
| A | 0 | 8073 | 1 |
| B | 0 | 8861 | 1 |
| C | 0 | 23850 | 1 |
| D | 0 | 9706 | 1 |
| Quadrant | Total seconds | Saturated seconds | Saturation percentage |
|---|---|---|---|
| A | 3979 | 5 | 0.125660% |
| B | 3979 | 33 | 0.829354% |
| C | 3979 | 1995 | 50.138226% |
| D | 3979 | 28 | 0.703694% |
Noise dominated data is calculated using 1-second bins in cleaned event files. If a bin has >2000 counts, and if more than 50% of those come from <1% of pixels, then it is considered to be noise-dominated and hence unusable.
| Quadrant | # 1 sec bins | Bins with >0 counts | Bins with >2000 counts | High rate bins dominated by noise | Noise dominated (total time) | Noise dominated (detector-on time) | Marked lightcurve |
|---|---|---|---|---|---|---|---|
| A | 3979 | 3979 | 0 | 0 | 0.00% | 0.00% | 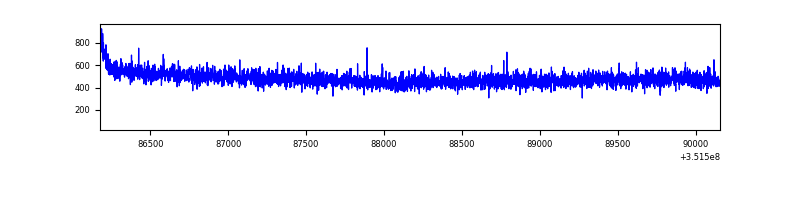 |
| B | 3979 | 3979 | 12 | 12 | 0.30% | 0.30% | 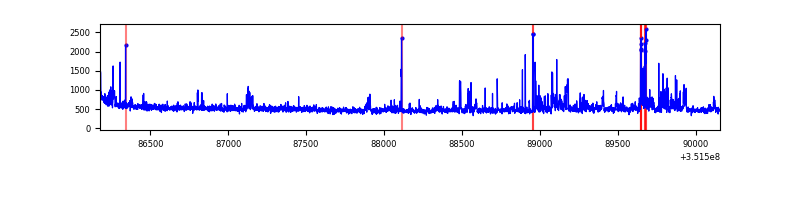 |
| C | 3979 | 3979 | 1518 | 1518 | 38.15% | 38.15% | 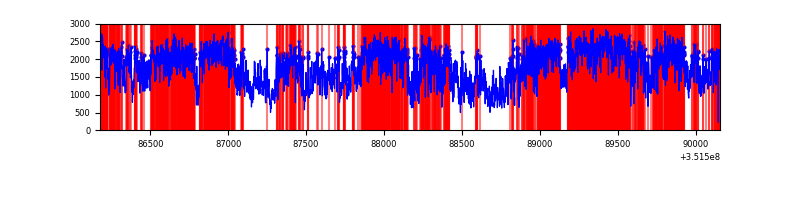 |
| D | 3979 | 3979 | 21 | 21 | 0.53% | 0.53% | 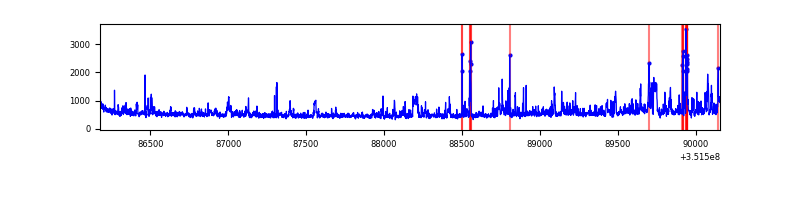 |
Top three noisy pixels from each quadrant. If the there are fewer than three noisy pixels in the level2.evt file, extra rows are filled as -1
| Pixel properties | Quadrant properties | ||||||
|---|---|---|---|---|---|---|---|
| Quadrant | DetID | PixID | Counts | Sigma | Mean | Median | Sigma |
| A | 13 | 254 | 7645 | 71.47 | 493 | 483 | 100.2 |
| A | 3 | 137 | 4772 | 42.8 | 493 | 483 | 100.2 |
| A | 0 | 226 | 3972 | 34.81 | 493 | 483 | 100.2 |
| B | 10 | 245 | 102998 | 1089.55 | 489 | 478 | 94.1 |
| B | 0 | 183 | 79125 | 835.83 | 489 | 478 | 94.1 |
| B | 0 | 229 | 44022 | 462.77 | 489 | 478 | 94.1 |
| C | 3 | 233 | 5387177 | 56488.23 | 410 | 412 | 95.4 |
| C | 14 | 238 | 69656 | 726.12 | 410 | 412 | 95.4 |
| C | 9 | 54 | 27613 | 285.24 | 410 | 412 | 95.4 |
| D | 8 | 195 | 357229 | 3145.62 | 470 | 459 | 113.4 |
| D | 1 | 52 | 150839 | 1325.89 | 470 | 459 | 113.4 |
| D | 12 | 233 | 40075 | 349.29 | 470 | 459 | 113.4 |
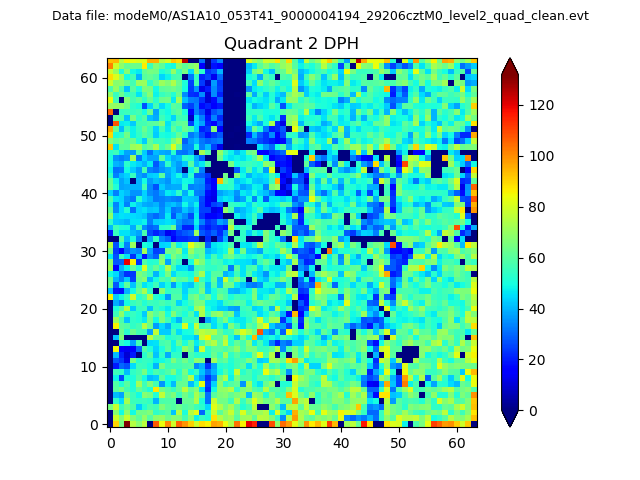
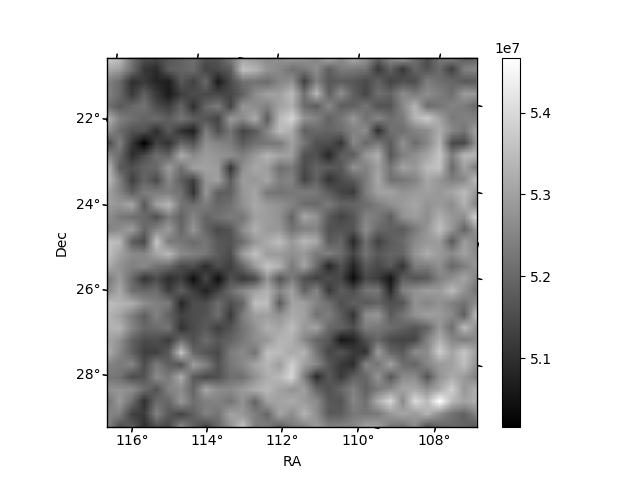
Histogram calculated using DETX and DETY for each event in the final _common_clean file
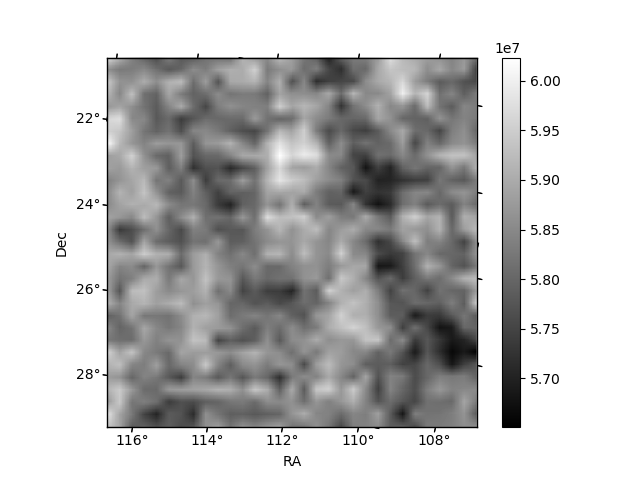
| Quadrant A | 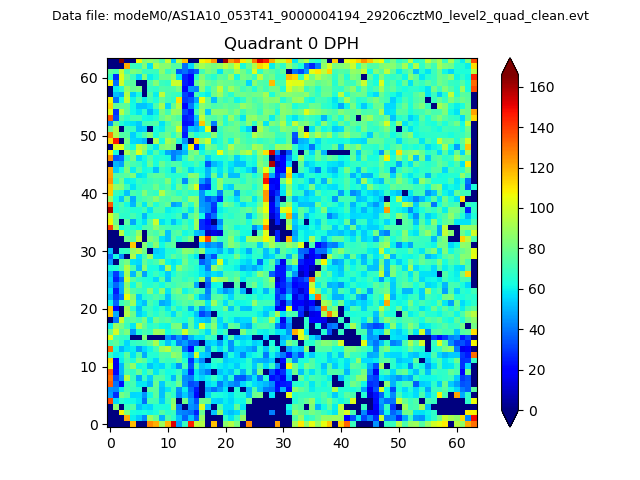 |
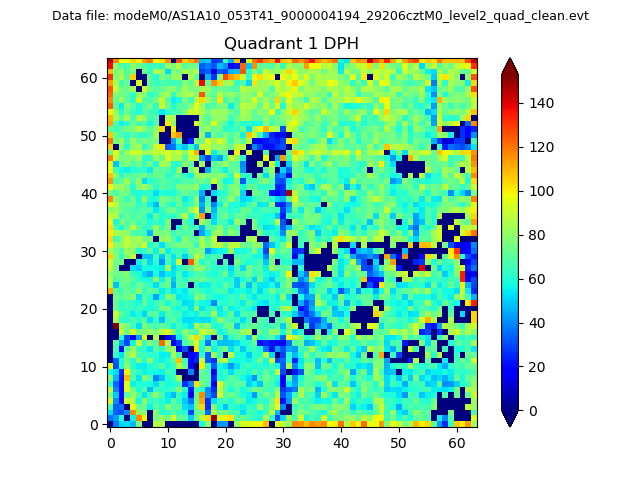 |
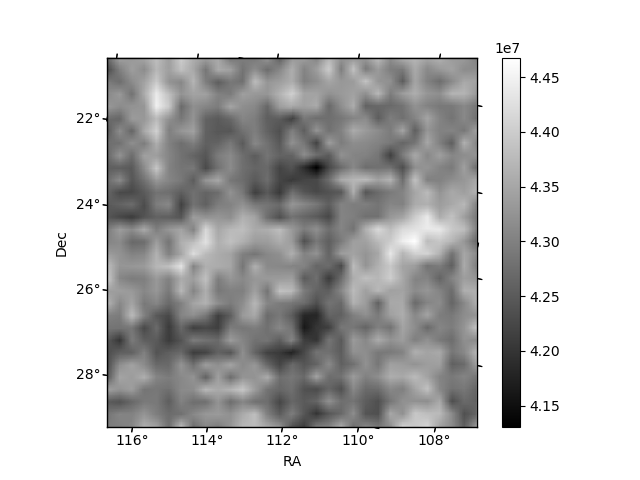
Quadrant B |
|---|---|---|---|
| Quadrant D | 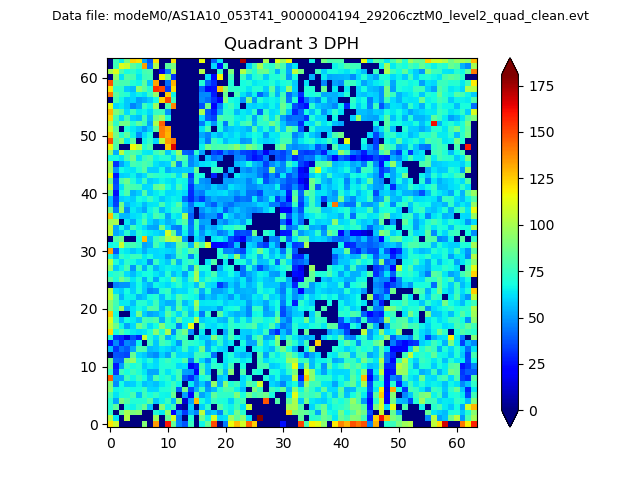 |
 |
Quadrant C |
| Plot type | Count rate plots | Images |
|---|---|---|
| Comparison with Poisson distribution Blue bars denote a histogram of data divided into 1 sec bins. Red curve is a Poisson curve with rate = median count rate of data. |
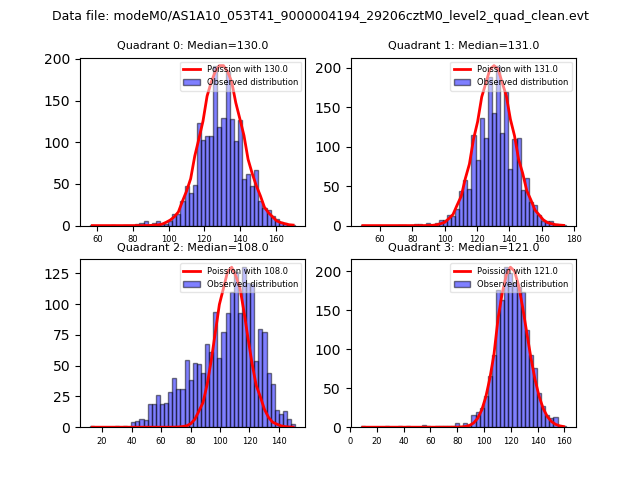 |
 |
| Quadrant-wise count rates Data is divided into 100 sec bins |
 |
|
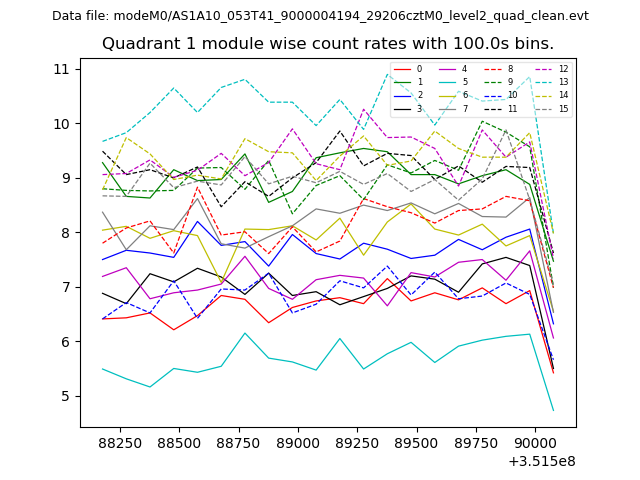
| Module-wise count rates for Quadrant A Data is divided into 100 sec bins |
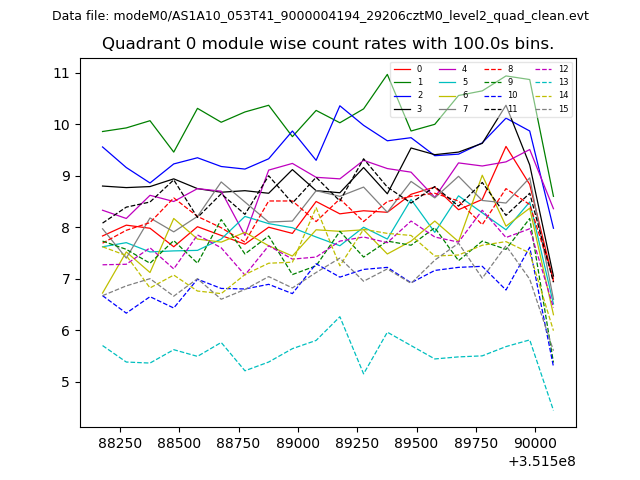 |
 |
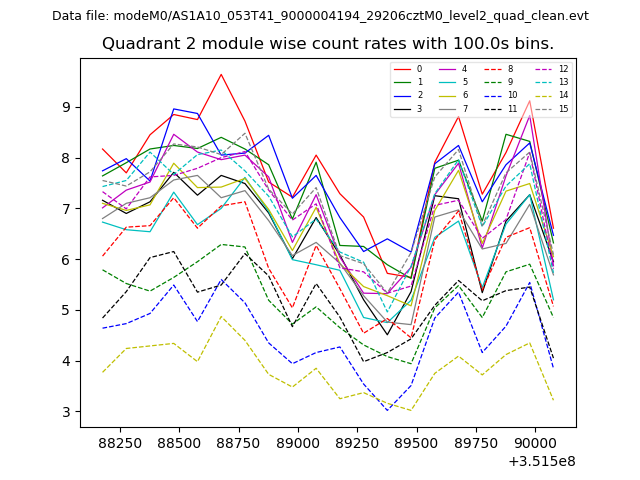
| Module-wise count rates for Quadrant B Data is divided into 100 sec bins |
 |
 |
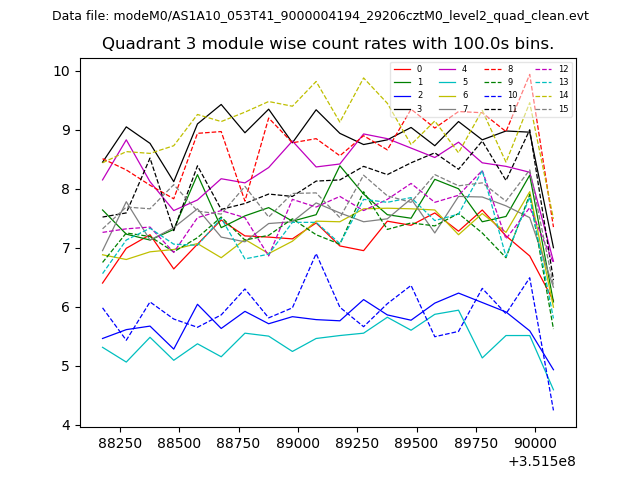
| Module-wise count rates for Quadrant C Data is divided into 100 sec bins |
 |
 |
| Module-wise count rates for Quadrant D Data is divided into 100 sec bins |
 |
 |
| Parameter | Plot |
|---|---|
| CZT HV Monitor |  |
| D_VDD | 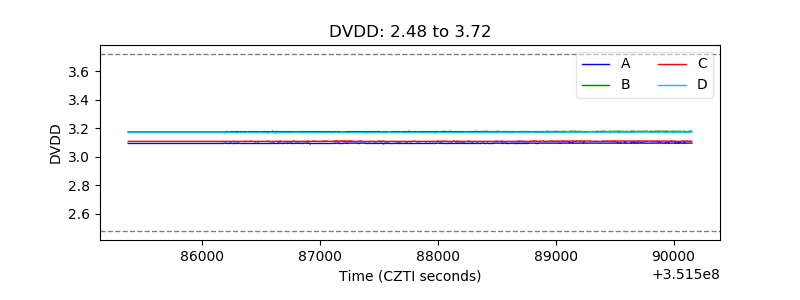 |
| Temperature 1 | 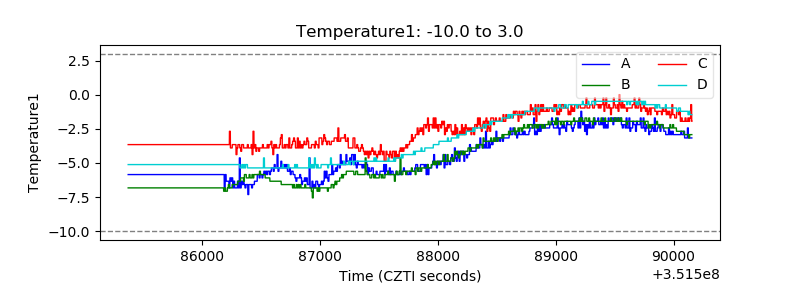 |
| Veto HV Monitor |  |
| Veto LLD | 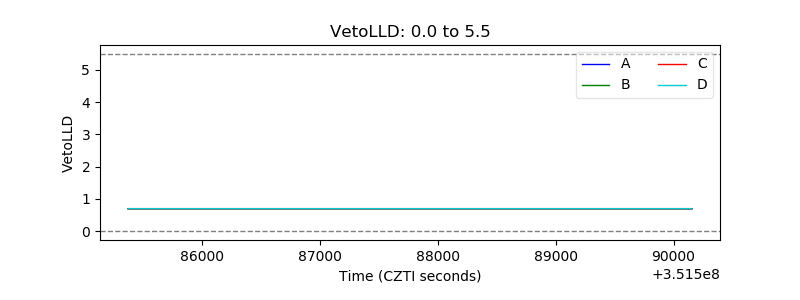 |
| Alpha Counter | 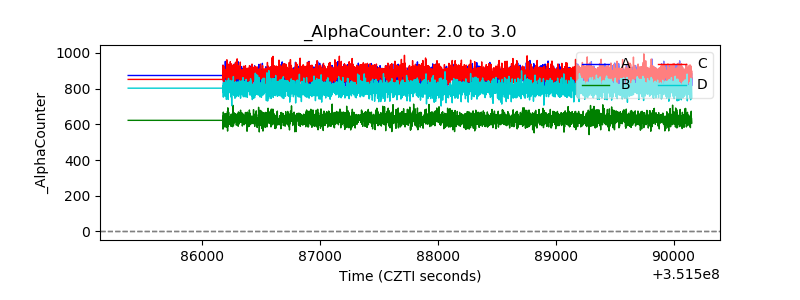 |
| _CPM_Rate | 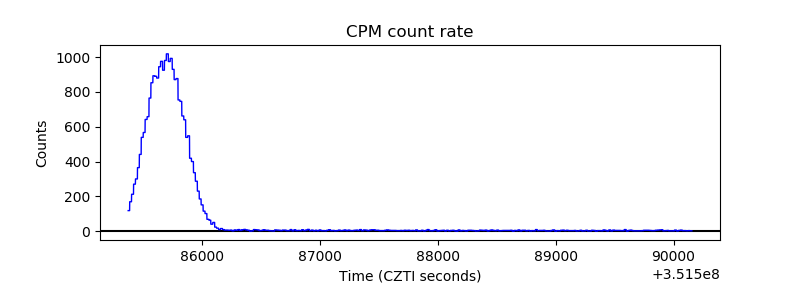 |
| CZT Counter | 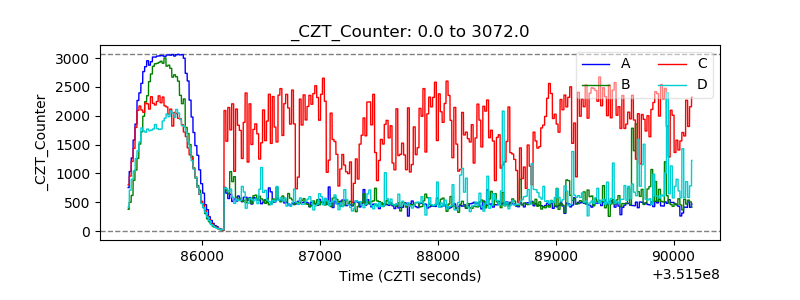 |
| +2.5 Volts monitor |  |
| +5 Volts monitor |  |
| _ROLL_ROT | 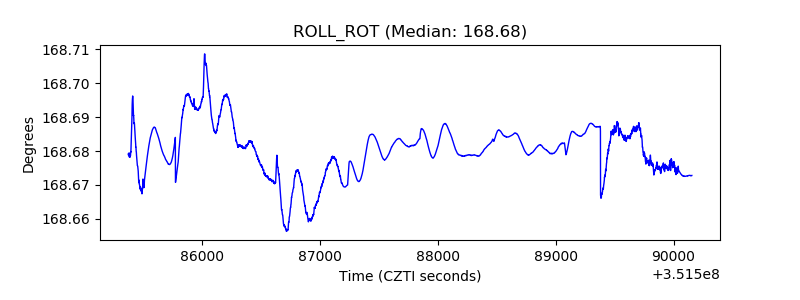 |
| _Roll_DEC | 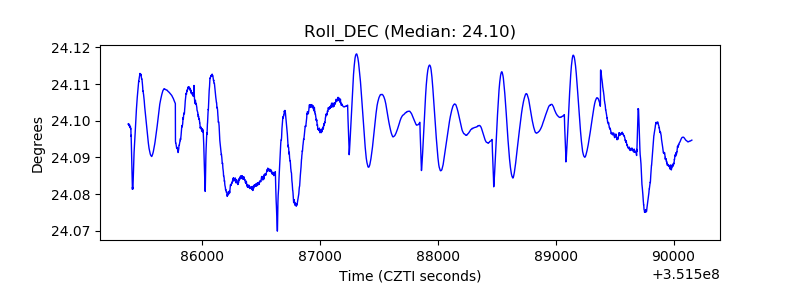 |
| _Roll_RA | 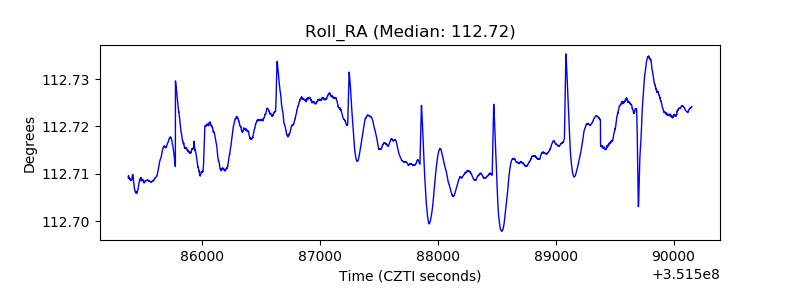 |
| Veto Counter | 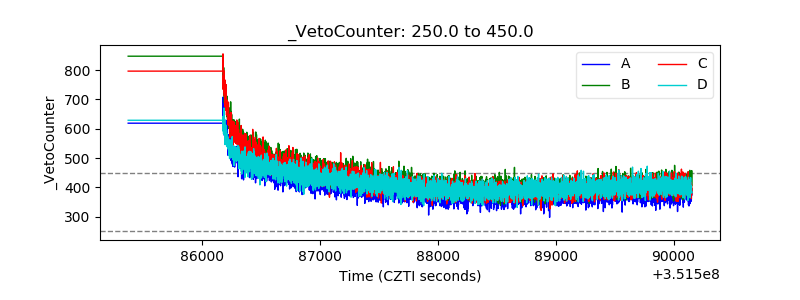 |