| Param | Original file | Final file |
|---|---|---|
| Filename | modeM0/AS1A10_053T43_9000004198cztM0_level2.fits | modeM0/AS1A10_053T43_9000004198cztM0_level2_quad_clean.evt |
| Size (bytes) | 90,829,440 | 41,218,560 |
| Size | 86.6 MB | 39.3 MB |
| Events in quadrant A | 604,146 | 187,284 |
| Events in quadrant B | 564,758 | 187,396 |
| Events in quadrant C | 556,062 | 169,936 |
| Events in quadrant D | 473,832 | 150,460 |
| Mode M9 | |||
|---|---|---|---|
| Quadrant | BADHDUFLAG | Total packets | Discarded packets |
| A | 0 | 12 | 0 |
| B | 0 | 12 | 0 |
| C | 0 | 12 | 0 |
| D | 0 | 12 | 0 |
| Mode SS | |||
|---|---|---|---|
| Quadrant | BADHDUFLAG | Total packets | Discarded packets |
| A | 0 | 162 | 0 |
| B | 0 | 162 | 0 |
| C | 0 | 162 | 0 |
| D | 0 | 162 | 0 |
| Mode M0 | |||
|---|---|---|---|
| Quadrant | BADHDUFLAG | Total packets | Discarded packets |
| A | 0 | 17646 | 0 |
| B | 0 | 20073 | 0 |
| C | 0 | 27395 | 0 |
| D | 0 | 33529 | 0 |
| Quadrant | Total seconds | Saturated seconds | Saturation percentage |
|---|---|---|---|
| A | 7934 | 91 | 1.146962% |
| B | 7934 | 194 | 2.445173% |
| C | 7934 | 459 | 5.785228% |
| D | 7934 | 1139 | 14.355936% |
Noise dominated data is calculated using 1-second bins in cleaned event files. If a bin has >2000 counts, and if more than 50% of those come from <1% of pixels, then it is considered to be noise-dominated and hence unusable.
| Quadrant | # 1 sec bins | Bins with >0 counts | Bins with >2000 counts | High rate bins dominated by noise | Noise dominated (total time) | Noise dominated (detector-on time) | Marked lightcurve |
|---|---|---|---|---|---|---|---|
| A | 9159 | 7934 | 0 | 0 | 0.00% | 0.00% | 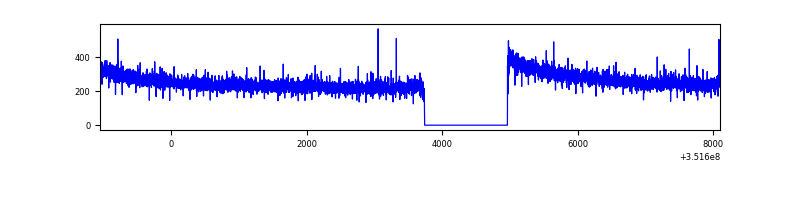 |
| B | 9159 | 7934 | 0 | 0 | 0.00% | 0.00% | 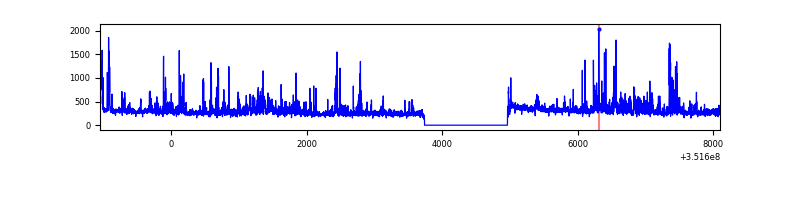 |
| C | 9159 | 7934 | 0 | 0 | 0.00% | 0.00% | 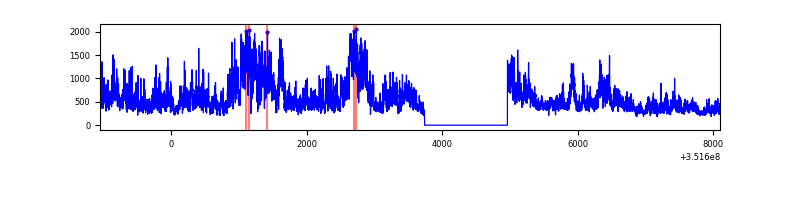 |
| D | 9158 | 7924 | 0 | 0 | 0.00% | 0.00% | 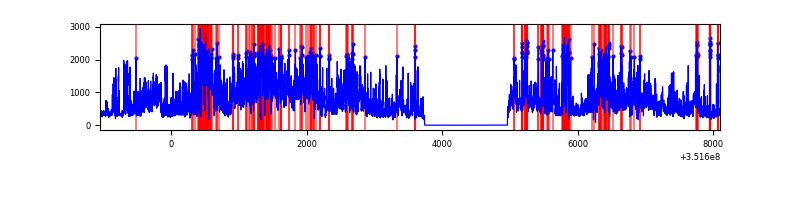 |
Top three noisy pixels from each quadrant. If the there are fewer than three noisy pixels in the level2.evt file, extra rows are filled as -1
| Pixel properties | Quadrant properties | ||||||
|---|---|---|---|---|---|---|---|
| Quadrant | DetID | PixID | Counts | Sigma | Mean | Median | Sigma |
| A | 0 | 29 | 527 | 9.64 | 157 | 150 | 39.1 |
| A | 7 | 110 | 493 | 8.77 | 157 | 150 | 39.1 |
| A | 0 | 30 | 471 | 8.21 | 157 | 150 | 39.1 |
| B | 2 | 9 | 466 | 10.38 | 149 | 144 | 31.0 |
| B | 3 | 80 | 376 | 7.48 | 149 | 144 | 31.0 |
| B | 5 | 128 | 375 | 7.44 | 149 | 144 | 31.0 |
| C | 3 | 202 | 411 | 6.91 | 147 | 140 | 39.2 |
| C | 3 | 187 | 396 | 6.53 | 147 | 140 | 39.2 |
| C | 3 | 203 | 387 | 6.3 | 147 | 140 | 39.2 |
| D | 10 | 189 | 354 | 6.19 | 135 | 125 | 37.0 |
| D | 6 | 231 | 344 | 5.92 | 135 | 125 | 37.0 |
| D | 7 | 3 | 338 | 5.76 | 135 | 125 | 37.0 |
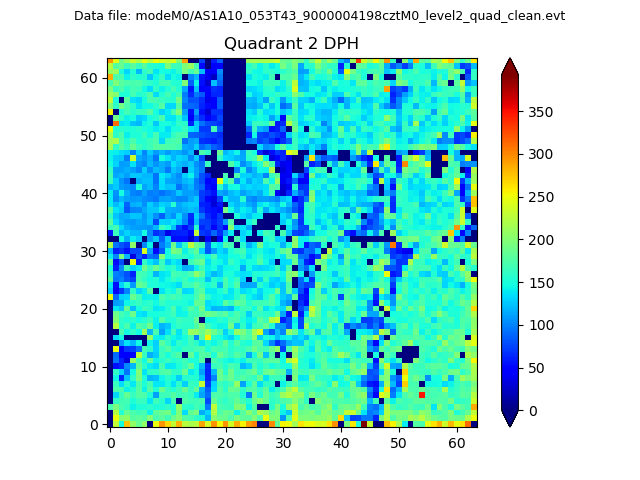
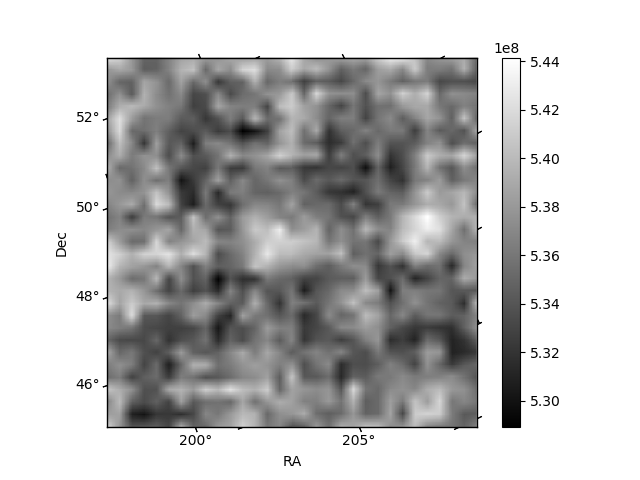
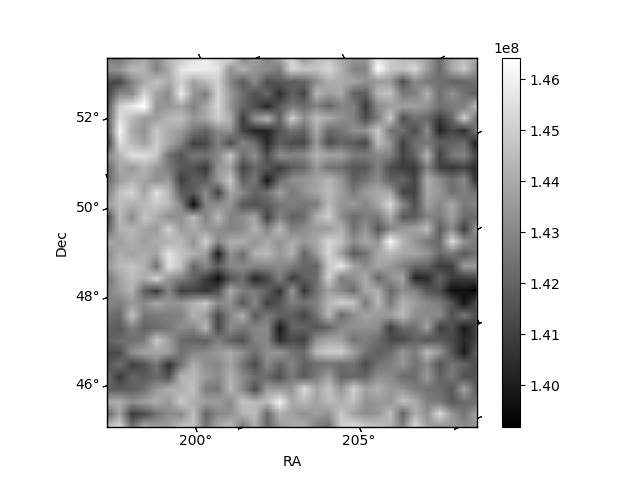
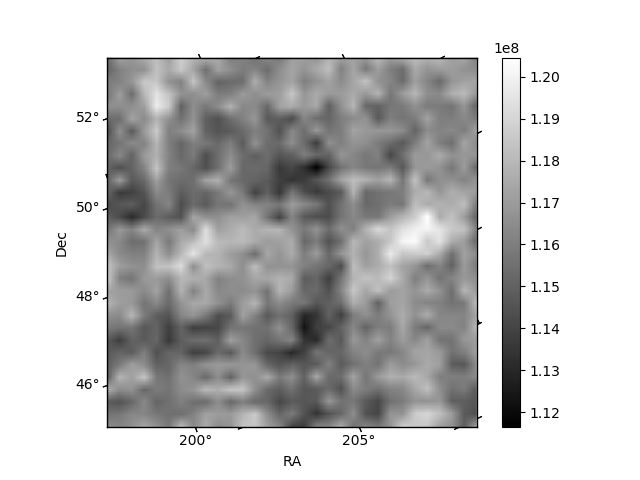
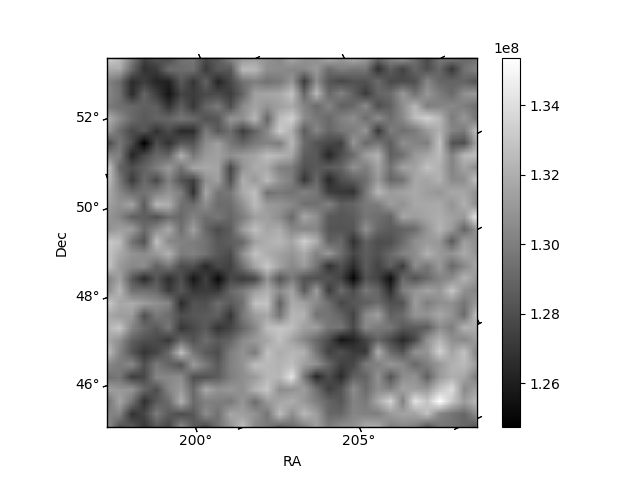
Histogram calculated using DETX and DETY for each event in the final _common_clean file
| Quadrant A | 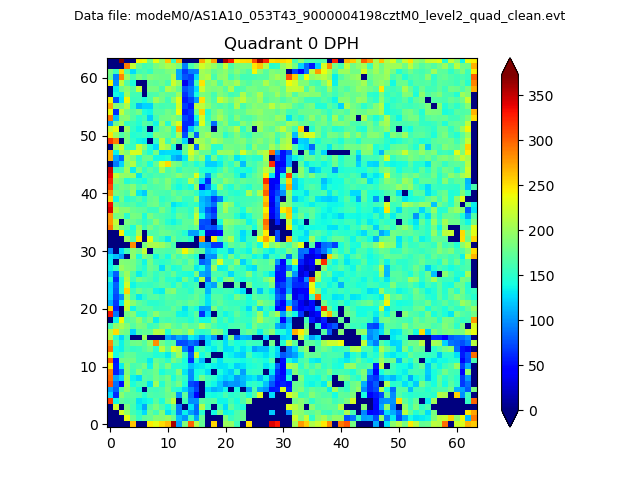 |
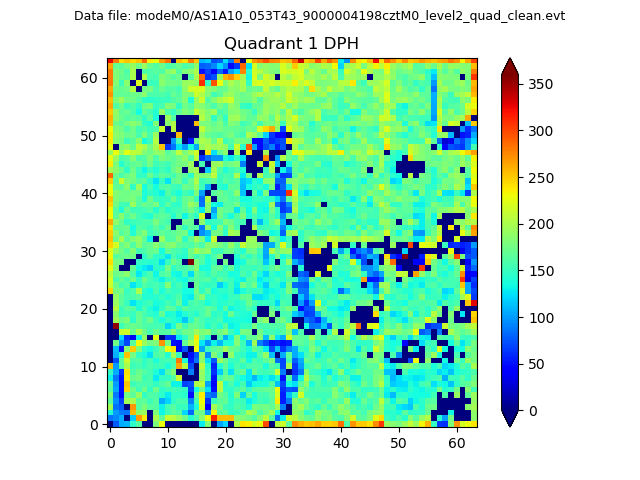 |
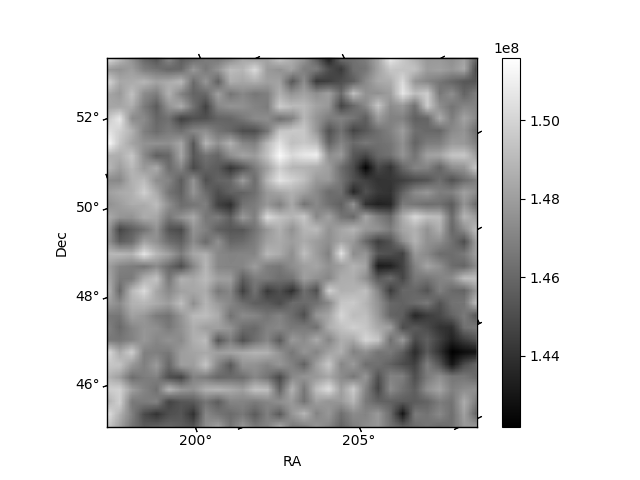
Quadrant B |
|---|---|---|---|
| Quadrant D | 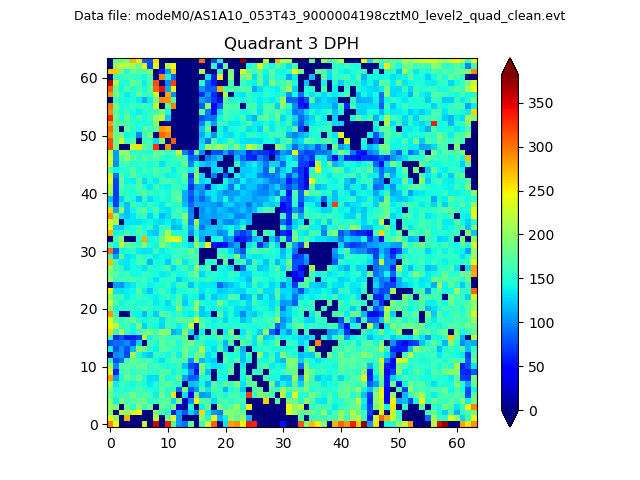 |
 |
Quadrant C |
| Plot type | Count rate plots | Images |
|---|---|---|
| Comparison with Poisson distribution Blue bars denote a histogram of data divided into 1 sec bins. Red curve is a Poisson curve with rate = median count rate of data. |
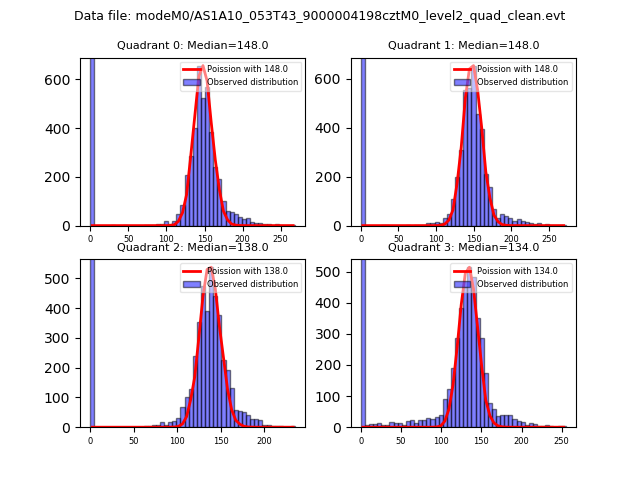 |
 |
| Quadrant-wise count rates Data is divided into 100 sec bins |
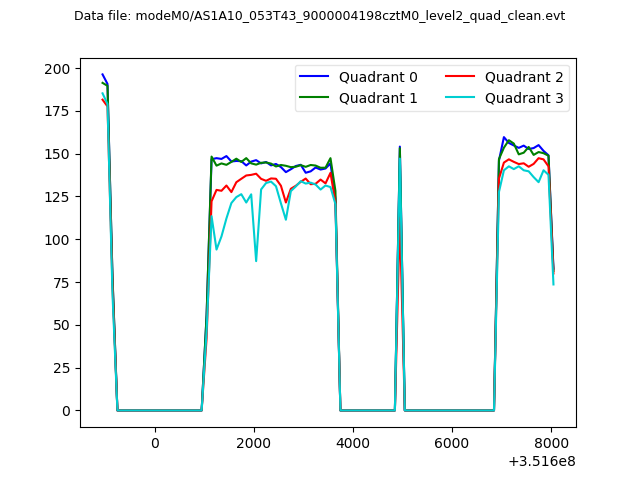 |
|
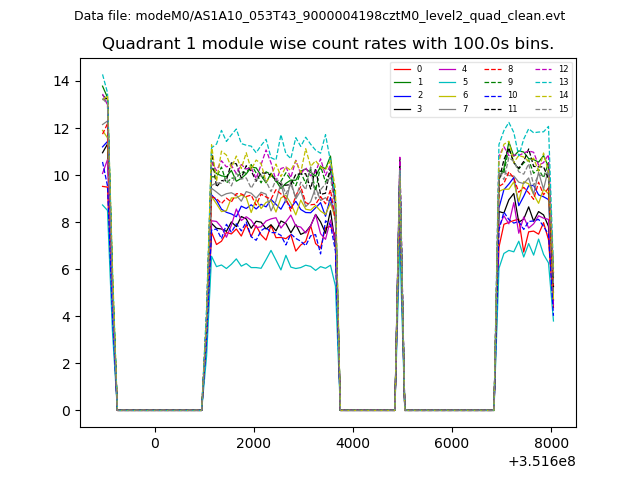
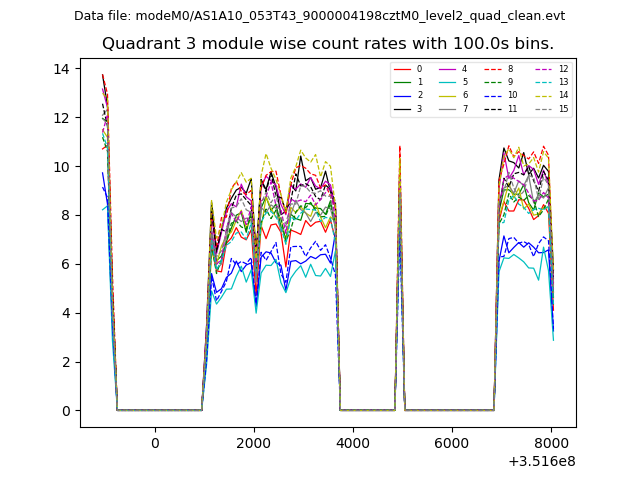
| Module-wise count rates for Quadrant A Data is divided into 100 sec bins |
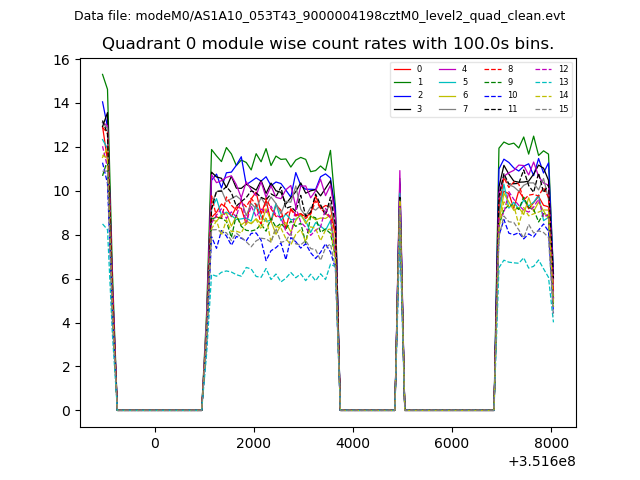 |
 |
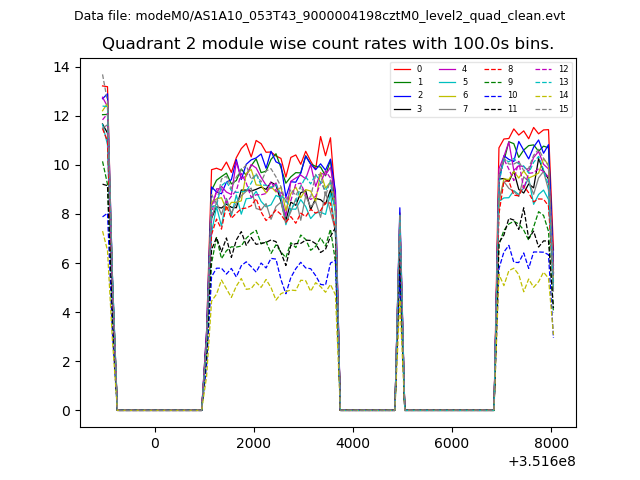
| Module-wise count rates for Quadrant B Data is divided into 100 sec bins |
 |
 |
| Module-wise count rates for Quadrant C Data is divided into 100 sec bins |
 |
 |
| Module-wise count rates for Quadrant D Data is divided into 100 sec bins |
 |
 |
| Parameter | Plot |
|---|---|
| CZT HV Monitor | 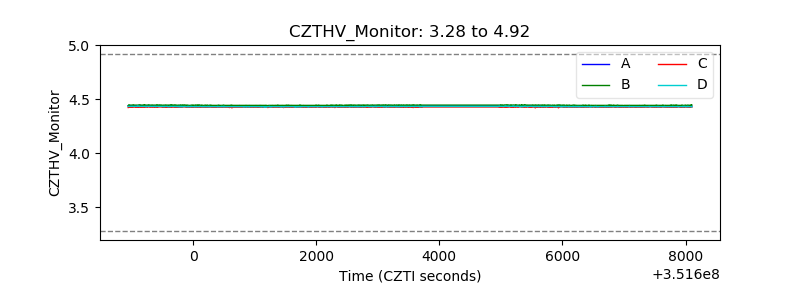 |
| D_VDD | 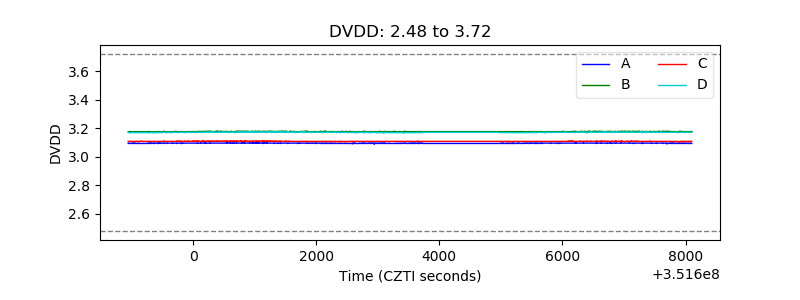 |
| Temperature 1 | 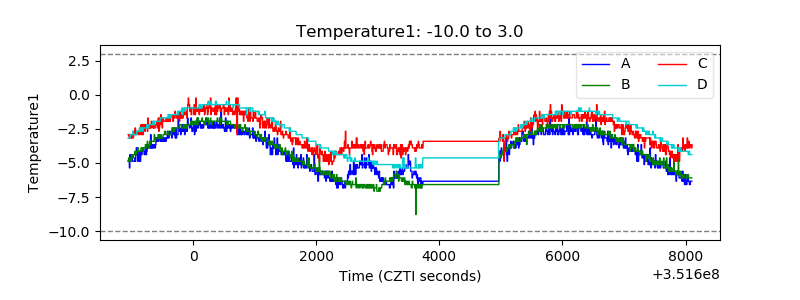 |
| Veto HV Monitor | 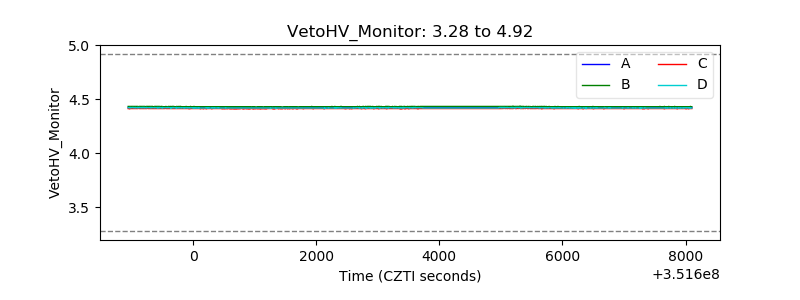 |
| Veto LLD | 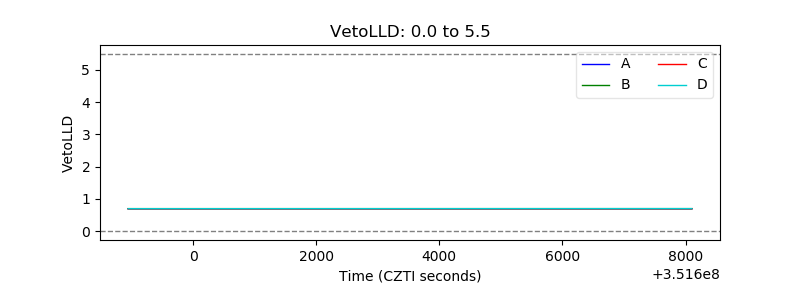 |
| Alpha Counter | 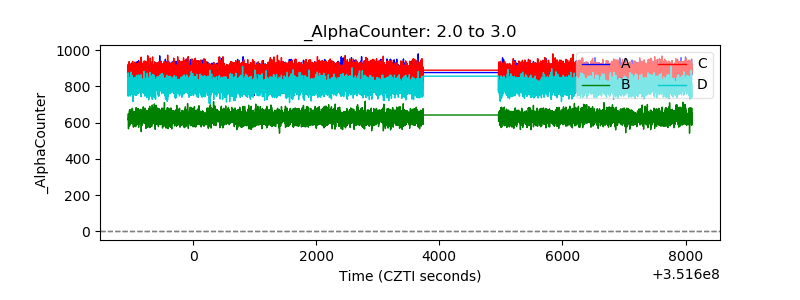 |
| _CPM_Rate | 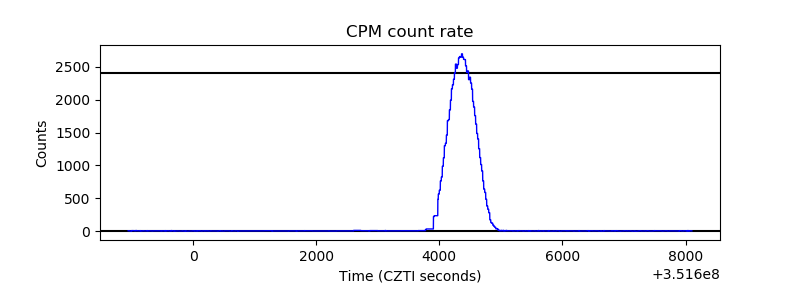 |
| CZT Counter | 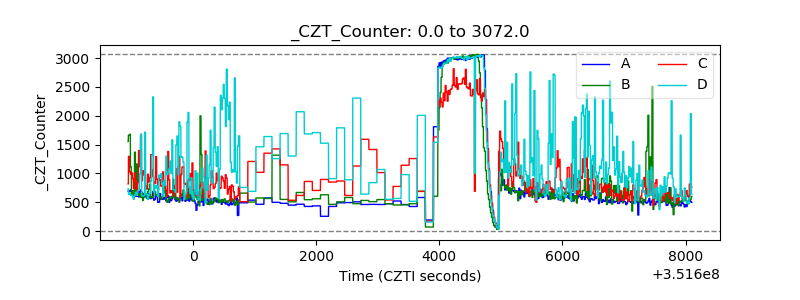 |
| +2.5 Volts monitor | 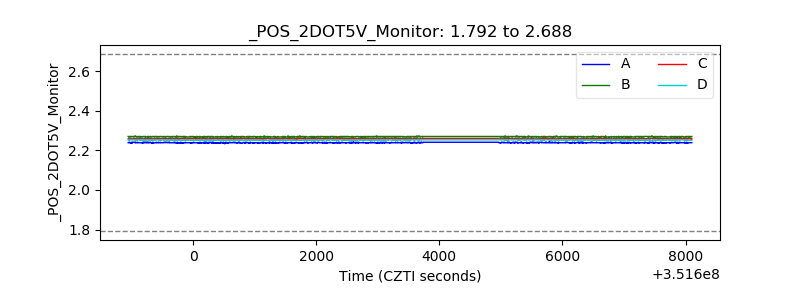 |
| +5 Volts monitor | 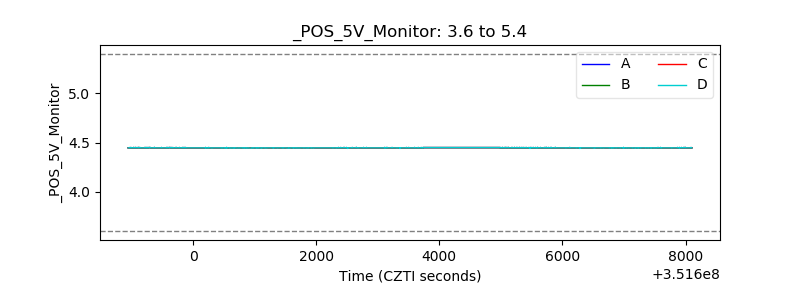 |
| _ROLL_ROT | 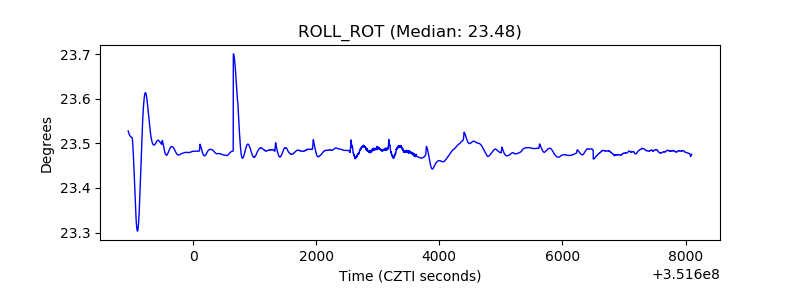 |
| _Roll_DEC | 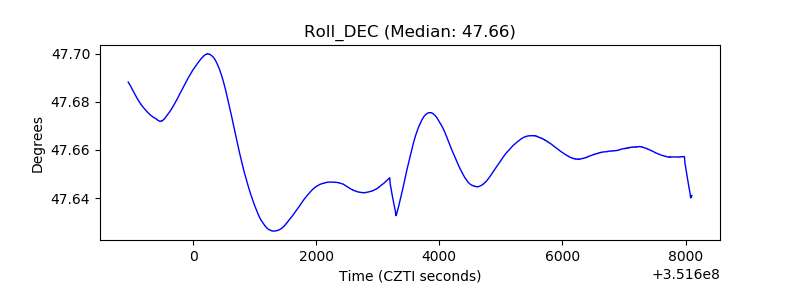 |
| _Roll_RA | 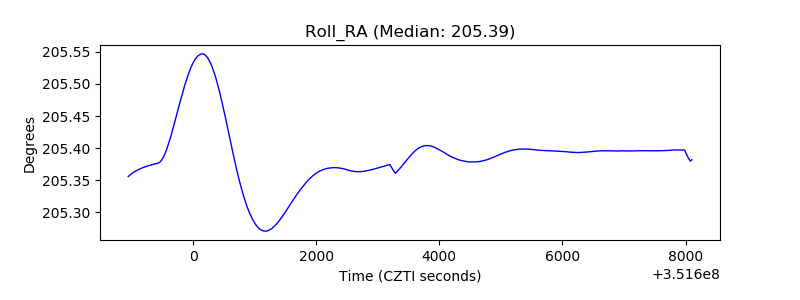 |
| Veto Counter | 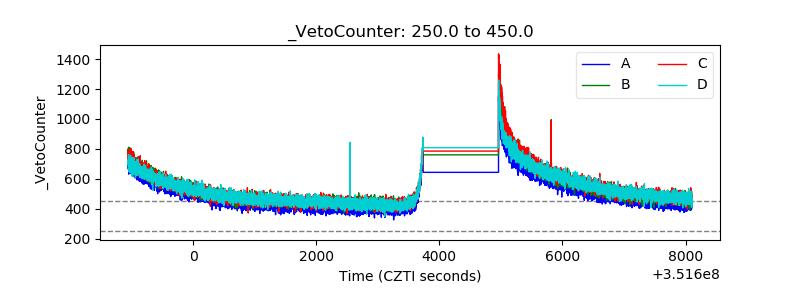 |