| Param | Original file | Final file |
|---|---|---|
| Filename | modeM0/AS1A10_053T43_9000004198_29208cztM0_level2.evt | modeM0/AS1A10_053T43_9000004198_29208cztM0_level2_quad_clean.evt |
| Size (bytes) | 127,707,840 | 9,040,320 |
| Size | 121.8 MB | 8.6 MB |
| Events in quadrant A | 720,726 | 46,827 |
| Events in quadrant B | 844,070 | 46,369 |
| Events in quadrant C | 1,069,657 | 43,492 |
| Events in quadrant D | 1,147,565 | 43,985 |
| Mode SS | |||
|---|---|---|---|
| Quadrant | BADHDUFLAG | Total packets | Discarded packets |
| A | 0 | 24 | 0 |
| B | 0 | 24 | 0 |
| C | 0 | 24 | 0 |
| D | 0 | 24 | 0 |
| Mode M0 | |||
|---|---|---|---|
| Quadrant | BADHDUFLAG | Total packets | Discarded packets |
| A | 0 | 2961 | 0 |
| B | 0 | 3364 | 0 |
| C | 0 | 4086 | 1 |
| D | 0 | 4330 | 0 |
| Quadrant | Total seconds | Saturated seconds | Saturation percentage |
|---|---|---|---|
| A | 1226 | 1 | 0.081566% |
| B | 1226 | 36 | 2.936378% |
| C | 1225 | 35 | 2.857143% |
| D | 1225 | 47 | 3.836735% |
Noise dominated data is calculated using 1-second bins in cleaned event files. If a bin has >2000 counts, and if more than 50% of those come from <1% of pixels, then it is considered to be noise-dominated and hence unusable.
| Quadrant | # 1 sec bins | Bins with >0 counts | Bins with >2000 counts | High rate bins dominated by noise | Noise dominated (total time) | Noise dominated (detector-on time) | Marked lightcurve |
|---|---|---|---|---|---|---|---|
| A | 1226 | 1226 | 0 | 0 | 0.00% | 0.00% | 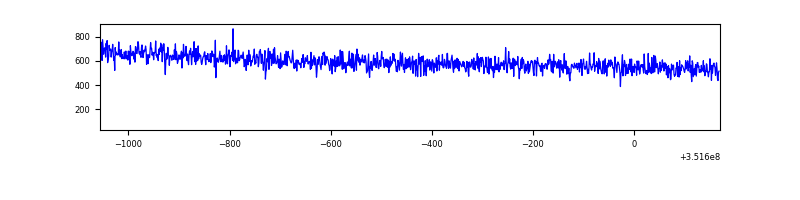 |
| B | 1226 | 1226 | 11 | 11 | 0.90% | 0.90% | 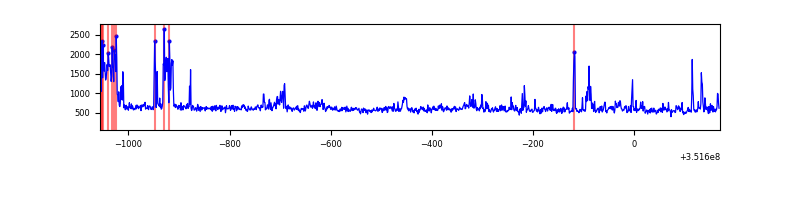 |
| C | 1225 | 1225 | 0 | 0 | 0.00% | 0.00% | 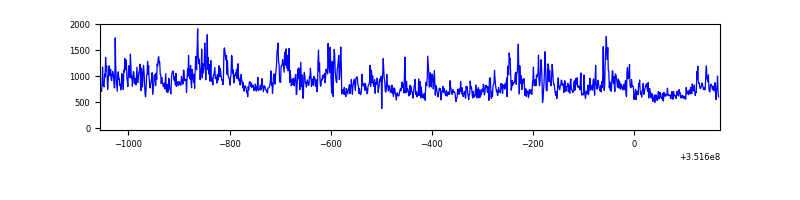 |
| D | 1225 | 1225 | 44 | 44 | 3.59% | 3.59% | 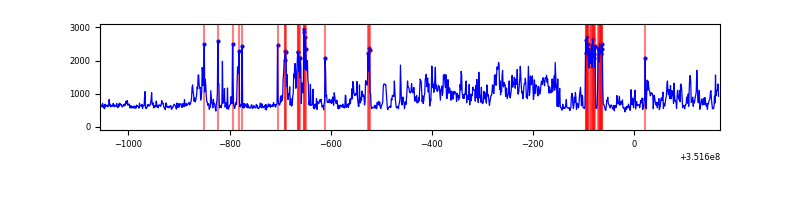 |
Top three noisy pixels from each quadrant. If the there are fewer than three noisy pixels in the level2.evt file, extra rows are filled as -1
| Pixel properties | Quadrant properties | ||||||
|---|---|---|---|---|---|---|---|
| Quadrant | DetID | PixID | Counts | Sigma | Mean | Median | Sigma |
| A | 13 | 254 | 2414 | 57.73 | 186 | 183 | 38.6 |
| A | 0 | 13 | 1742 | 40.34 | 186 | 183 | 38.6 |
| A | 3 | 137 | 1649 | 37.93 | 186 | 183 | 38.6 |
| B | 10 | 245 | 90801 | 2581.53 | 179 | 176 | 35.1 |
| B | 0 | 229 | 22001 | 621.7 | 179 | 176 | 35.1 |
| B | 0 | 190 | 14842 | 417.77 | 179 | 176 | 35.1 |
| C | 3 | 233 | 381197 | 9445.42 | 168 | 170 | 40.3 |
| C | 14 | 238 | 28020 | 690.38 | 168 | 170 | 40.3 |
| C | 2 | 114 | 2778 | 64.65 | 168 | 170 | 40.3 |
| D | 1 | 52 | 246354 | 5910.42 | 173 | 169 | 41.7 |
| D | 8 | 195 | 216815 | 5201.25 | 173 | 169 | 41.7 |
| D | 7 | 80 | 12271 | 290.55 | 173 | 169 | 41.7 |
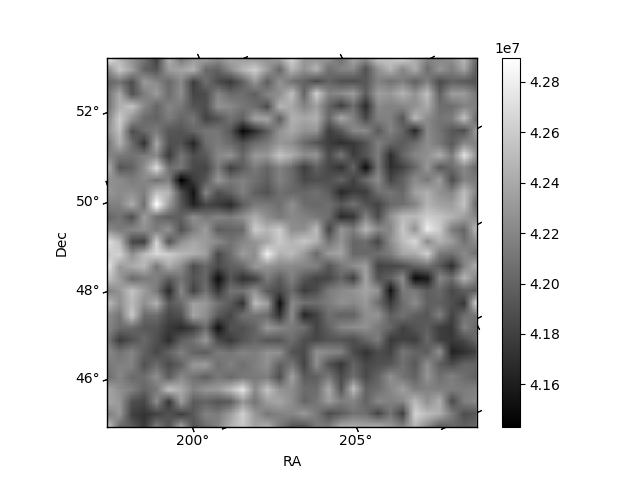
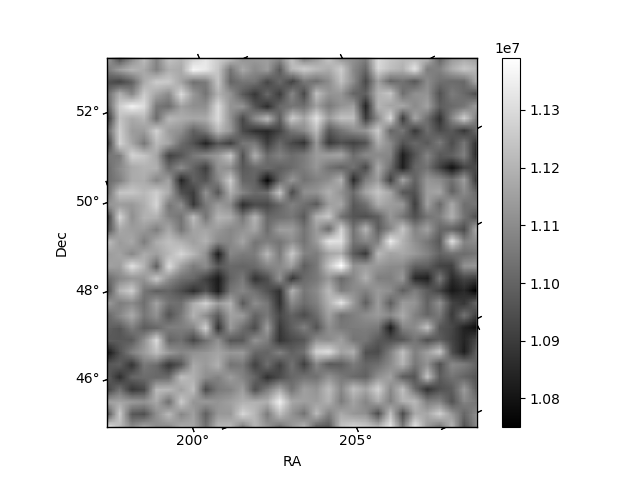
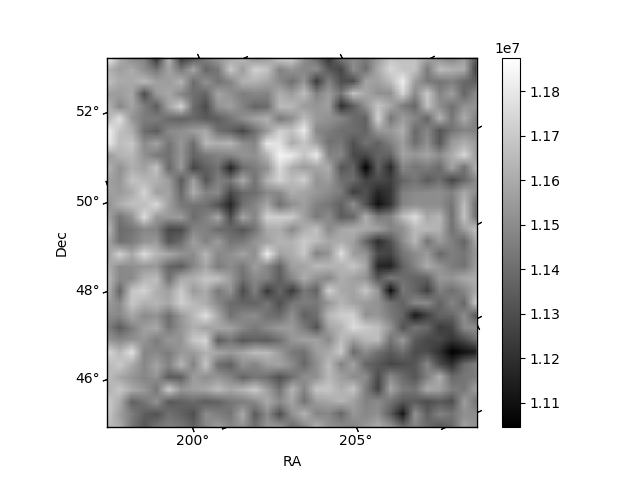
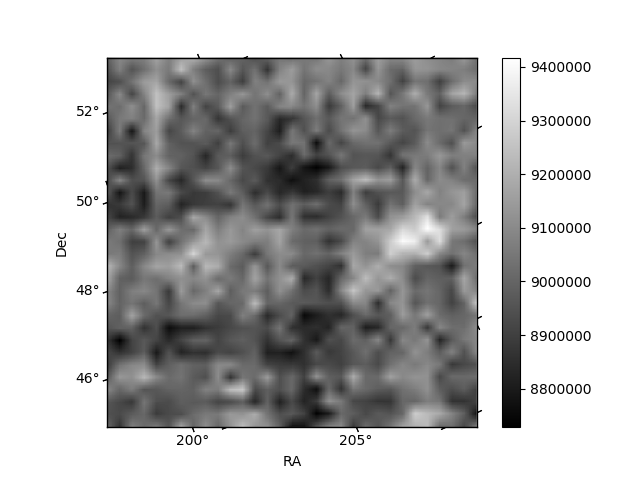
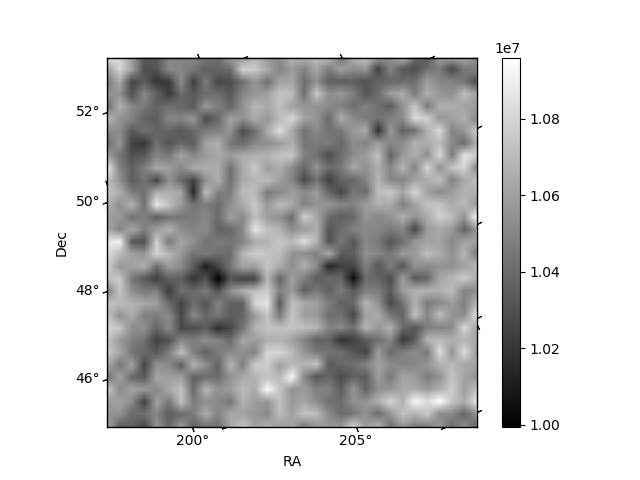
Histogram calculated using DETX and DETY for each event in the final _common_clean file
| Quadrant A | 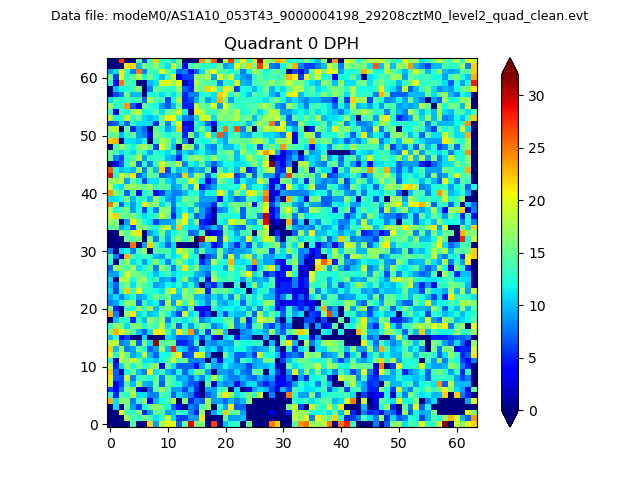 |
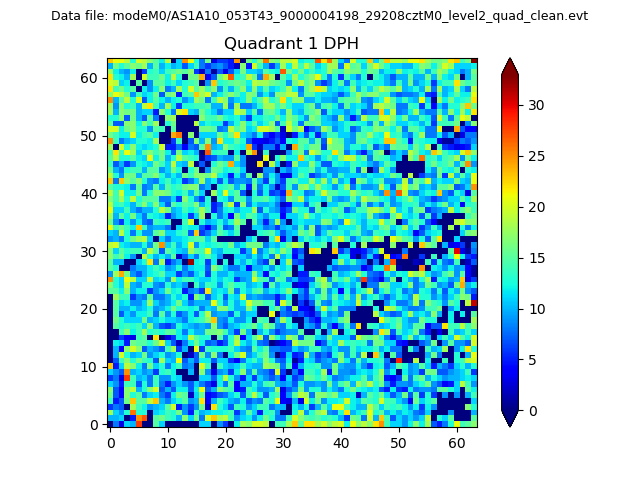 |
Quadrant B |
|---|---|---|---|
| Quadrant D | 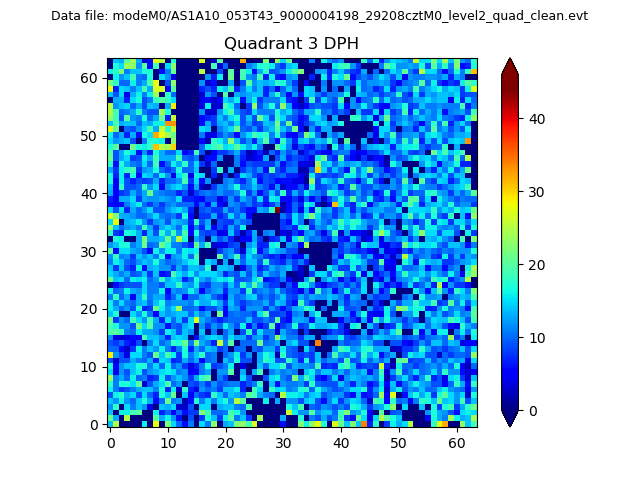 |
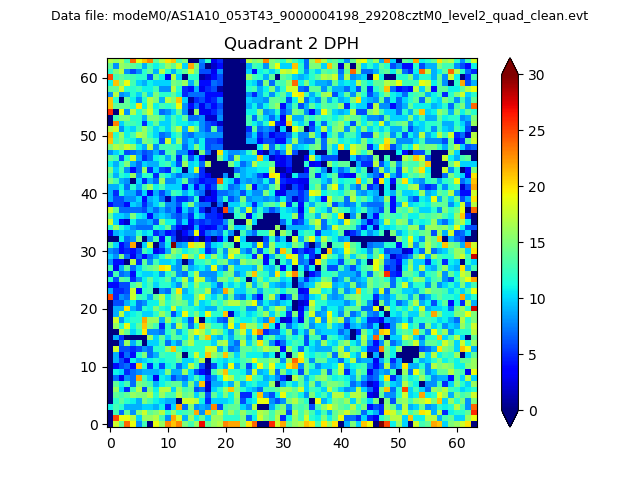 |
Quadrant C |
| Plot type | Count rate plots | Images |
|---|---|---|
| Comparison with Poisson distribution Blue bars denote a histogram of data divided into 1 sec bins. Red curve is a Poisson curve with rate = median count rate of data. |
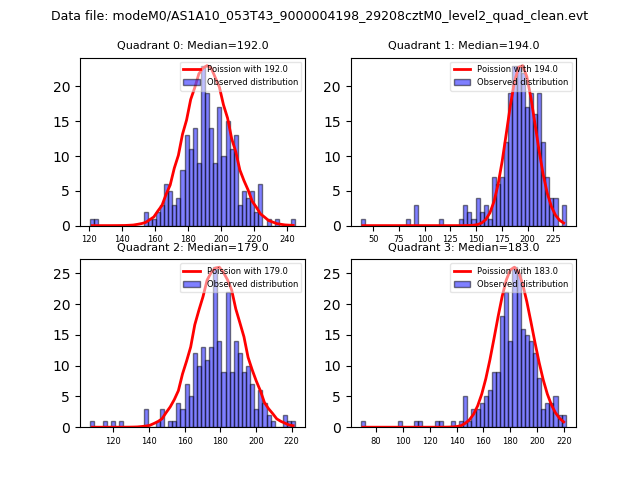 |
 |
| Quadrant-wise count rates Data is divided into 100 sec bins |
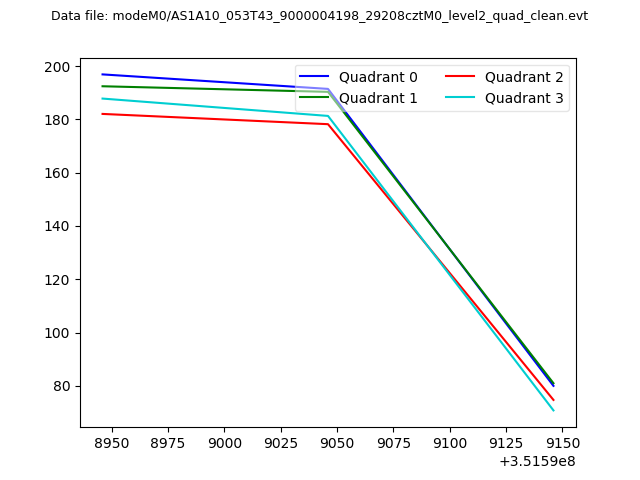 |
|
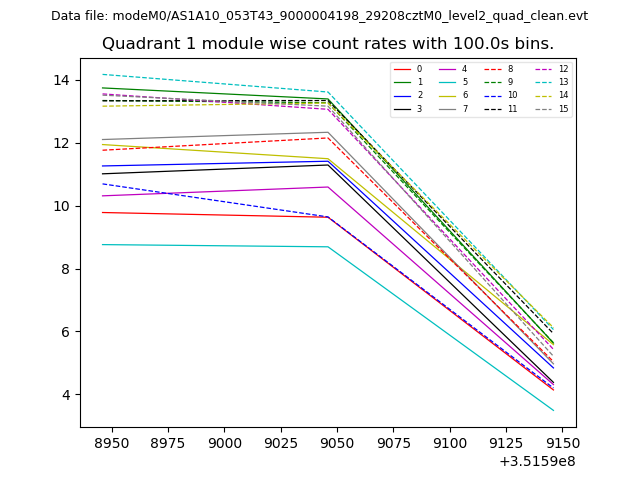
| Module-wise count rates for Quadrant A Data is divided into 100 sec bins |
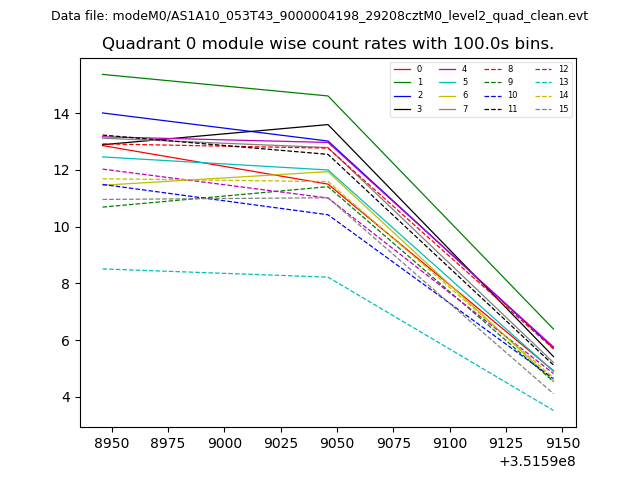 |
 |
| Module-wise count rates for Quadrant B Data is divided into 100 sec bins |
 |
 |
| Module-wise count rates for Quadrant C Data is divided into 100 sec bins |
 |
 |
| Module-wise count rates for Quadrant D Data is divided into 100 sec bins |
 |
 |
| Parameter | Plot |
|---|---|
| CZT HV Monitor |  |
| D_VDD | 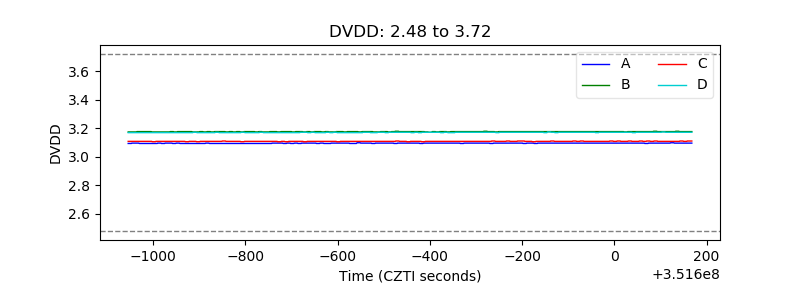 |
| Temperature 1 | 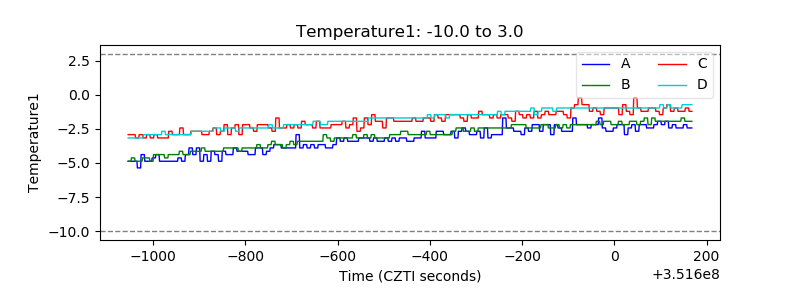 |
| Veto HV Monitor | 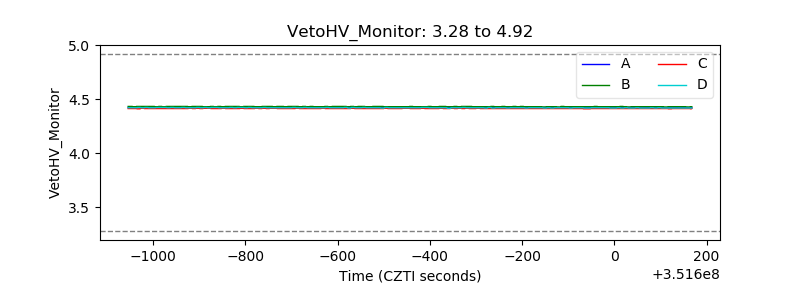 |
| Veto LLD | 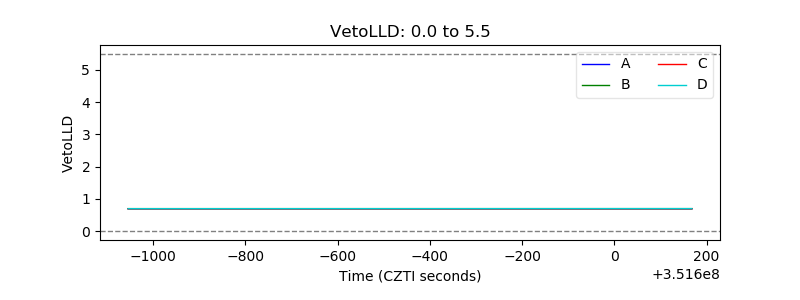 |
| Alpha Counter | 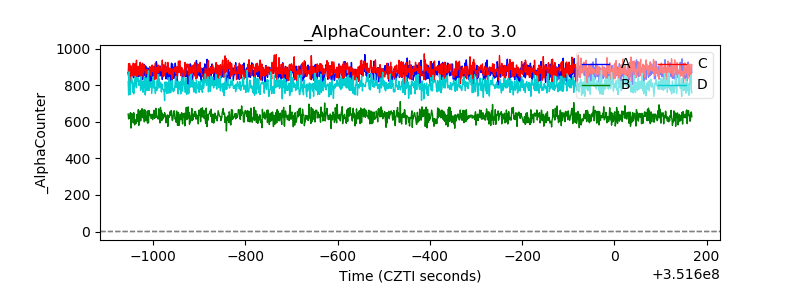 |
| _CPM_Rate | 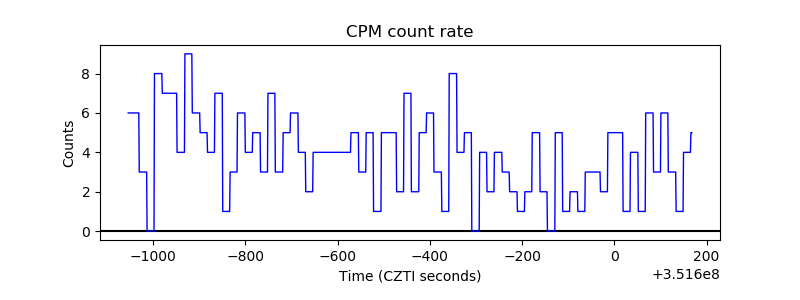 |
| CZT Counter | 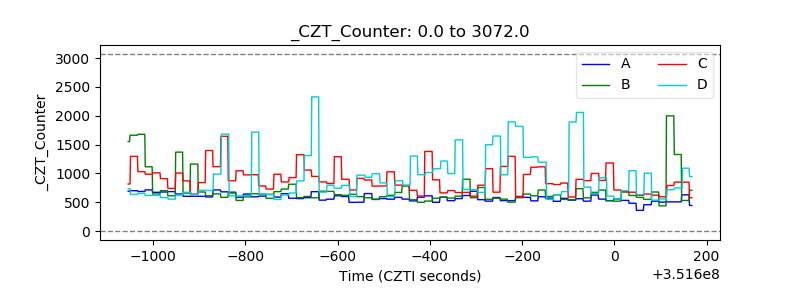 |
| +2.5 Volts monitor |  |
| +5 Volts monitor |  |
| _ROLL_ROT | 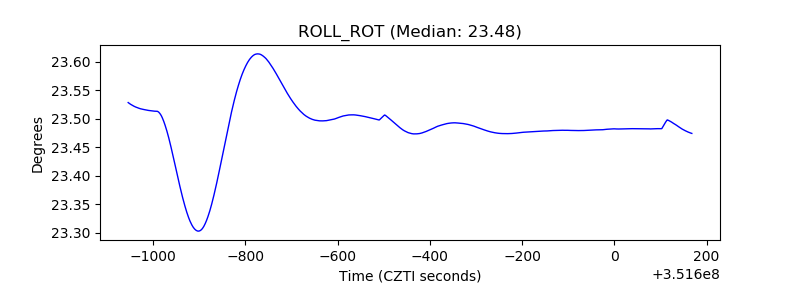 |
| _Roll_DEC | 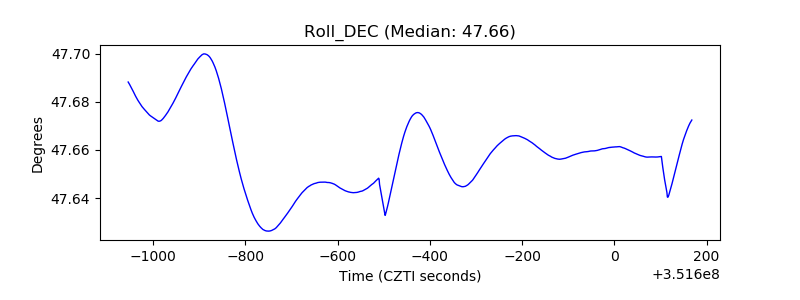 |
| _Roll_RA | 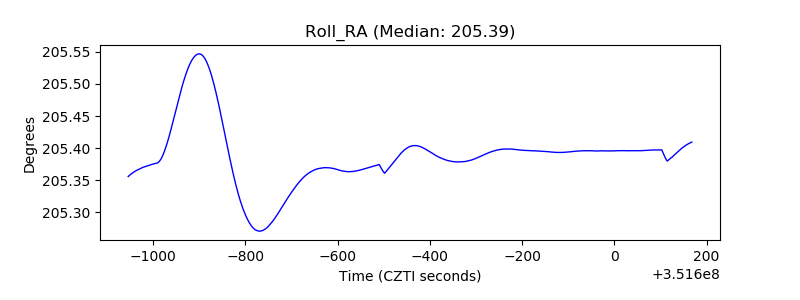 |
| Veto Counter | 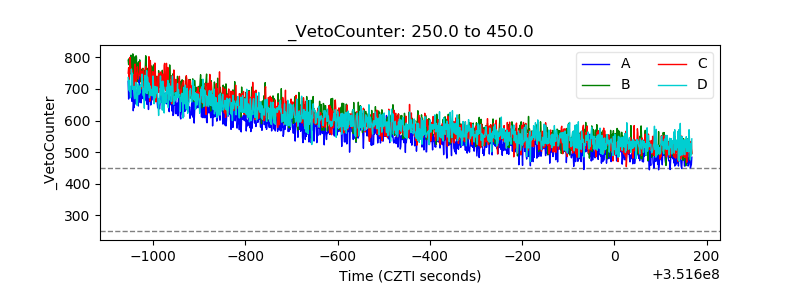 |