| Param | Original file | Final file |
|---|---|---|
| Filename | modeM0/AS1A10_053T43_9000004198_29209cztM0_level2.evt | modeM0/AS1A10_053T43_9000004198_29209cztM0_level2_quad_clean.evt |
| Size (bytes) | 713,681,280 | 69,474,240 |
| Size | 680.6 MB | 66.3 MB |
| Events in quadrant A | 3,440,278 | 439,686 |
| Events in quadrant B | 3,930,853 | 440,392 |
| Events in quadrant C | 6,123,943 | 402,514 |
| Events in quadrant D | 7,695,245 | 381,843 |
| Mode M9 | |||
|---|---|---|---|
| Quadrant | BADHDUFLAG | Total packets | Discarded packets |
| A | 0 | 12 | 0 |
| B | 0 | 12 | 0 |
| C | 0 | 12 | 0 |
| D | 0 | 12 | 0 |
| Mode SS | |||
|---|---|---|---|
| Quadrant | BADHDUFLAG | Total packets | Discarded packets |
| A | 0 | 128 | 0 |
| B | 0 | 128 | 0 |
| C | 0 | 128 | 0 |
| D | 0 | 128 | 0 |
| Mode M0 | |||
|---|---|---|---|
| Quadrant | BADHDUFLAG | Total packets | Discarded packets |
| A | 0 | 14279 | 1 |
| B | 0 | 15856 | 1 |
| C | 0 | 22796 | 2 |
| D | 0 | 27392 | 1 |
| Quadrant | Total seconds | Saturated seconds | Saturation percentage |
|---|---|---|---|
| A | 6285 | 90 | 1.431981% |
| B | 6285 | 170 | 2.704853% |
| C | 6284 | 440 | 7.001910% |
| D | 6284 | 1014 | 16.136219% |
Noise dominated data is calculated using 1-second bins in cleaned event files. If a bin has >2000 counts, and if more than 50% of those come from <1% of pixels, then it is considered to be noise-dominated and hence unusable.
| Quadrant | # 1 sec bins | Bins with >0 counts | Bins with >2000 counts | High rate bins dominated by noise | Noise dominated (total time) | Noise dominated (detector-on time) | Marked lightcurve |
|---|---|---|---|---|---|---|---|
| A | 7510 | 6286 | 0 | 0 | 0.00% | 0.00% | 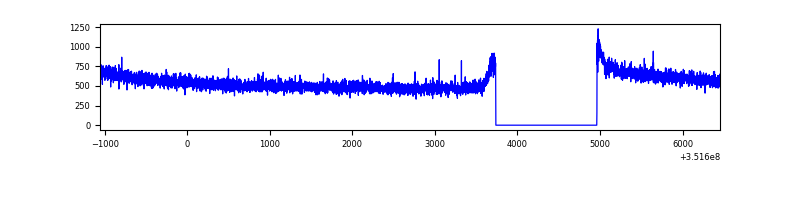 |
| B | 7510 | 6286 | 22 | 22 | 0.29% | 0.35% | 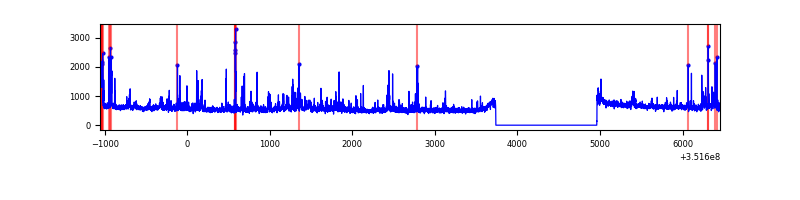 |
| C | 7509 | 6285 | 94 | 94 | 1.25% | 1.50% | 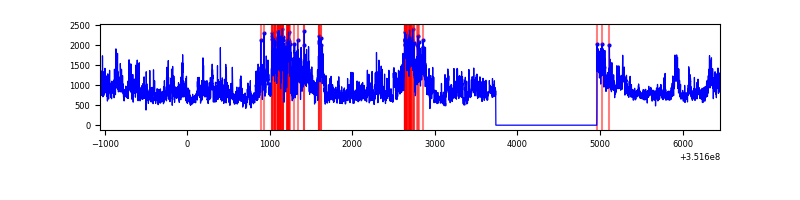 |
| D | 7509 | 6285 | 887 | 887 | 11.81% | 14.11% | 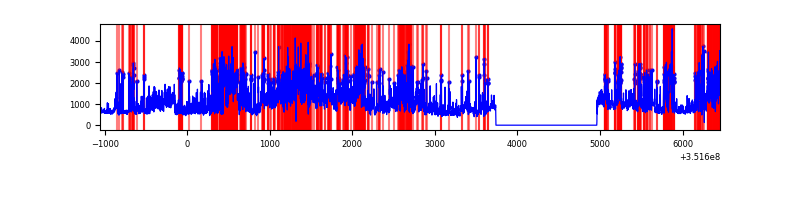 |
Top three noisy pixels from each quadrant. If the there are fewer than three noisy pixels in the level2.evt file, extra rows are filled as -1
| Pixel properties | Quadrant properties | ||||||
|---|---|---|---|---|---|---|---|
| Quadrant | DetID | PixID | Counts | Sigma | Mean | Median | Sigma |
| A | 0 | 13 | 16800 | 91.28 | 888 | 875 | 174.5 |
| A | 13 | 254 | 12736 | 67.99 | 888 | 875 | 174.5 |
| A | 3 | 137 | 7938 | 40.49 | 888 | 875 | 174.5 |
| B | 10 | 245 | 183059 | 1136.65 | 869 | 852 | 160.3 |
| B | 0 | 183 | 106646 | 659.97 | 869 | 852 | 160.3 |
| B | 0 | 229 | 104019 | 643.58 | 869 | 852 | 160.3 |
| C | 3 | 233 | 2759078 | 14745.77 | 822 | 831 | 187.1 |
| C | 14 | 238 | 136742 | 726.59 | 822 | 831 | 187.1 |
| C | 2 | 114 | 14577 | 73.49 | 822 | 831 | 187.1 |
| D | 1 | 52 | 1768515 | 9388.1 | 808 | 790 | 188.3 |
| D | 8 | 195 | 1729412 | 9180.43 | 808 | 790 | 188.3 |
| D | 7 | 80 | 931124 | 4940.85 | 808 | 790 | 188.3 |
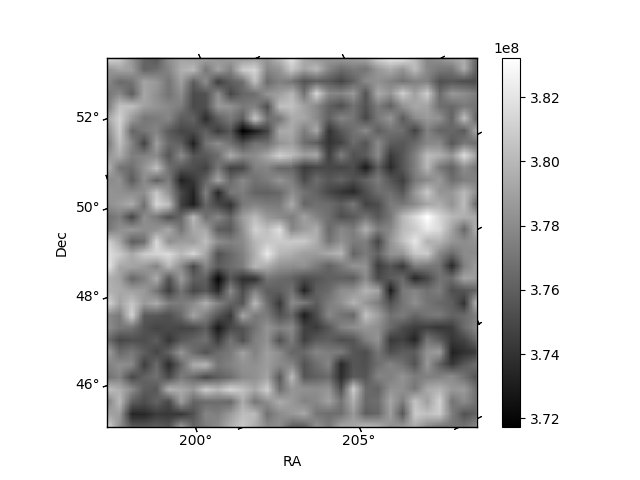
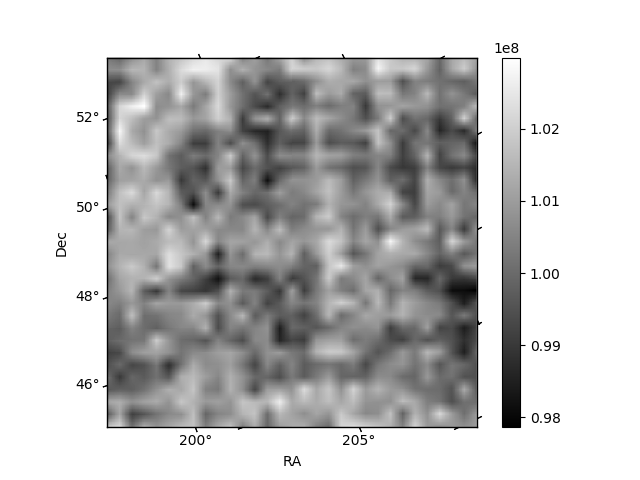
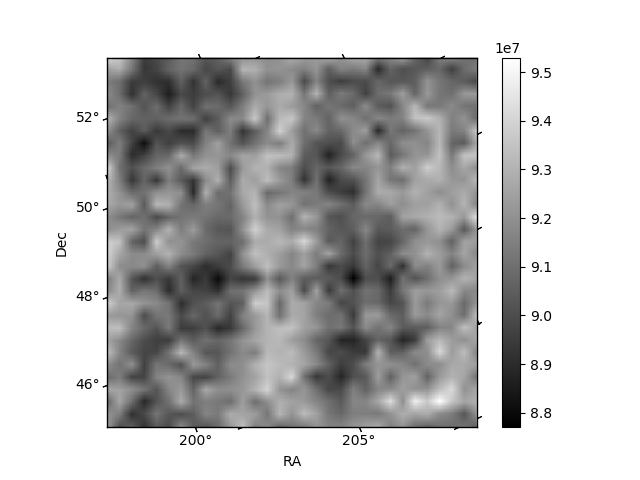
Histogram calculated using DETX and DETY for each event in the final _common_clean file
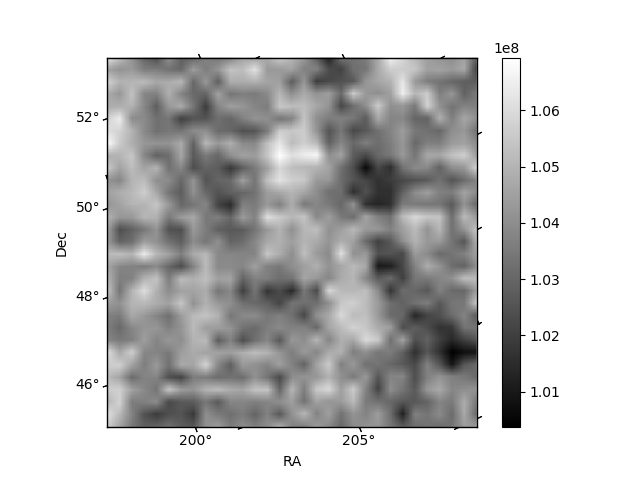
| Quadrant A | 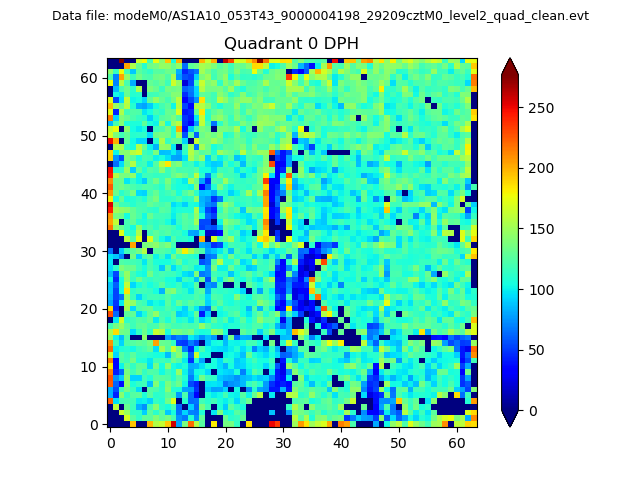 |
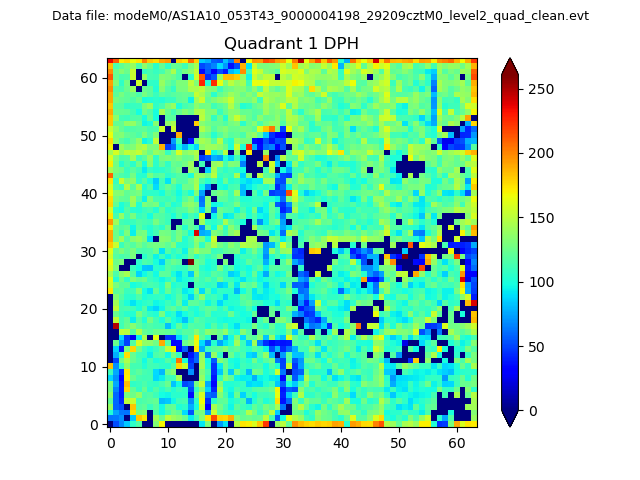 |
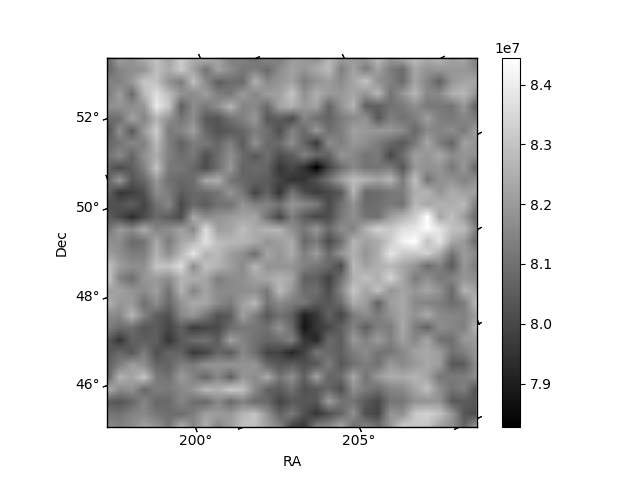
Quadrant B |
|---|---|---|---|
| Quadrant D | 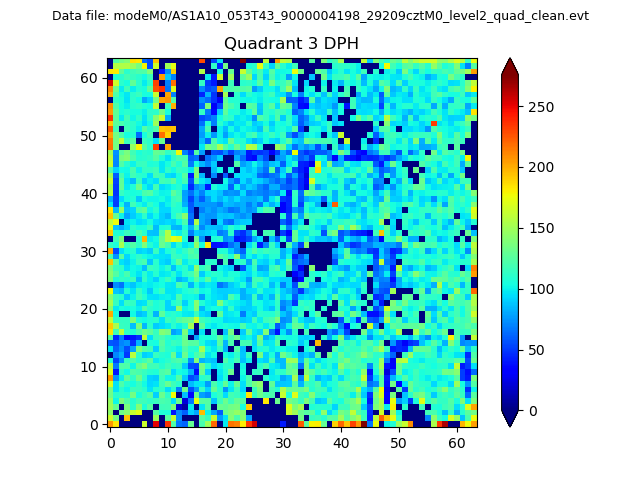 |
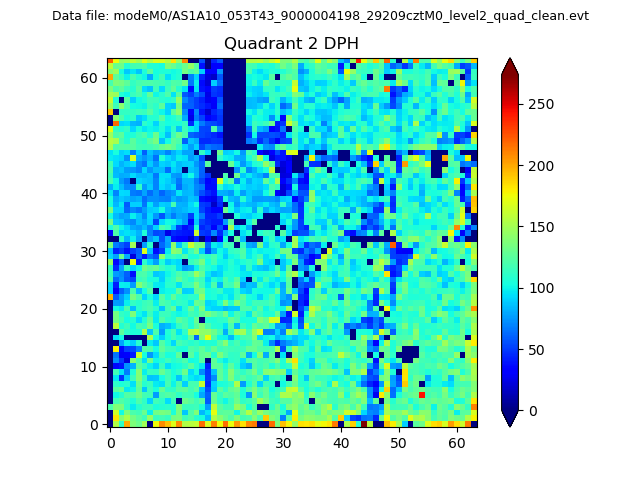 |
Quadrant C |
| Plot type | Count rate plots | Images |
|---|---|---|
| Comparison with Poisson distribution Blue bars denote a histogram of data divided into 1 sec bins. Red curve is a Poisson curve with rate = median count rate of data. |
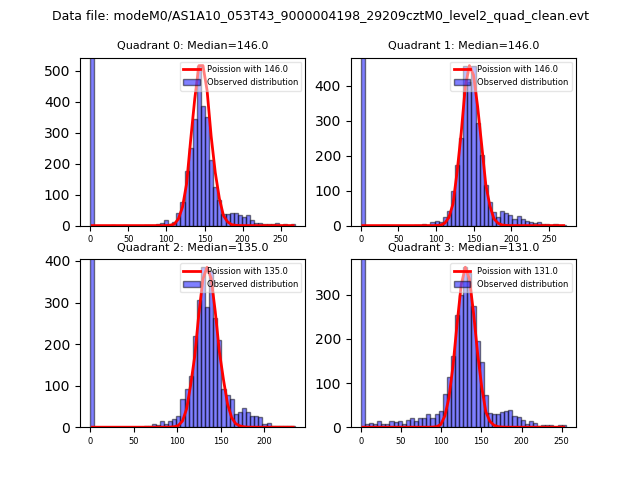 |
 |
| Quadrant-wise count rates Data is divided into 100 sec bins |
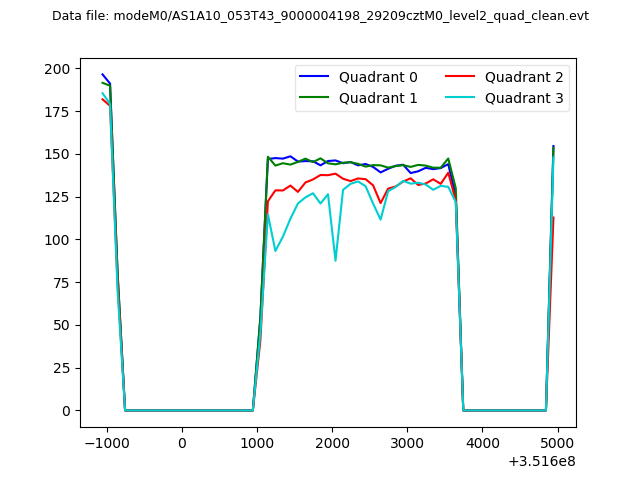 |
|
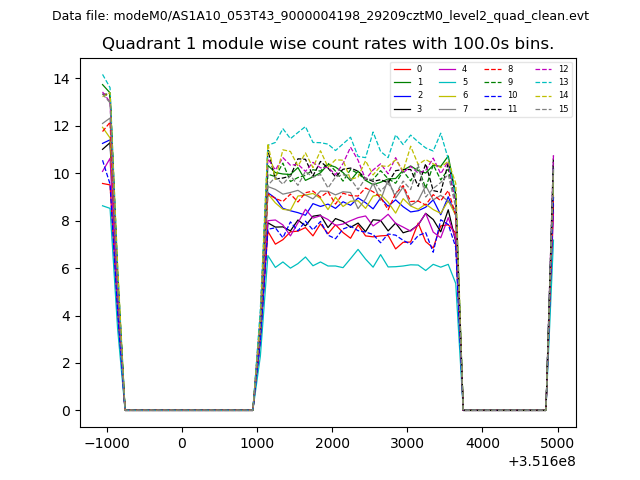
| Module-wise count rates for Quadrant A Data is divided into 100 sec bins |
 |
 |
| Module-wise count rates for Quadrant B Data is divided into 100 sec bins |
 |
 |
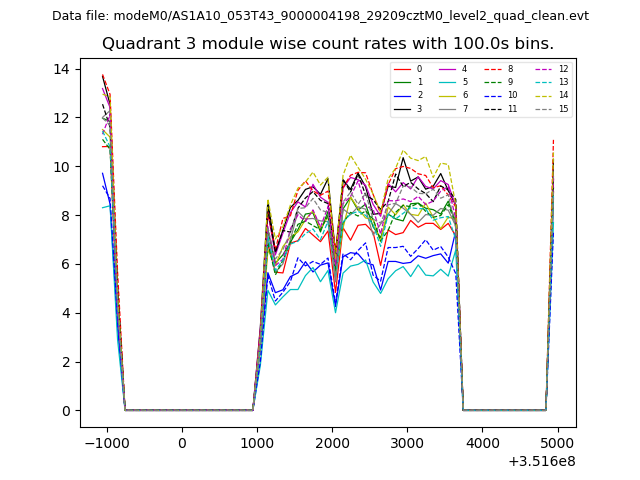
| Module-wise count rates for Quadrant C Data is divided into 100 sec bins |
 |
 |
| Module-wise count rates for Quadrant D Data is divided into 100 sec bins |
 |
 |
| Parameter | Plot |
|---|---|
| CZT HV Monitor | 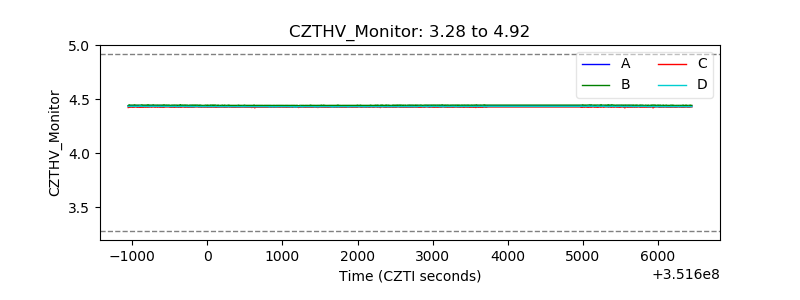 |
| D_VDD | 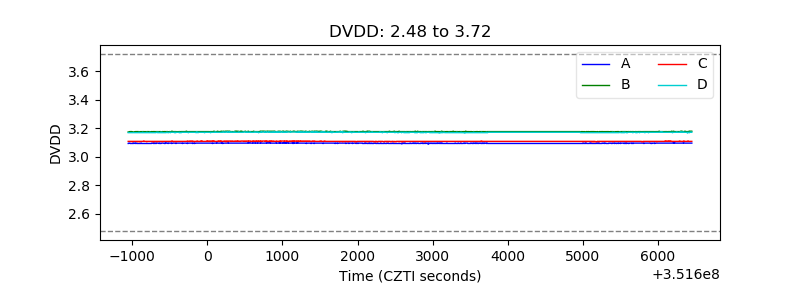 |
| Temperature 1 | 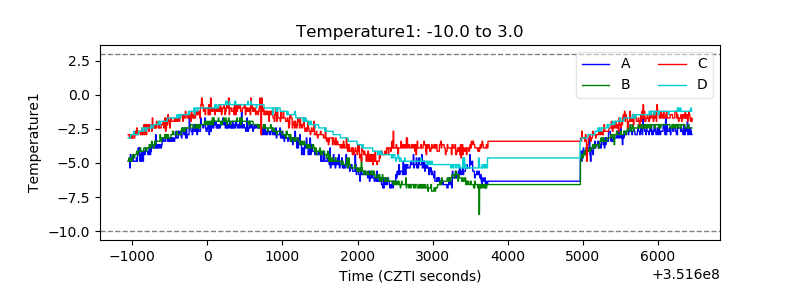 |
| Veto HV Monitor | 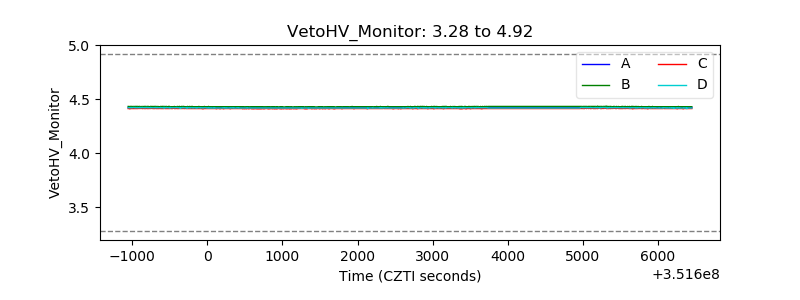 |
| Veto LLD | 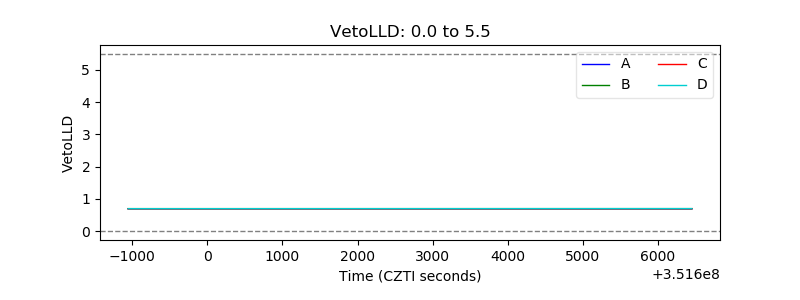 |
| Alpha Counter | 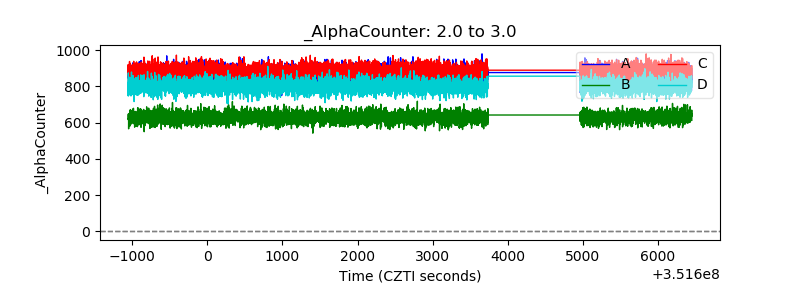 |
| _CPM_Rate | 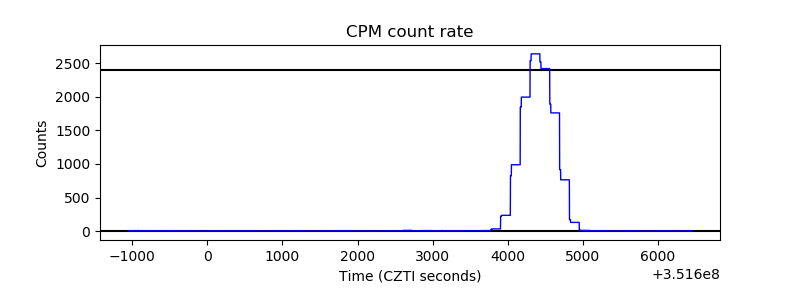 |
| CZT Counter | 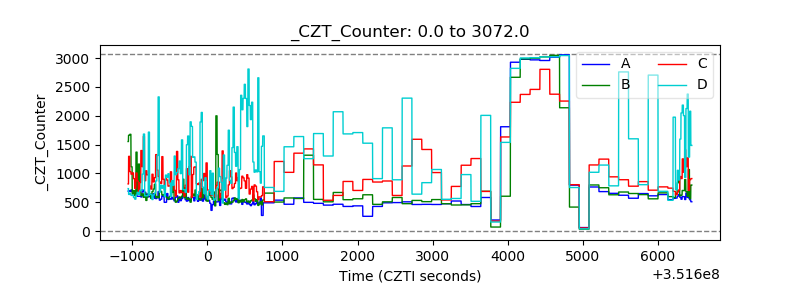 |
| +2.5 Volts monitor | 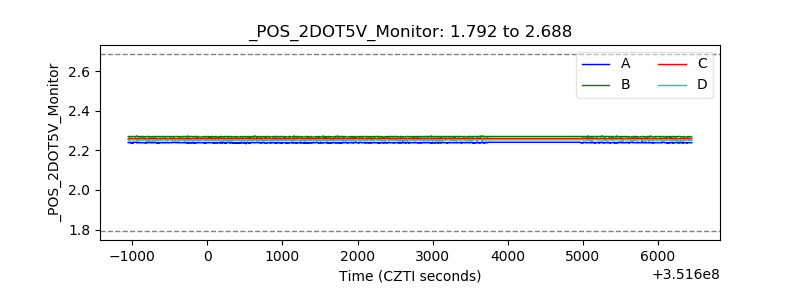 |
| +5 Volts monitor | 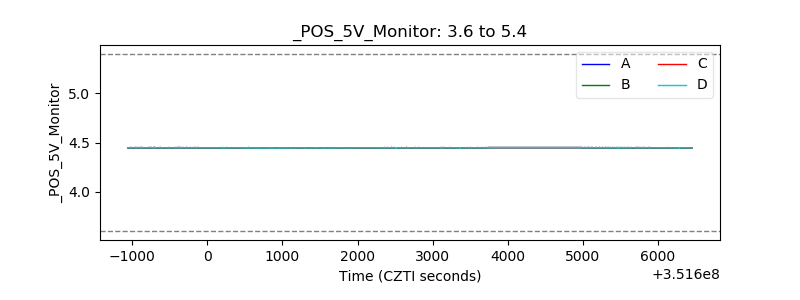 |
| _ROLL_ROT | 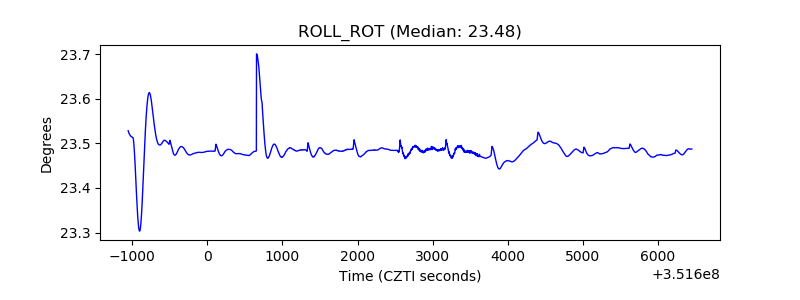 |
| _Roll_DEC | 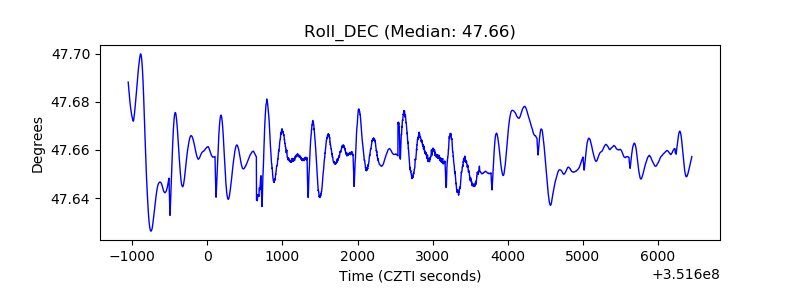 |
| _Roll_RA | 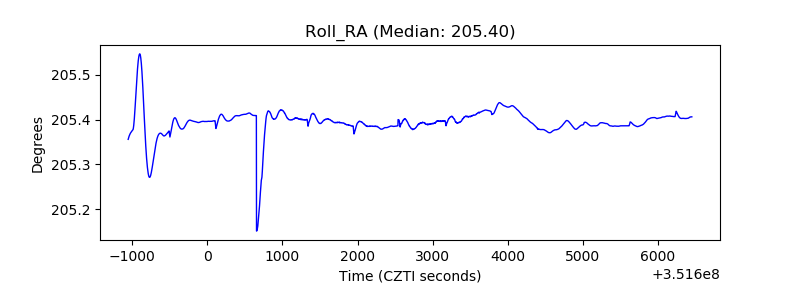 |
| Veto Counter |  |