| Param | Original file | Final file |
|---|---|---|
| Filename | modeM0/AS1A10_053T43_9000004198_29210cztM0_level2.evt | modeM0/AS1A10_053T43_9000004198_29210cztM0_level2_quad_clean.evt |
| Size (bytes) | 337,320,000 | 31,680,000 |
| Size | 321.7 MB | 30.2 MB |
| Events in quadrant A | 1,803,208 | 192,131 |
| Events in quadrant B | 2,100,880 | 190,285 |
| Events in quadrant C | 2,545,450 | 177,629 |
| Events in quadrant D | 3,552,334 | 174,910 |
| Mode M9 | |||
|---|---|---|---|
| Quadrant | BADHDUFLAG | Total packets | Discarded packets |
| A | 0 | 3 | 0 |
| B | 0 | 4 | 0 |
| C | 0 | 4 | 0 |
| D | 0 | 4 | 0 |
| Mode SS | |||
|---|---|---|---|
| Quadrant | BADHDUFLAG | Total packets | Discarded packets |
| A | 0 | 64 | 0 |
| B | 0 | 64 | 0 |
| C | 0 | 64 | 0 |
| D | 0 | 64 | 0 |
| Mode M0 | |||
|---|---|---|---|
| Quadrant | BADHDUFLAG | Total packets | Discarded packets |
| A | 0 | 7404 | 1 |
| B | 0 | 8490 | 1 |
| C | 0 | 9896 | 1 |
| D | 0 | 12794 | 1 |
| Quadrant | Total seconds | Saturated seconds | Saturation percentage |
|---|---|---|---|
| A | 3140 | 36 | 1.146497% |
| B | 3140 | 74 | 2.356688% |
| C | 3140 | 141 | 4.490446% |
| D | 3140 | 422 | 13.439490% |
Noise dominated data is calculated using 1-second bins in cleaned event files. If a bin has >2000 counts, and if more than 50% of those come from <1% of pixels, then it is considered to be noise-dominated and hence unusable.
| Quadrant | # 1 sec bins | Bins with >0 counts | Bins with >2000 counts | High rate bins dominated by noise | Noise dominated (total time) | Noise dominated (detector-on time) | Marked lightcurve |
|---|---|---|---|---|---|---|---|
| A | 3140 | 3140 | 0 | 0 | 0.00% | 0.00% | 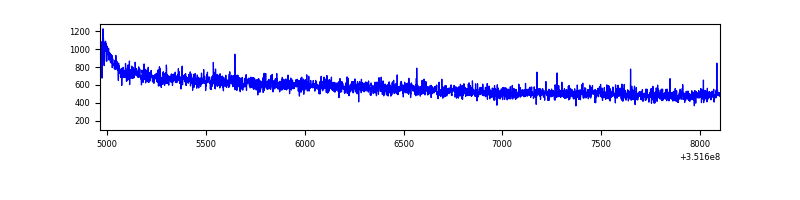 |
| B | 3140 | 3140 | 17 | 17 | 0.54% | 0.54% | 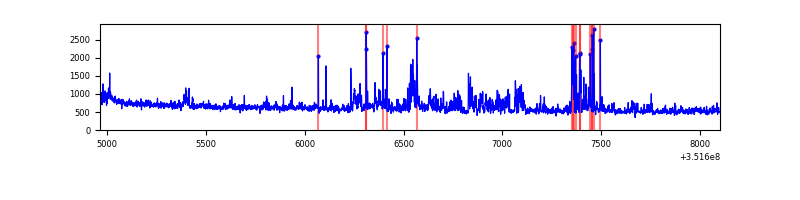 |
| C | 3140 | 3140 | 3 | 3 | 0.10% | 0.10% | 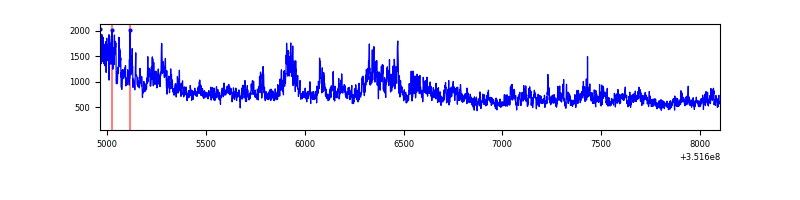 |
| D | 3140 | 3140 | 344 | 344 | 10.96% | 10.96% | 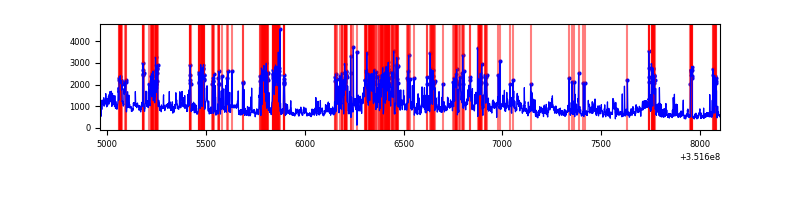 |
Top three noisy pixels from each quadrant. If the there are fewer than three noisy pixels in the level2.evt file, extra rows are filled as -1
| Pixel properties | Quadrant properties | ||||||
|---|---|---|---|---|---|---|---|
| Quadrant | DetID | PixID | Counts | Sigma | Mean | Median | Sigma |
| A | 0 | 13 | 11253 | 117.04 | 464 | 457 | 92.2 |
| A | 13 | 254 | 6496 | 65.47 | 464 | 457 | 92.2 |
| A | 0 | 226 | 3995 | 38.35 | 464 | 457 | 92.2 |
| B | 0 | 183 | 133815 | 1580.97 | 452 | 444 | 84.4 |
| B | 10 | 245 | 98105 | 1157.67 | 452 | 444 | 84.4 |
| B | 0 | 229 | 65612 | 772.5 | 452 | 444 | 84.4 |
| C | 3 | 233 | 775049 | 7787.84 | 433 | 436 | 99.5 |
| C | 14 | 238 | 74008 | 739.68 | 433 | 436 | 99.5 |
| C | 2 | 114 | 7418 | 70.2 | 433 | 436 | 99.5 |
| D | 1 | 52 | 1405165 | 13828.25 | 429 | 420 | 101.6 |
| D | 8 | 195 | 453756 | 4462.62 | 429 | 420 | 101.6 |
| D | 2 | 250 | 34582 | 336.29 | 429 | 420 | 101.6 |
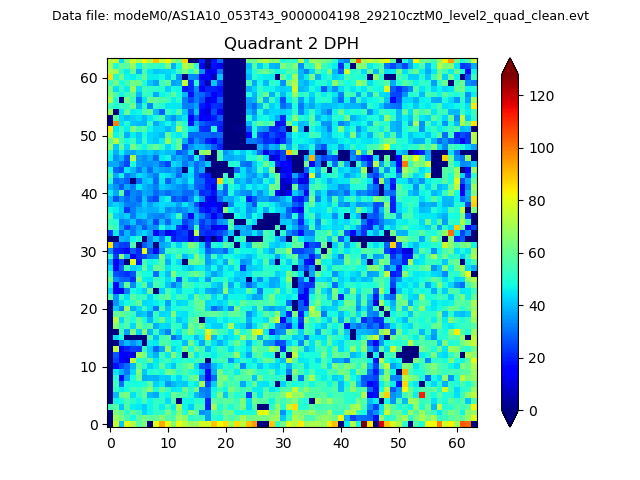
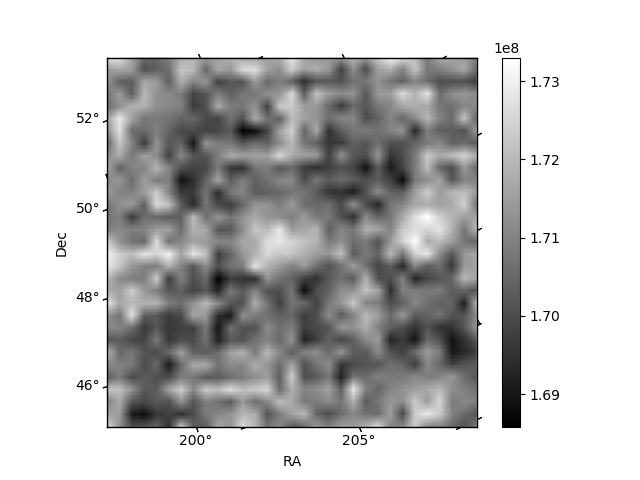
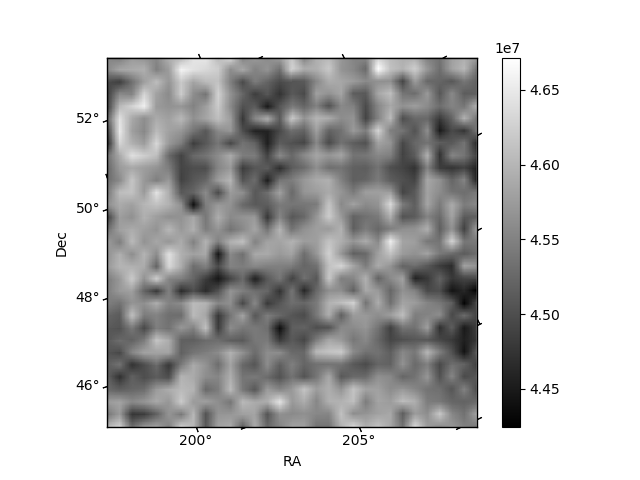
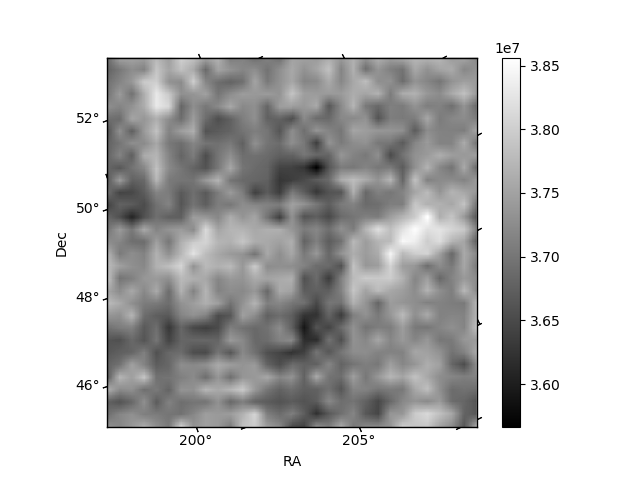
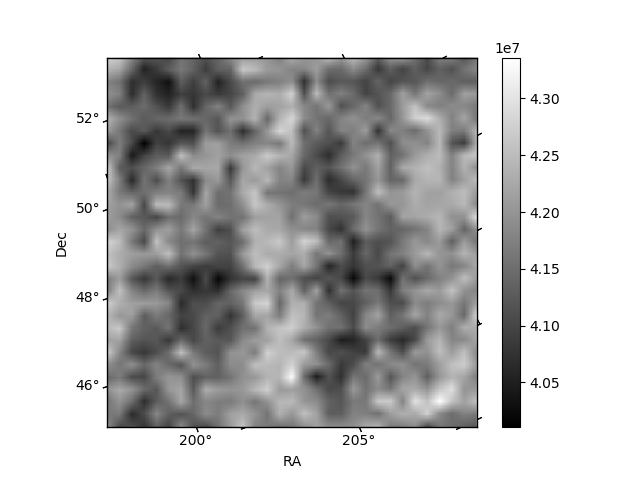
Histogram calculated using DETX and DETY for each event in the final _common_clean file
| Quadrant A | 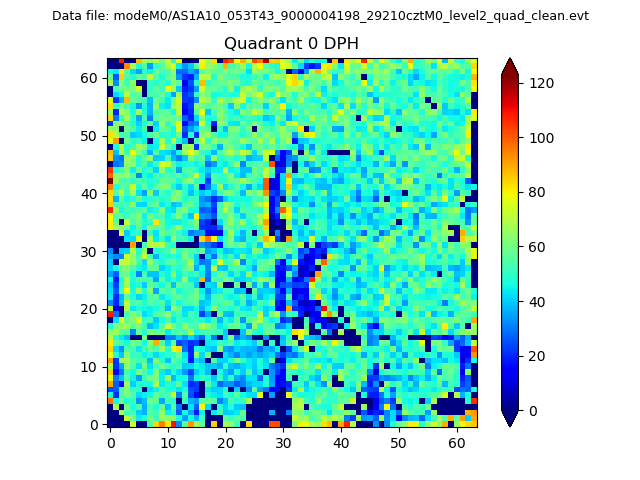 |
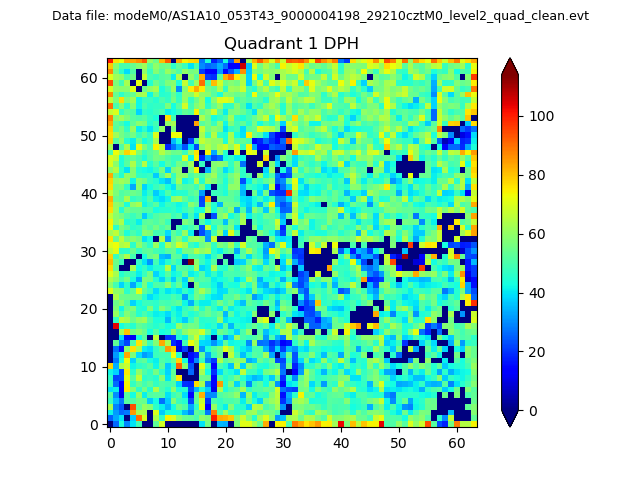 |
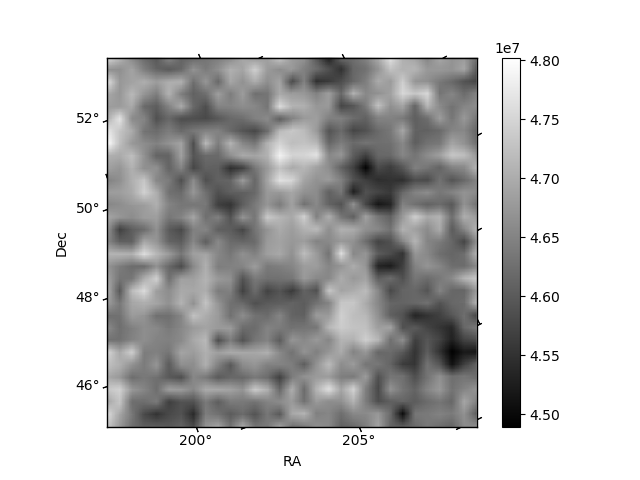
Quadrant B |
|---|---|---|---|
| Quadrant D | 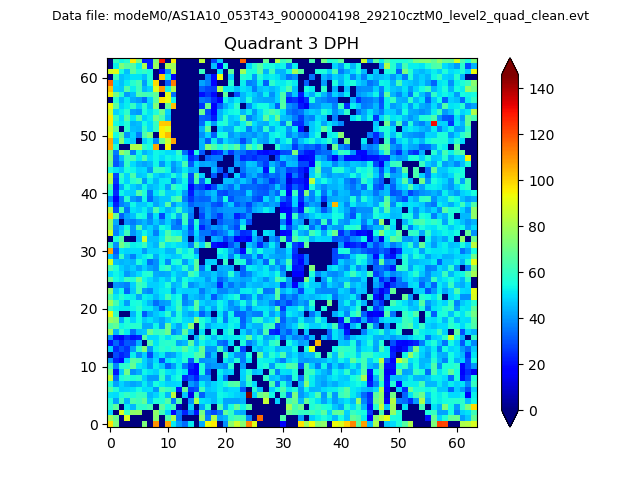 |
 |
Quadrant C |
| Plot type | Count rate plots | Images |
|---|---|---|
| Comparison with Poisson distribution Blue bars denote a histogram of data divided into 1 sec bins. Red curve is a Poisson curve with rate = median count rate of data. |
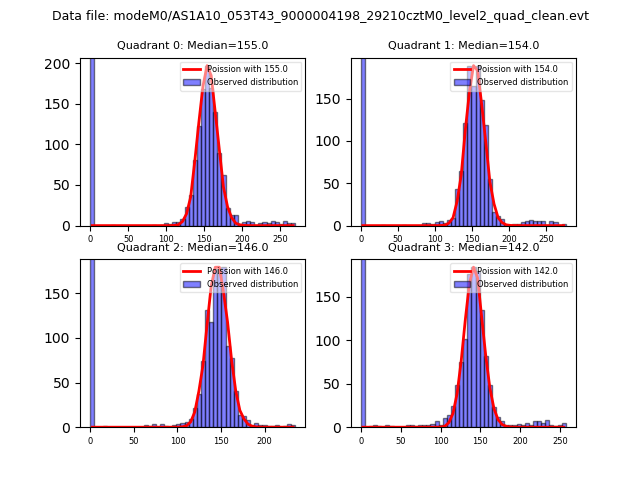 |
 |
| Quadrant-wise count rates Data is divided into 100 sec bins |
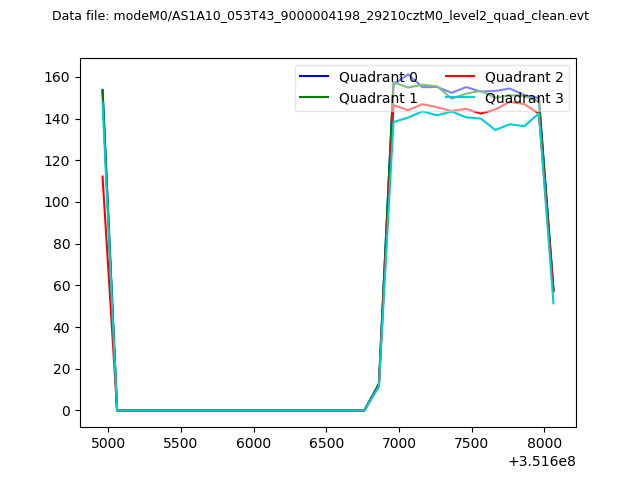 |
|
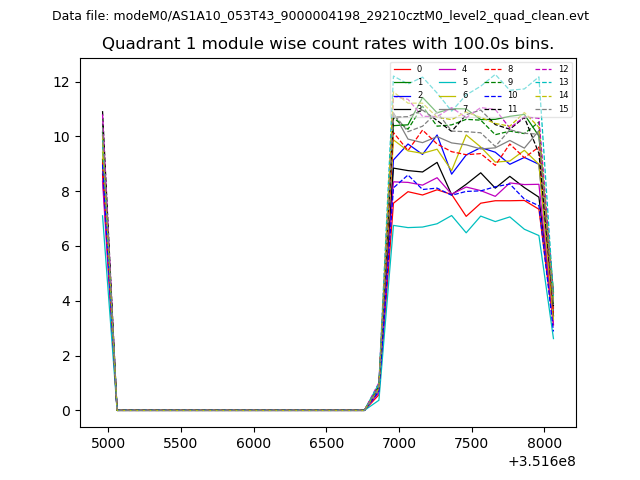
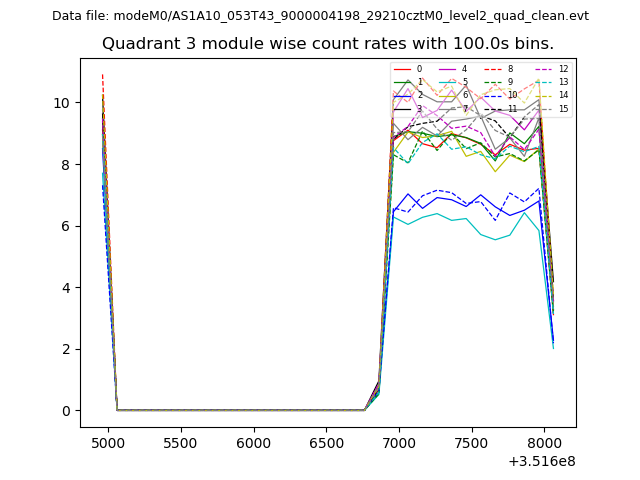
| Module-wise count rates for Quadrant A Data is divided into 100 sec bins |
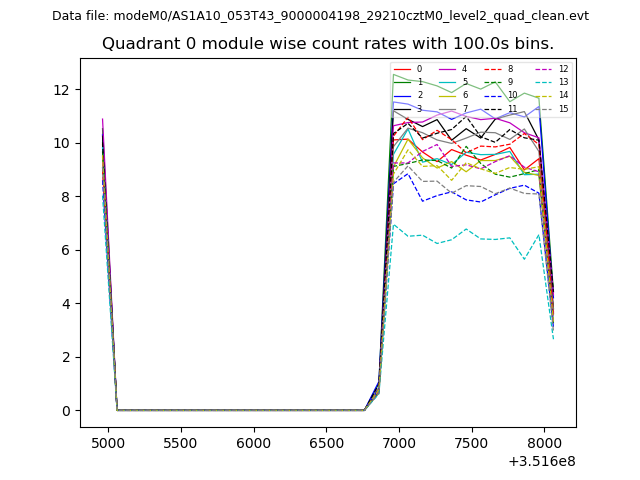 |
 |
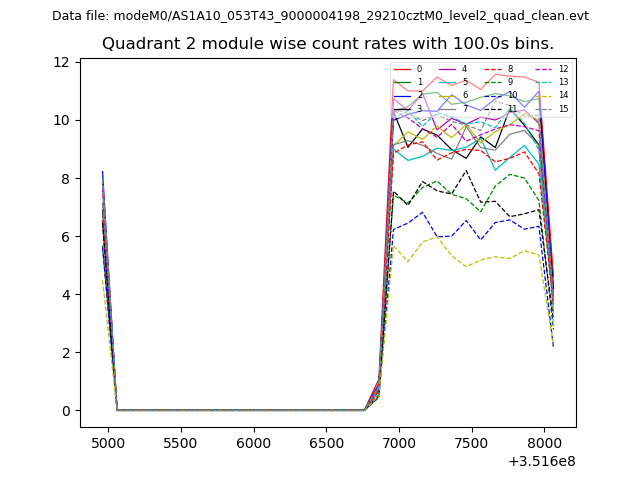
| Module-wise count rates for Quadrant B Data is divided into 100 sec bins |
 |
 |
| Module-wise count rates for Quadrant C Data is divided into 100 sec bins |
 |
 |
| Module-wise count rates for Quadrant D Data is divided into 100 sec bins |
 |
 |
| Parameter | Plot |
|---|---|
| CZT HV Monitor | 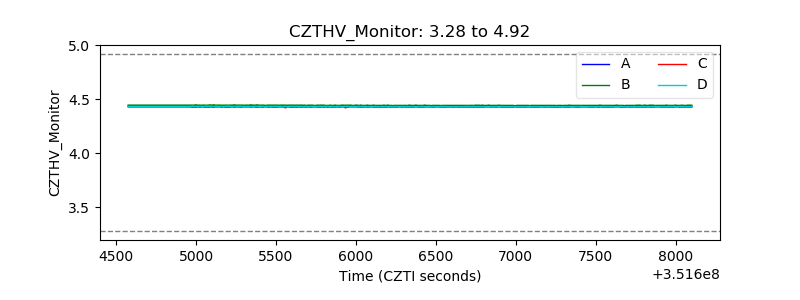 |
| D_VDD | 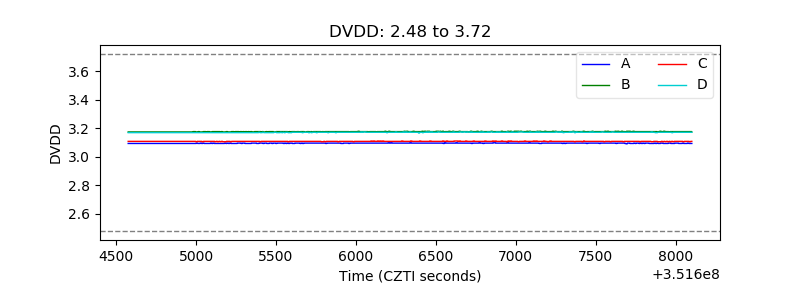 |
| Temperature 1 | 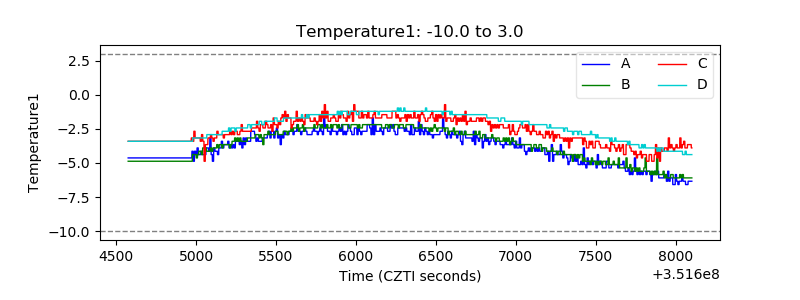 |
| Veto HV Monitor | 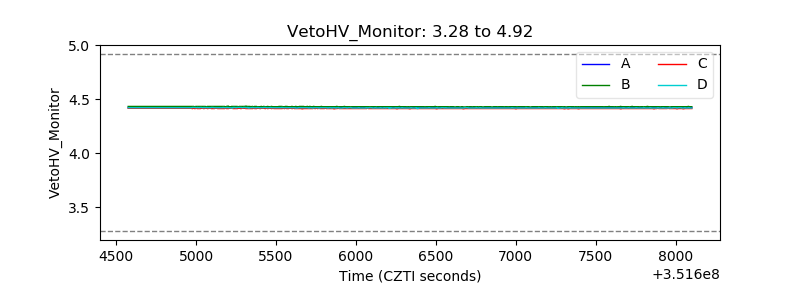 |
| Veto LLD | 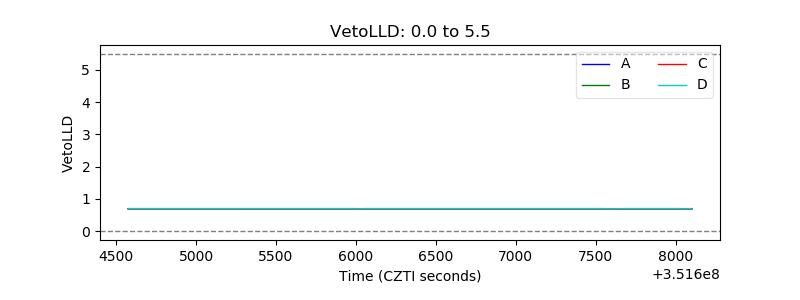 |
| Alpha Counter | 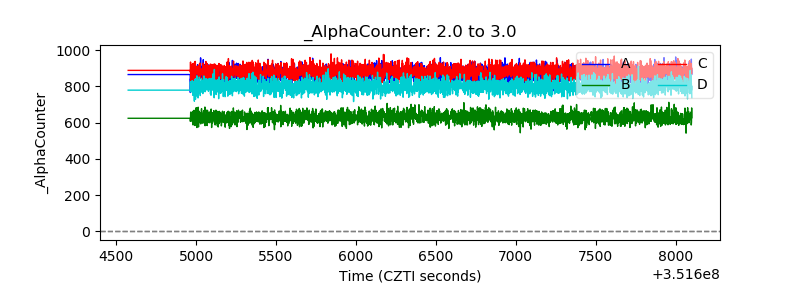 |
| _CPM_Rate | 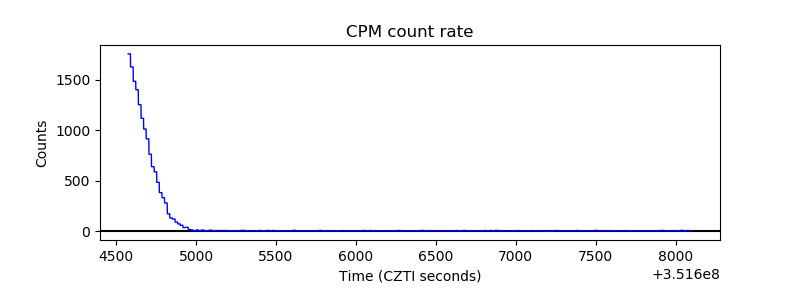 |
| CZT Counter | 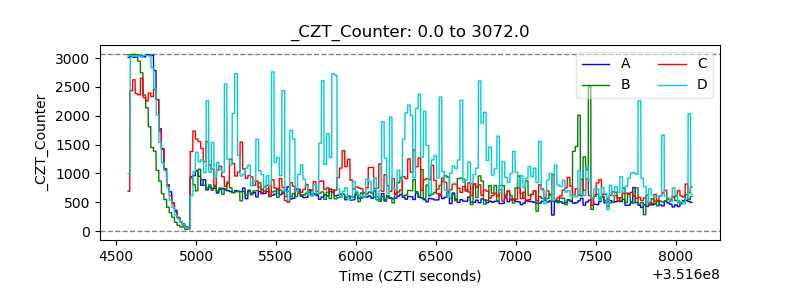 |
| +2.5 Volts monitor |  |
| +5 Volts monitor |  |
| _ROLL_ROT | 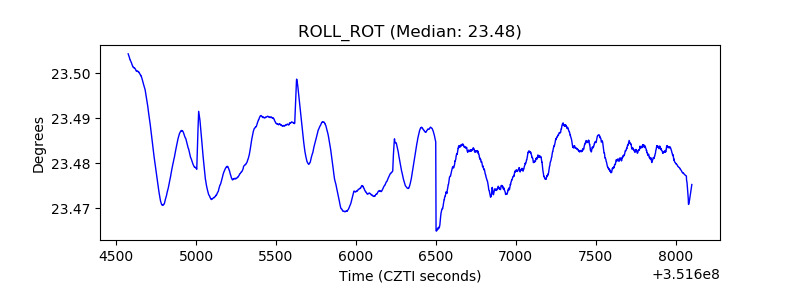 |
| _Roll_DEC | 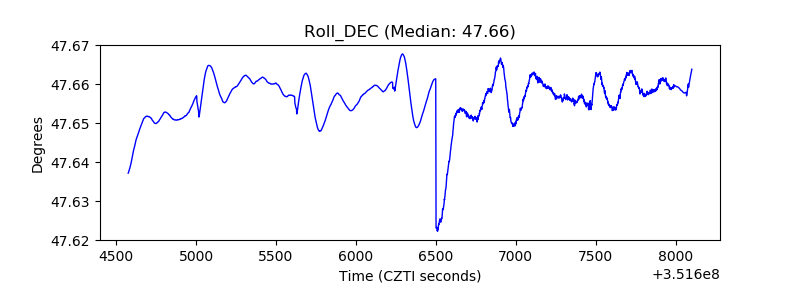 |
| _Roll_RA | 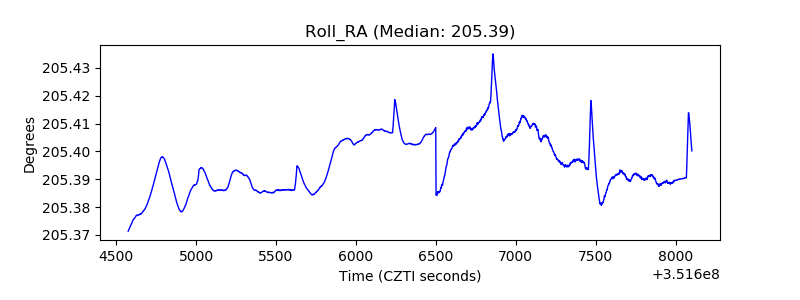 |
| Veto Counter | 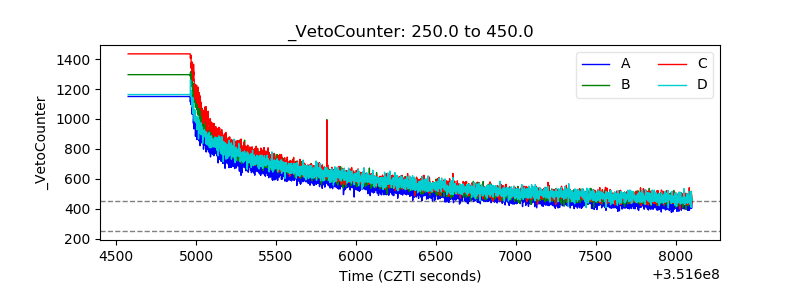 |