| Param | Original file | Final file |
|---|---|---|
| Filename | modeM0/AS1A10_094T71_9000004196cztM0_level2.fits | modeM0/AS1A10_094T71_9000004196cztM0_level2_quad_clean.evt |
| Size (bytes) | 52,989,120 | 46,414,080 |
| Size | 50.5 MB | 44.3 MB |
| Events in quadrant A | 338,474 | 284,924 |
| Events in quadrant B | 322,200 | 281,350 |
| Events in quadrant C | 298,700 | 236,150 |
| Events in quadrant D | 281,424 | 238,550 |
| Mode SS | |||
|---|---|---|---|
| Quadrant | BADHDUFLAG | Total packets | Discarded packets |
| A | 0 | 106 | 0 |
| B | 0 | 106 | 0 |
| C | 0 | 106 | 0 |
| D | 0 | 106 | 0 |
| Mode M9 | |||
|---|---|---|---|
| Quadrant | BADHDUFLAG | Total packets | Discarded packets |
| A | 0 | 10 | 0 |
| B | 0 | 10 | 0 |
| C | 0 | 10 | 0 |
| D | 0 | 10 | 0 |
| Mode M0 | |||
|---|---|---|---|
| Quadrant | BADHDUFLAG | Total packets | Discarded packets |
| A | 0 | 10916 | 0 |
| B | 0 | 11806 | 0 |
| C | 0 | 23781 | 0 |
| D | 0 | 16688 | 0 |
| Quadrant | Total seconds | Saturated seconds | Saturation percentage |
|---|---|---|---|
| A | 5191 | 34 | 0.654980% |
| B | 5191 | 72 | 1.387016% |
| C | 5191 | 934 | 17.992680% |
| D | 5191 | 313 | 6.029667% |
Noise dominated data is calculated using 1-second bins in cleaned event files. If a bin has >2000 counts, and if more than 50% of those come from <1% of pixels, then it is considered to be noise-dominated and hence unusable.
| Quadrant | # 1 sec bins | Bins with >0 counts | Bins with >2000 counts | High rate bins dominated by noise | Noise dominated (total time) | Noise dominated (detector-on time) | Marked lightcurve |
|---|---|---|---|---|---|---|---|
| A | 6231 | 5191 | 0 | 0 | 0.00% | 0.00% |  |
| B | 6231 | 5191 | 0 | 0 | 0.00% | 0.00% |  |
| C | 6231 | 5188 | 0 | 0 | 0.00% | 0.00% | 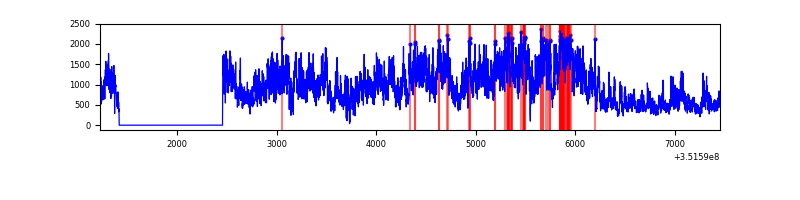 |
| D | 6231 | 5191 | 0 | 0 | 0.00% | 0.00% |  |
Top three noisy pixels from each quadrant. If the there are fewer than three noisy pixels in the level2.evt file, extra rows are filled as -1
| Pixel properties | Quadrant properties | ||||||
|---|---|---|---|---|---|---|---|
| Quadrant | DetID | PixID | Counts | Sigma | Mean | Median | Sigma |
| A | 0 | 29 | 292 | 9.13 | 88 | 84 | 22.8 |
| A | 9 | 19 | 257 | 7.59 | 88 | 84 | 22.8 |
| A | 0 | 30 | 251 | 7.33 | 88 | 84 | 22.8 |
| B | 2 | 9 | 218 | 7.18 | 85 | 82 | 19.0 |
| B | 10 | 128 | 213 | 6.91 | 85 | 82 | 19.0 |
| B | 2 | 8 | 212 | 6.86 | 85 | 82 | 19.0 |
| C | 3 | 202 | 244 | 7.81 | 78 | 74 | 21.8 |
| C | 3 | 203 | 223 | 6.84 | 78 | 74 | 21.8 |
| C | 3 | 126 | 214 | 6.43 | 78 | 74 | 21.8 |
| D | 7 | 3 | 224 | 6.68 | 80 | 73 | 22.6 |
| D | 7 | 5 | 212 | 6.15 | 80 | 73 | 22.6 |
| D | 10 | 189 | 207 | 5.93 | 80 | 73 | 22.6 |
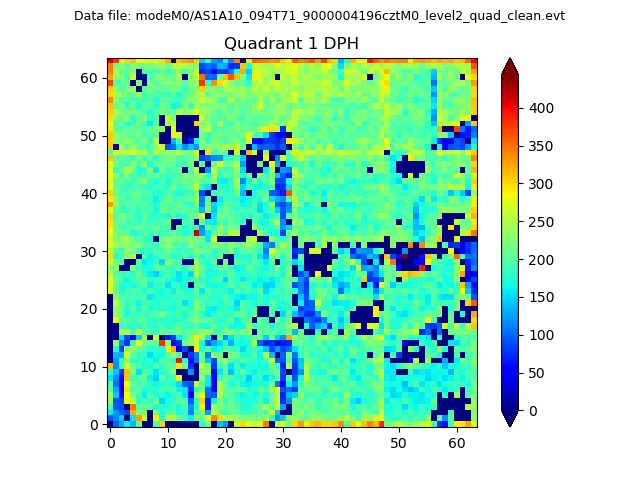
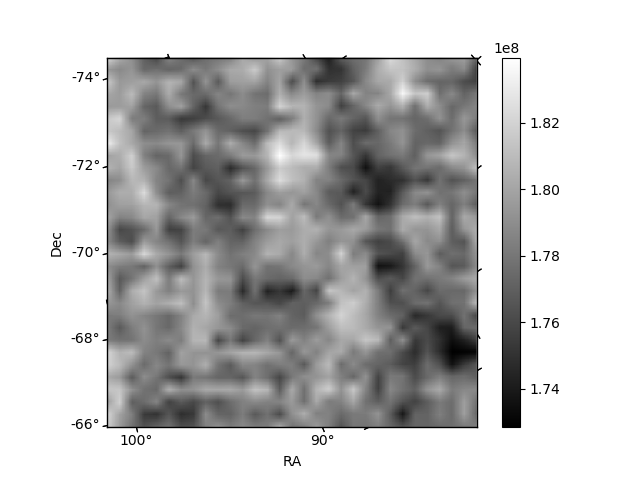
Histogram calculated using DETX and DETY for each event in the final _common_clean file
| Quadrant A |  |
 |
Quadrant B |
|---|---|---|---|
| Quadrant D | 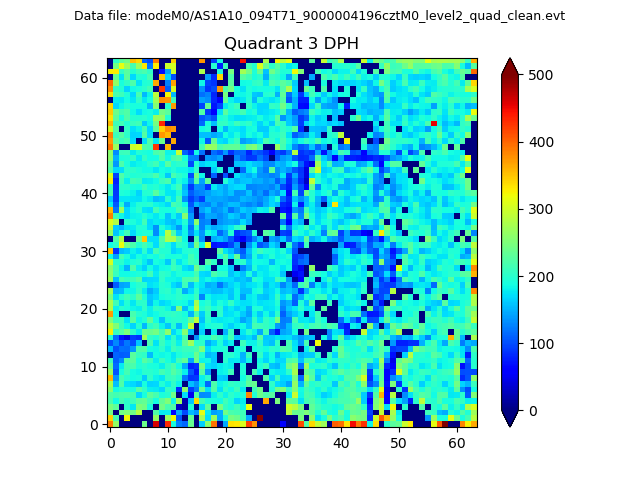 |
 |
Quadrant C |
| Plot type | Count rate plots | Images |
|---|---|---|
| Comparison with Poisson distribution Blue bars denote a histogram of data divided into 1 sec bins. Red curve is a Poisson curve with rate = median count rate of data. |
 |
 |
| Quadrant-wise count rates Data is divided into 100 sec bins |
 |
|
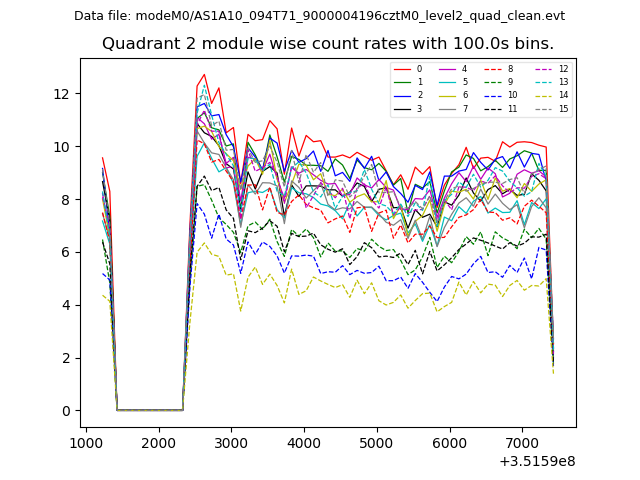
| Module-wise count rates for Quadrant A Data is divided into 100 sec bins |
 |
 |
| Module-wise count rates for Quadrant B Data is divided into 100 sec bins |
 |
 |
| Module-wise count rates for Quadrant C Data is divided into 100 sec bins |
 |
 |
| Module-wise count rates for Quadrant D Data is divided into 100 sec bins |
 |
 |
| Parameter | Plot |
|---|---|
| CZT HV Monitor |  |
| D_VDD |  |
| Temperature 1 |  |
| Veto HV Monitor | 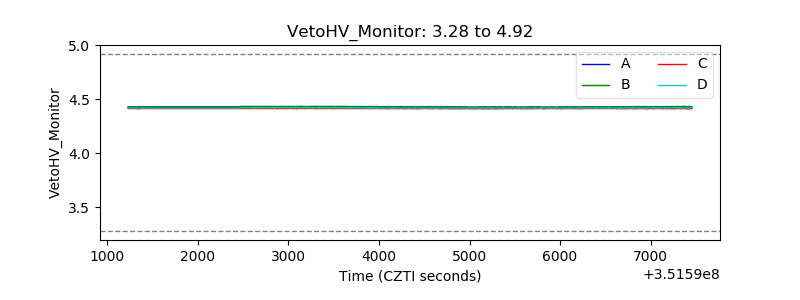 |
| Veto LLD | 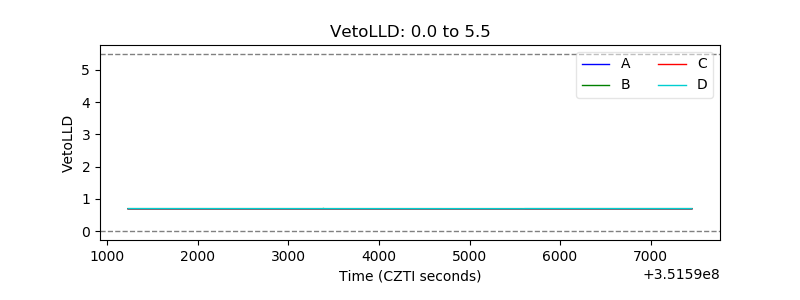 |
| Alpha Counter | 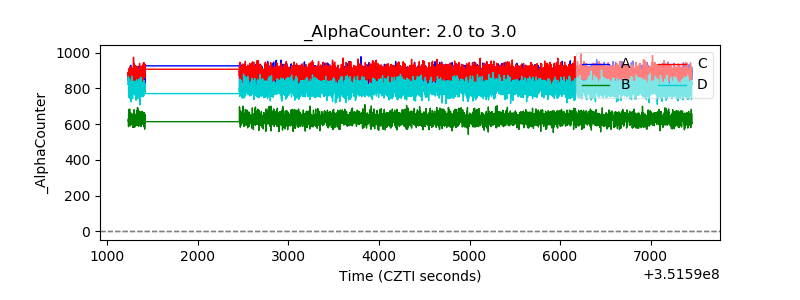 |
| _CPM_Rate |  |
| CZT Counter | 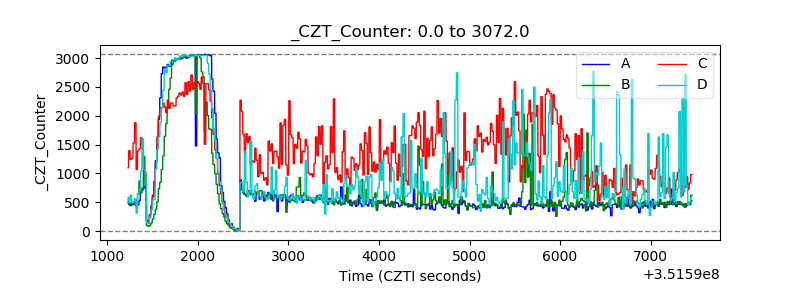 |
| +2.5 Volts monitor |  |
| +5 Volts monitor | 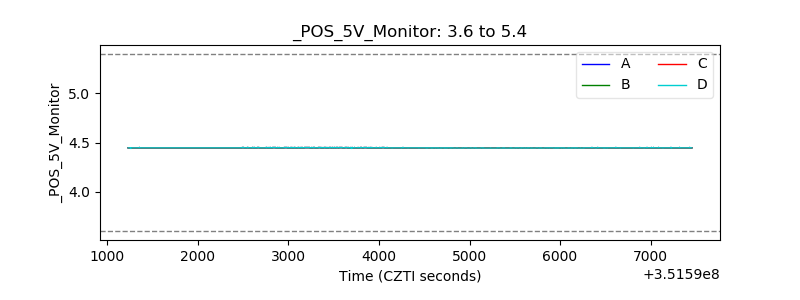 |
| _ROLL_ROT | 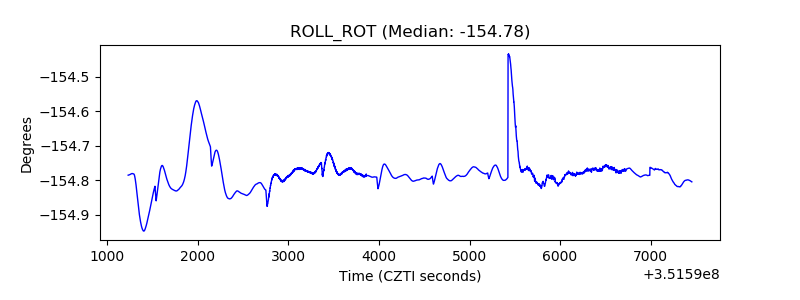 |
| _Roll_DEC |  |
| _Roll_RA |  |
| Veto Counter | 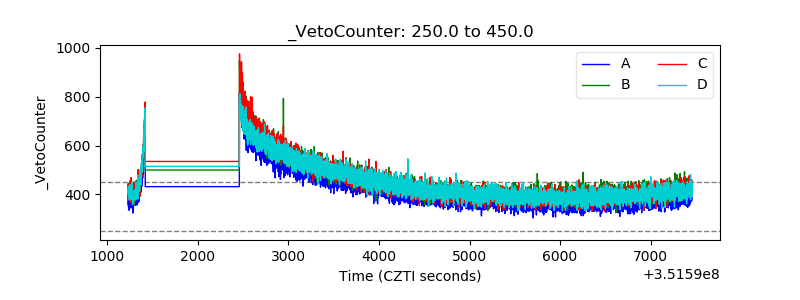 |