| Param | Original file | Final file |
|---|---|---|
| Filename | modeM0/AS1A10_094T71_9000004196_29206cztM0_level2.evt | modeM0/AS1A10_094T71_9000004196_29206cztM0_level2_quad_clean.evt |
| Size (bytes) | 171,529,920 | 36,008,640 |
| Size | 163.6 MB | 34.3 MB |
| Events in quadrant A | 903,147 | 255,909 |
| Events in quadrant B | 950,827 | 262,686 |
| Events in quadrant C | 2,122,623 | 218,114 |
| Events in quadrant D | 1,107,765 | 235,651 |
| Mode SS | |||
|---|---|---|---|
| Quadrant | BADHDUFLAG | Total packets | Discarded packets |
| A | 0 | 34 | 0 |
| B | 0 | 34 | 0 |
| C | 0 | 34 | 0 |
| D | 0 | 34 | 0 |
| Mode M9 | |||
|---|---|---|---|
| Quadrant | BADHDUFLAG | Total packets | Discarded packets |
| A | 0 | 10 | 0 |
| B | 0 | 10 | 0 |
| C | 0 | 10 | 0 |
| D | 0 | 10 | 0 |
| Mode M0 | |||
|---|---|---|---|
| Quadrant | BADHDUFLAG | Total packets | Discarded packets |
| A | 0 | 3697 | 1 |
| B | 0 | 3852 | 1 |
| C | 0 | 7434 | 2 |
| D | 0 | 4371 | 1 |
| Quadrant | Total seconds | Saturated seconds | Saturation percentage |
|---|---|---|---|
| A | 1593 | 32 | 2.008788% |
| B | 1593 | 37 | 2.322662% |
| C | 1592 | 503 | 31.595477% |
| D | 1592 | 71 | 4.459799% |
Noise dominated data is calculated using 1-second bins in cleaned event files. If a bin has >2000 counts, and if more than 50% of those come from <1% of pixels, then it is considered to be noise-dominated and hence unusable.
| Quadrant | # 1 sec bins | Bins with >0 counts | Bins with >2000 counts | High rate bins dominated by noise | Noise dominated (total time) | Noise dominated (detector-on time) | Marked lightcurve |
|---|---|---|---|---|---|---|---|
| A | 2633 | 1594 | 0 | 0 | 0.00% | 0.00% | 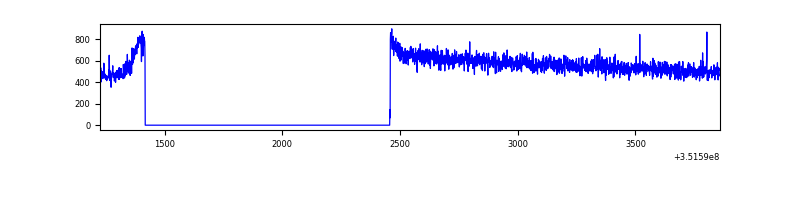 |
| B | 2633 | 1594 | 0 | 0 | 0.00% | 0.00% | 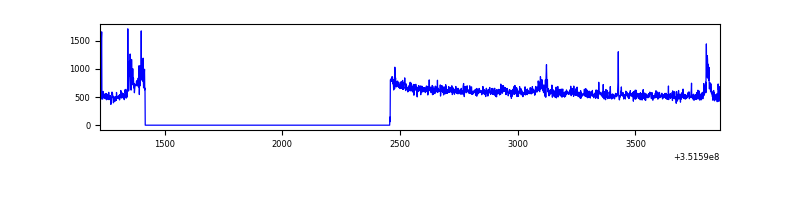 |
| C | 2632 | 1593 | 63 | 63 | 2.39% | 3.95% |  |
| D | 2632 | 1593 | 14 | 14 | 0.53% | 0.88% |  |
Top three noisy pixels from each quadrant. If the there are fewer than three noisy pixels in the level2.evt file, extra rows are filled as -1
| Pixel properties | Quadrant properties | ||||||
|---|---|---|---|---|---|---|---|
| Quadrant | DetID | PixID | Counts | Sigma | Mean | Median | Sigma |
| A | 13 | 254 | 2918 | 57.13 | 233 | 228 | 47.1 |
| A | 3 | 137 | 2089 | 39.53 | 233 | 228 | 47.1 |
| A | 0 | 226 | 1922 | 35.98 | 233 | 228 | 47.1 |
| B | 5 | 255 | 18398 | 403.9 | 230 | 224 | 45.0 |
| B | 0 | 183 | 17754 | 389.59 | 230 | 224 | 45.0 |
| B | 12 | 111 | 5266 | 112.05 | 230 | 224 | 45.0 |
| C | 3 | 233 | 1225036 | 24828.25 | 208 | 210 | 49.3 |
| C | 14 | 238 | 51398 | 1037.62 | 208 | 210 | 49.3 |
| C | 14 | 254 | 28255 | 568.5 | 208 | 210 | 49.3 |
| D | 1 | 52 | 133926 | 2476.43 | 226 | 220 | 54.0 |
| D | 8 | 195 | 100177 | 1851.35 | 226 | 220 | 54.0 |
| D | 2 | 250 | 15134 | 276.23 | 226 | 220 | 54.0 |
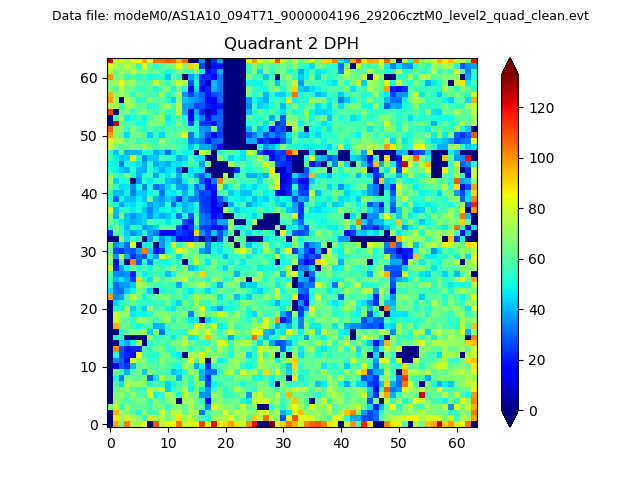
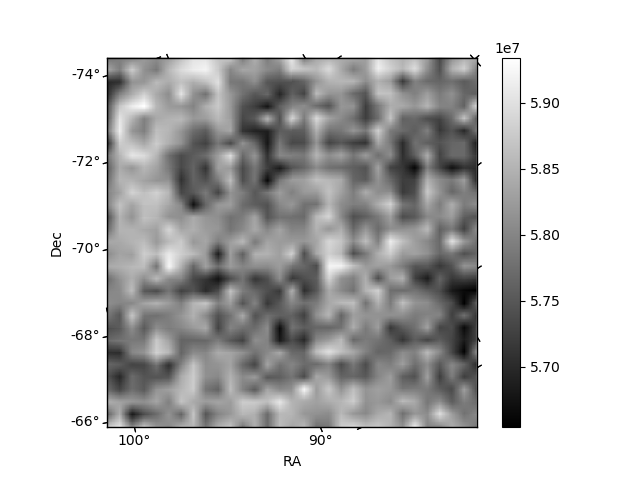
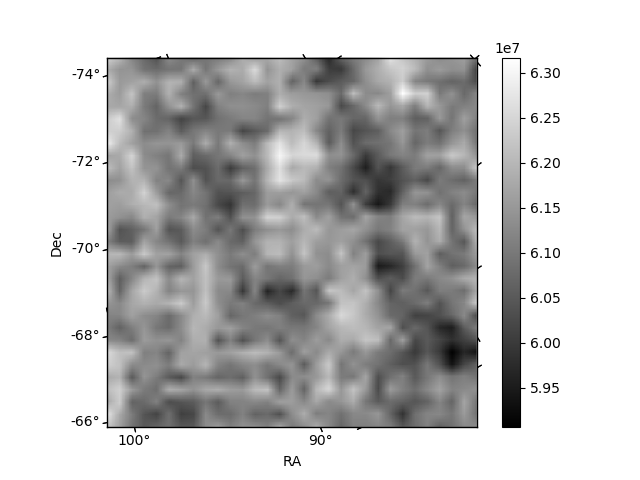
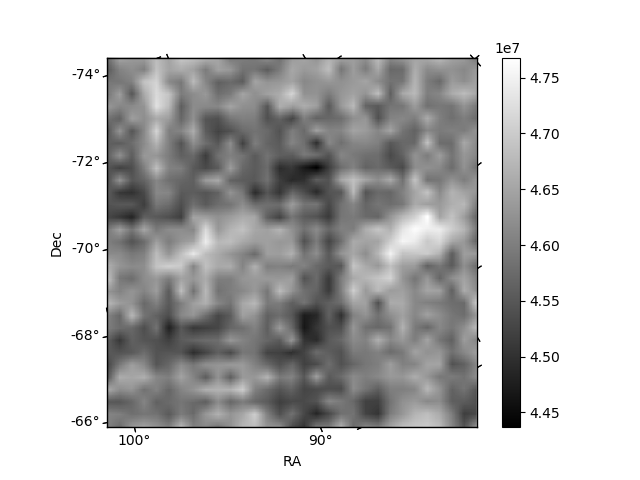
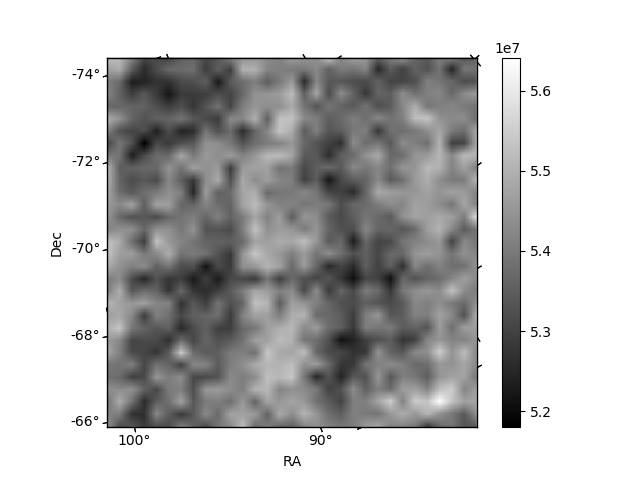
Histogram calculated using DETX and DETY for each event in the final _common_clean file
| Quadrant A | 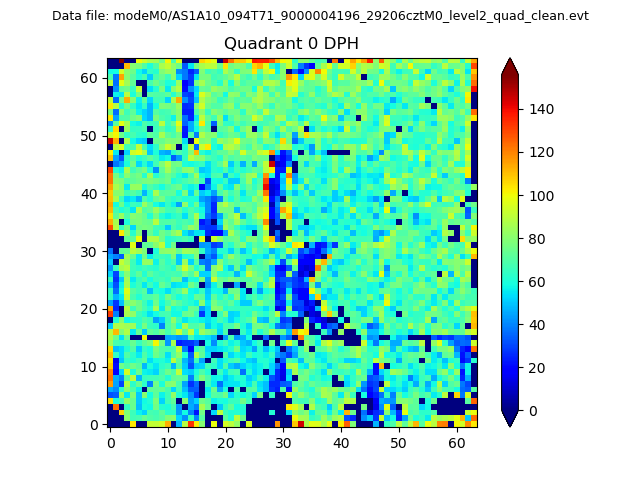 |
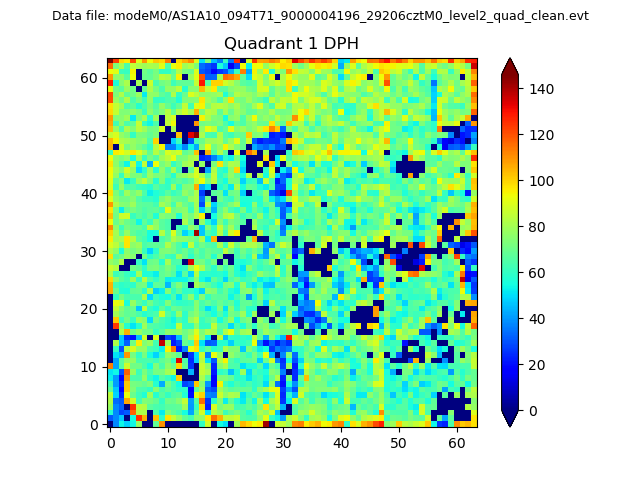 |
Quadrant B |
|---|---|---|---|
| Quadrant D | 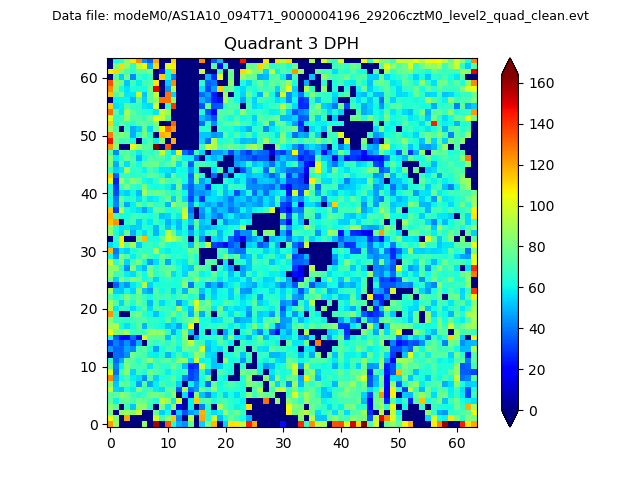 |
 |
Quadrant C |
| Plot type | Count rate plots | Images |
|---|---|---|
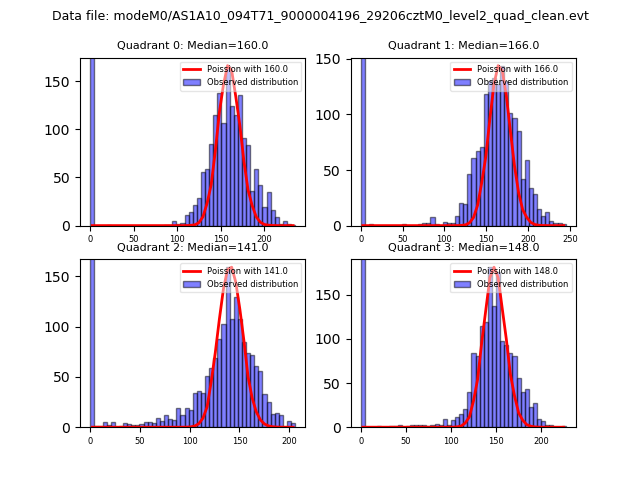
| Comparison with Poisson distribution Blue bars denote a histogram of data divided into 1 sec bins. Red curve is a Poisson curve with rate = median count rate of data. |
 |
 |
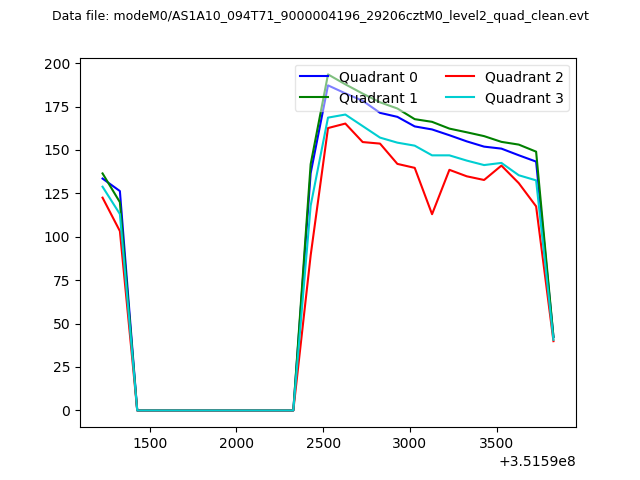
| Quadrant-wise count rates Data is divided into 100 sec bins |
 |
|
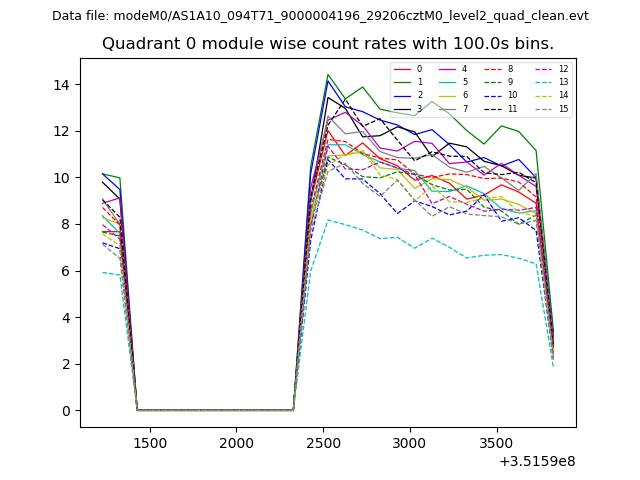
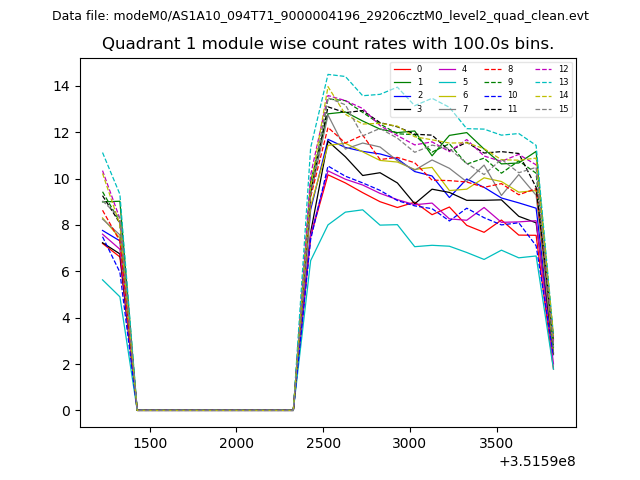
| Module-wise count rates for Quadrant A Data is divided into 100 sec bins |
 |
 |
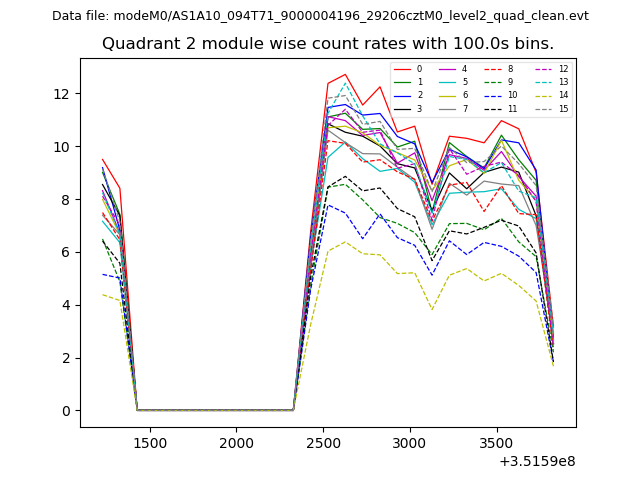
| Module-wise count rates for Quadrant B Data is divided into 100 sec bins |
 |
 |
| Module-wise count rates for Quadrant C Data is divided into 100 sec bins |
 |
 |
| Module-wise count rates for Quadrant D Data is divided into 100 sec bins |
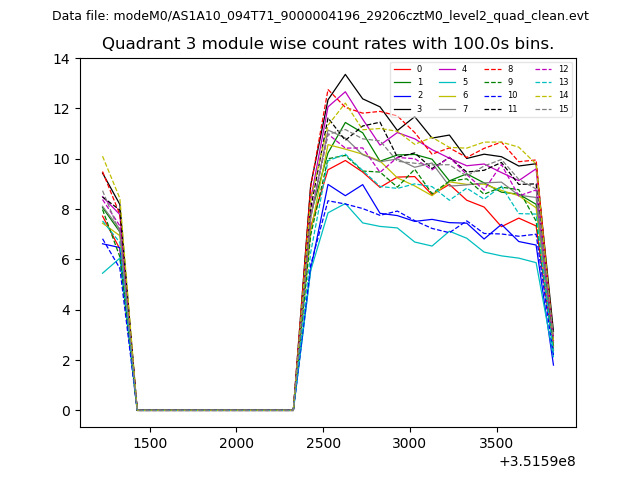 |
 |
| Parameter | Plot |
|---|---|
| CZT HV Monitor | 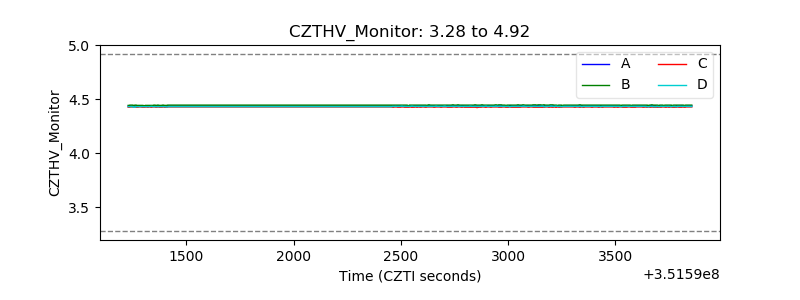 |
| D_VDD | 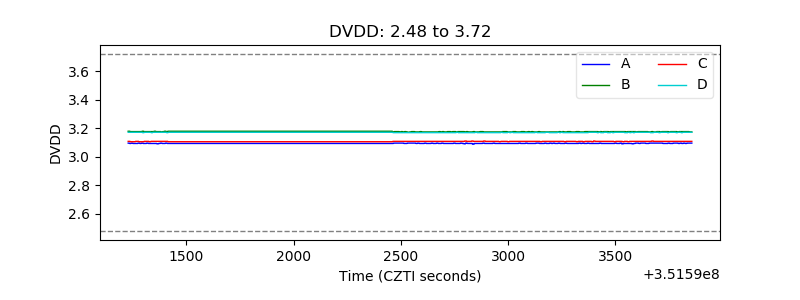 |
| Temperature 1 | 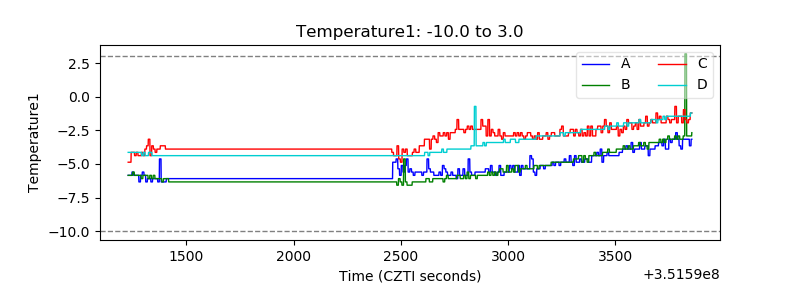 |
| Veto HV Monitor |  |
| Veto LLD | 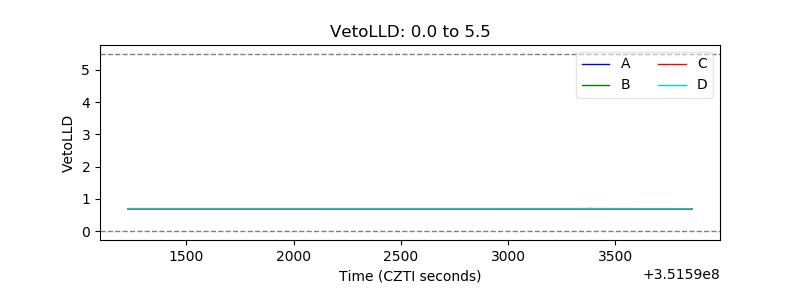 |
| Alpha Counter | 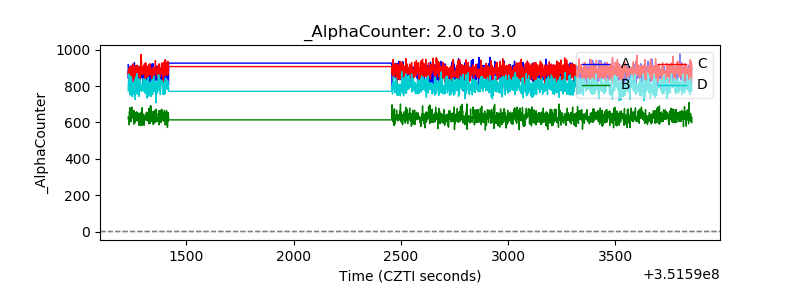 |
| _CPM_Rate | 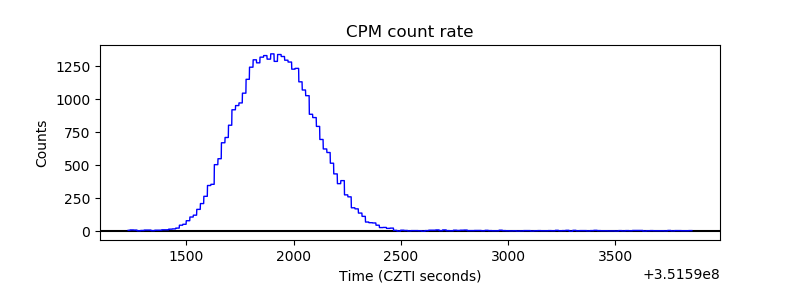 |
| CZT Counter | 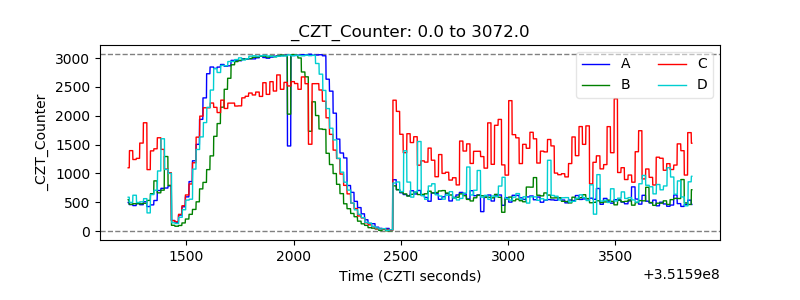 |
| +2.5 Volts monitor |  |
| +5 Volts monitor |  |
| _ROLL_ROT | 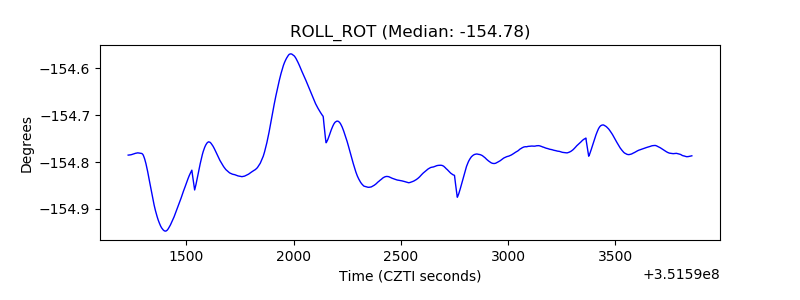 |
| _Roll_DEC | 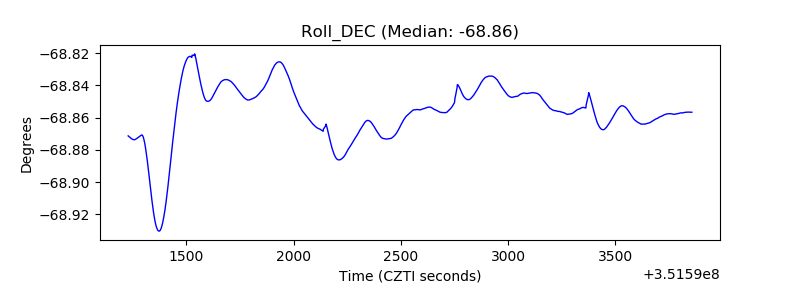 |
| _Roll_RA | 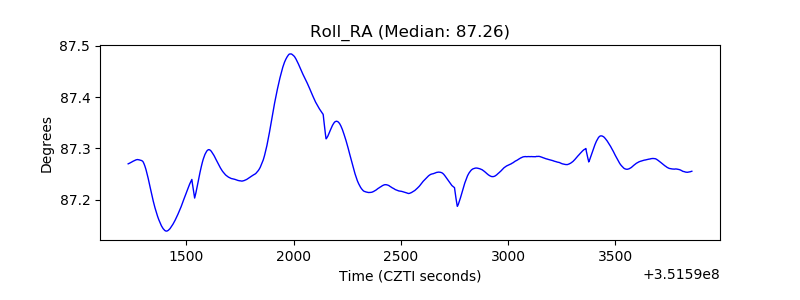 |
| Veto Counter | 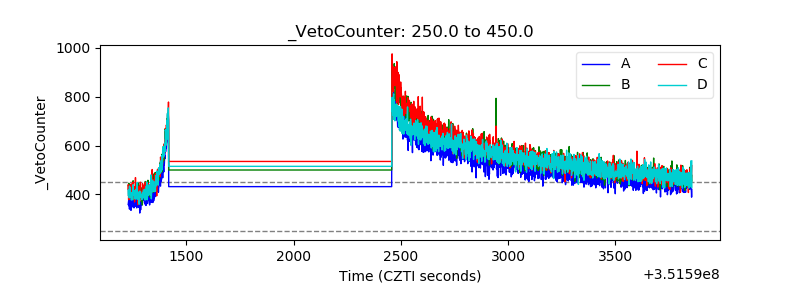 |