| Param | Original file | Final file |
|---|---|---|
| Filename | modeM0/AS1A10_094T71_9000004196_29208cztM0_level2.evt | modeM0/AS1A10_094T71_9000004196_29208cztM0_level2_quad_clean.evt |
| Size (bytes) | 502,606,080 | 93,902,400 |
| Size | 479.3 MB | 89.6 MB |
| Events in quadrant A | 2,235,537 | 659,122 |
| Events in quadrant B | 2,537,113 | 665,696 |
| Events in quadrant C | 6,092,856 | 587,597 |
| Events in quadrant D | 4,038,111 | 601,329 |
| Mode SS | |||
|---|---|---|---|
| Quadrant | BADHDUFLAG | Total packets | Discarded packets |
| A | 0 | 94 | 0 |
| B | 0 | 94 | 0 |
| C | 0 | 94 | 0 |
| D | 0 | 94 | 0 |
| Mode M0 | |||
|---|---|---|---|
| Quadrant | BADHDUFLAG | Total packets | Discarded packets |
| A | 0 | 9626 | 0 |
| B | 0 | 10455 | 0 |
| C | 0 | 21459 | 0 |
| D | 0 | 15184 | 0 |
| Quadrant | Total seconds | Saturated seconds | Saturation percentage |
|---|---|---|---|
| A | 4694 | 3 | 0.063911% |
| B | 4695 | 37 | 0.788072% |
| C | 4695 | 752 | 16.017039% |
| D | 4695 | 263 | 5.601704% |
Noise dominated data is calculated using 1-second bins in cleaned event files. If a bin has >2000 counts, and if more than 50% of those come from <1% of pixels, then it is considered to be noise-dominated and hence unusable.
| Quadrant | # 1 sec bins | Bins with >0 counts | Bins with >2000 counts | High rate bins dominated by noise | Noise dominated (total time) | Noise dominated (detector-on time) | Marked lightcurve |
|---|---|---|---|---|---|---|---|
| A | 4694 | 4694 | 0 | 0 | 0.00% | 0.00% | 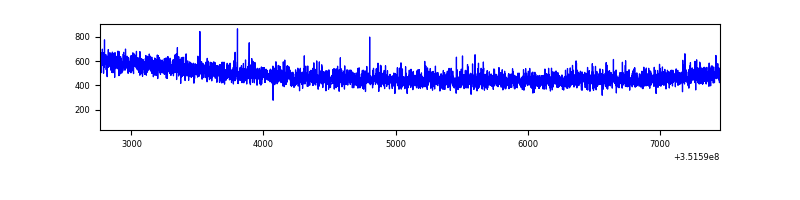 |
| B | 4695 | 4695 | 21 | 21 | 0.45% | 0.45% | 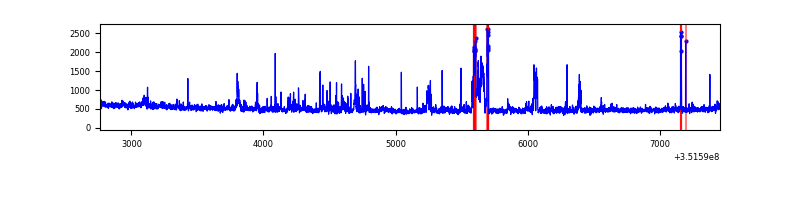 |
| C | 4695 | 4695 | 408 | 408 | 8.69% | 8.69% | 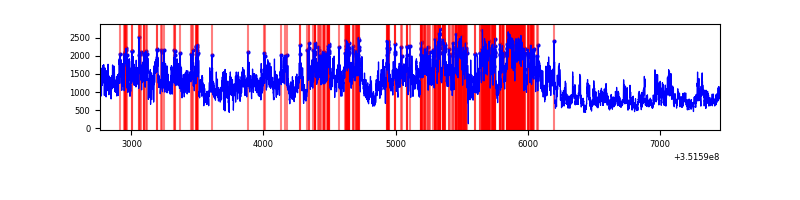 |
| D | 4695 | 4695 | 230 | 230 | 4.90% | 4.90% | 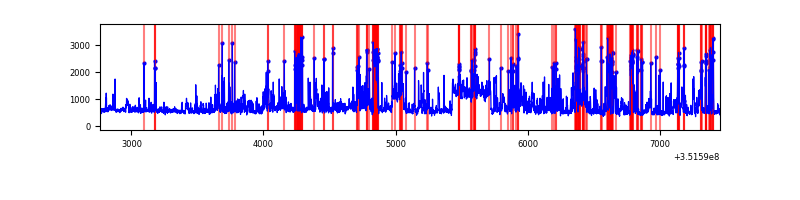 |
Top three noisy pixels from each quadrant. If the there are fewer than three noisy pixels in the level2.evt file, extra rows are filled as -1
| Pixel properties | Quadrant properties | ||||||
|---|---|---|---|---|---|---|---|
| Quadrant | DetID | PixID | Counts | Sigma | Mean | Median | Sigma |
| A | 0 | 13 | 13840 | 116.61 | 575 | 564 | 113.8 |
| A | 13 | 254 | 9478 | 78.3 | 575 | 564 | 113.8 |
| A | 3 | 137 | 5216 | 40.86 | 575 | 564 | 113.8 |
| B | 0 | 229 | 193384 | 1790.12 | 568 | 555 | 107.7 |
| B | 0 | 183 | 67843 | 624.67 | 568 | 555 | 107.7 |
| B | 10 | 245 | 40010 | 366.28 | 568 | 555 | 107.7 |
| C | 3 | 233 | 3887087 | 32087.97 | 524 | 528 | 121.1 |
| C | 14 | 238 | 111348 | 914.95 | 524 | 528 | 121.1 |
| C | 14 | 254 | 41133 | 335.24 | 524 | 528 | 121.1 |
| D | 1 | 52 | 1174482 | 9134.04 | 541 | 527 | 128.5 |
| D | 8 | 195 | 741266 | 5763.38 | 541 | 527 | 128.5 |
| D | 2 | 250 | 41887 | 321.8 | 541 | 527 | 128.5 |
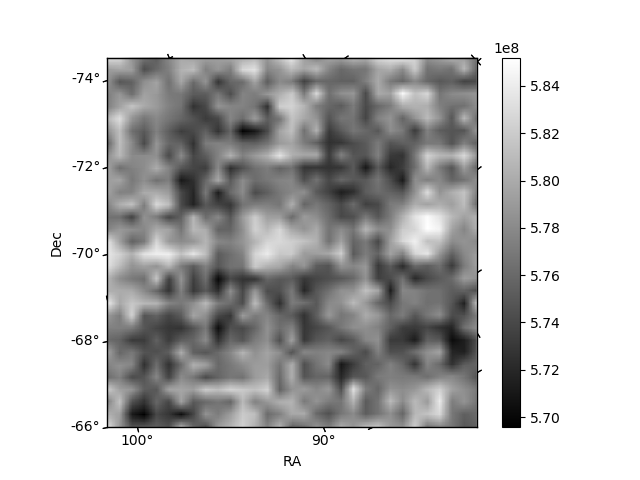
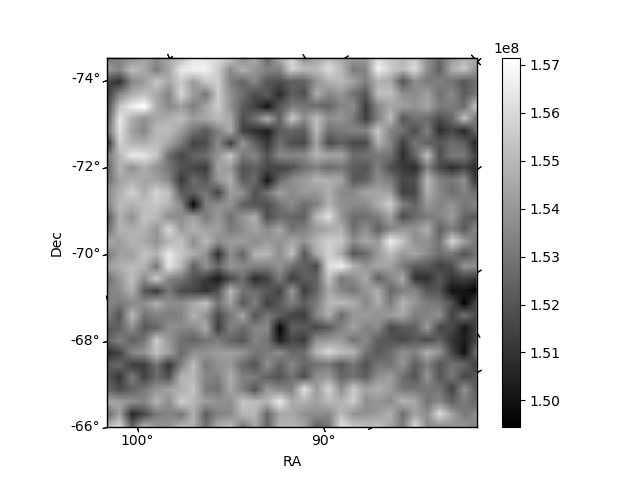
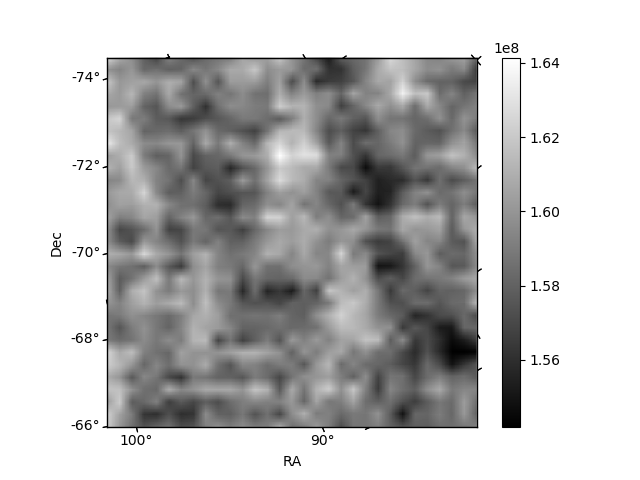
Histogram calculated using DETX and DETY for each event in the final _common_clean file
| Quadrant A | 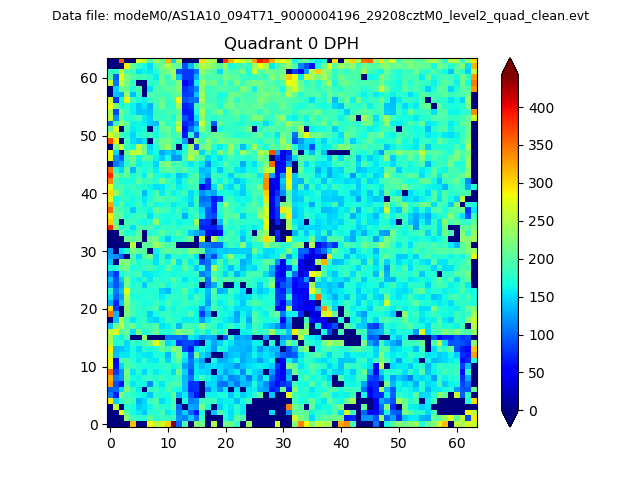 |
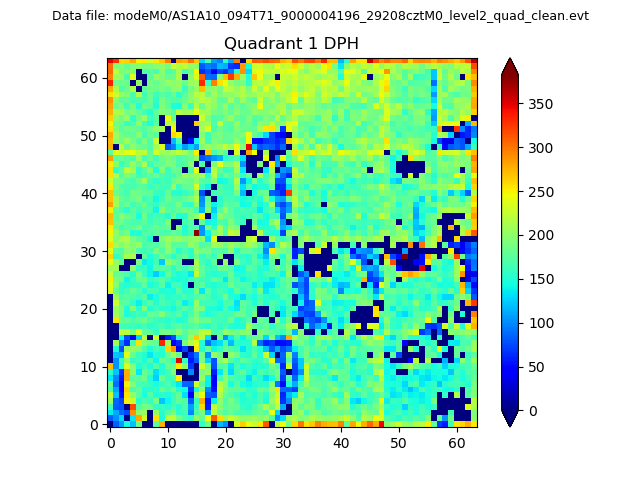 |
Quadrant B |
|---|---|---|---|
| Quadrant D |  |
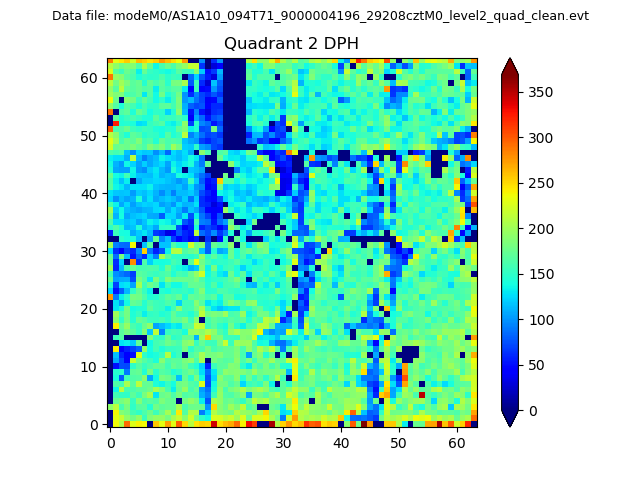 |
Quadrant C |
| Plot type | Count rate plots | Images |
|---|---|---|
| Comparison with Poisson distribution Blue bars denote a histogram of data divided into 1 sec bins. Red curve is a Poisson curve with rate = median count rate of data. |
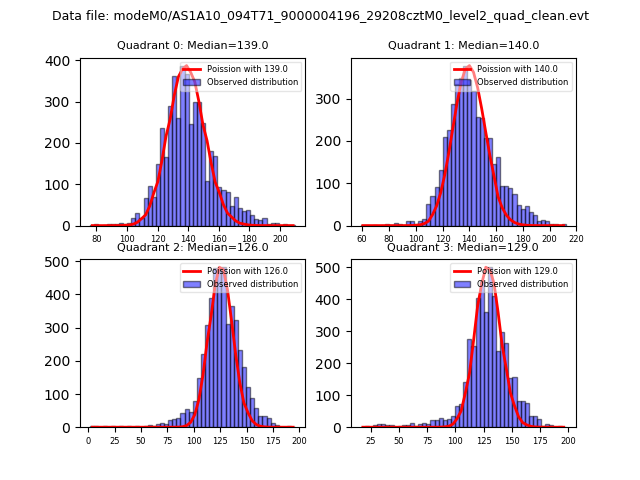 |
 |
| Quadrant-wise count rates Data is divided into 100 sec bins |
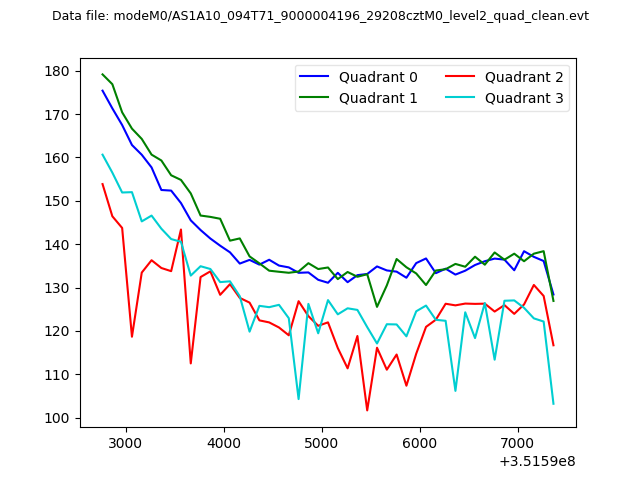 |
|
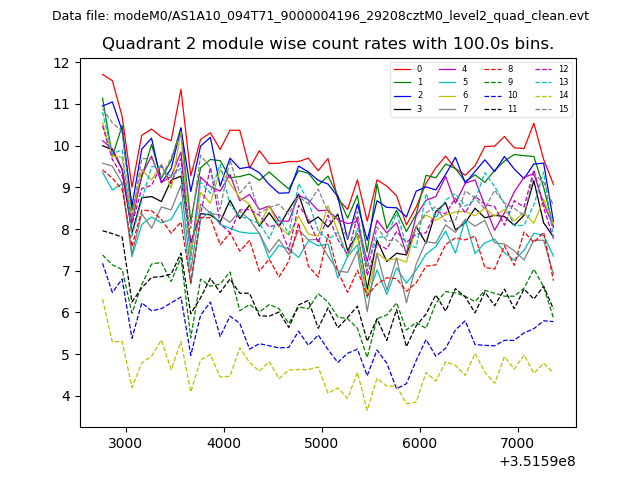
| Module-wise count rates for Quadrant A Data is divided into 100 sec bins |
 |
 |
| Module-wise count rates for Quadrant B Data is divided into 100 sec bins |
 |
 |
| Module-wise count rates for Quadrant C Data is divided into 100 sec bins |
 |
 |
| Module-wise count rates for Quadrant D Data is divided into 100 sec bins |
 |
 |
| Parameter | Plot |
|---|---|
| CZT HV Monitor | 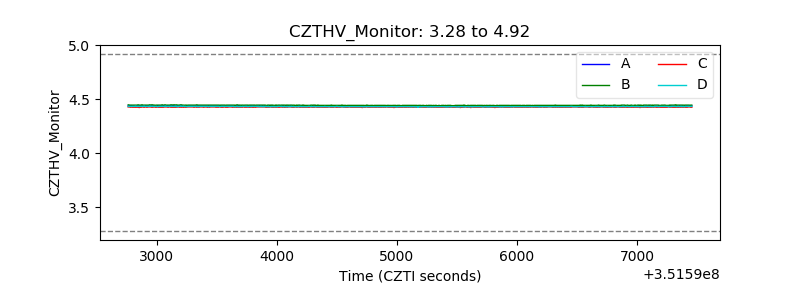 |
| D_VDD | 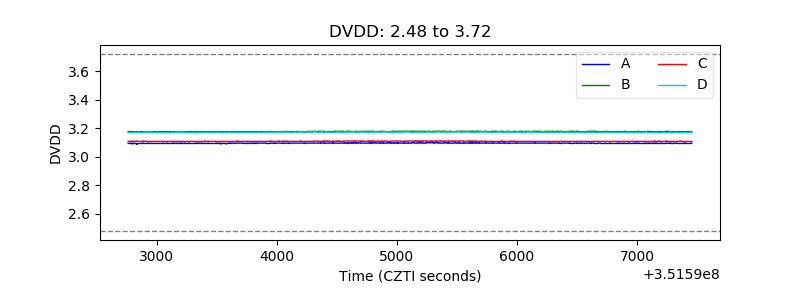 |
| Temperature 1 | 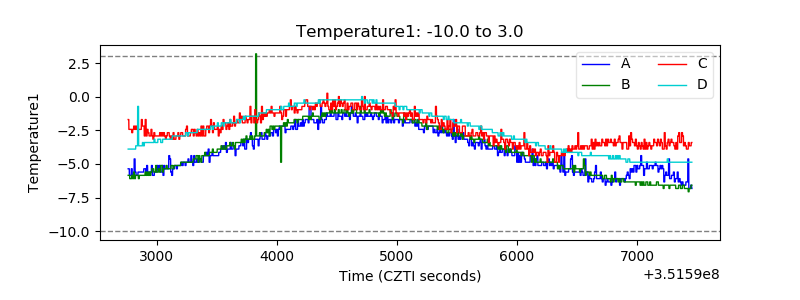 |
| Veto HV Monitor | 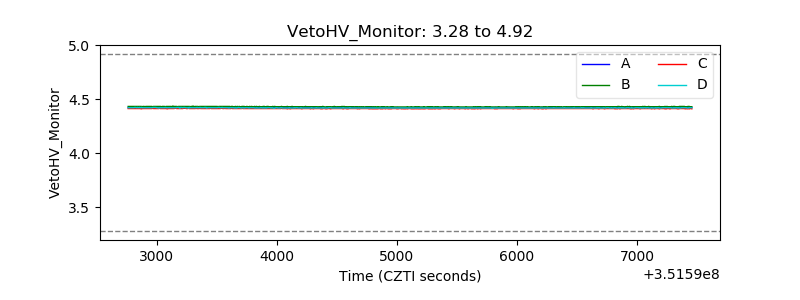 |
| Veto LLD | 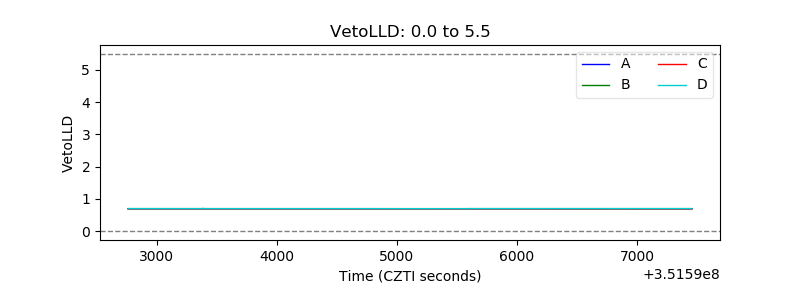 |
| Alpha Counter | 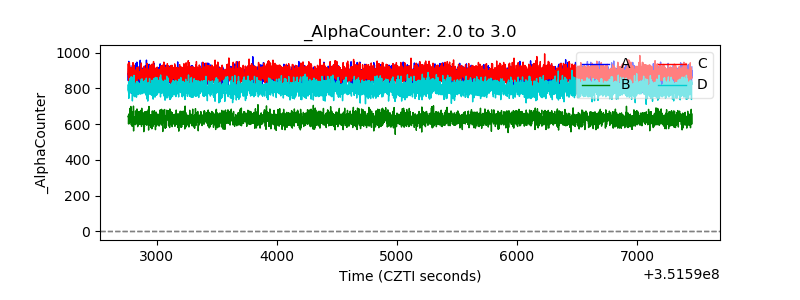 |
| _CPM_Rate | 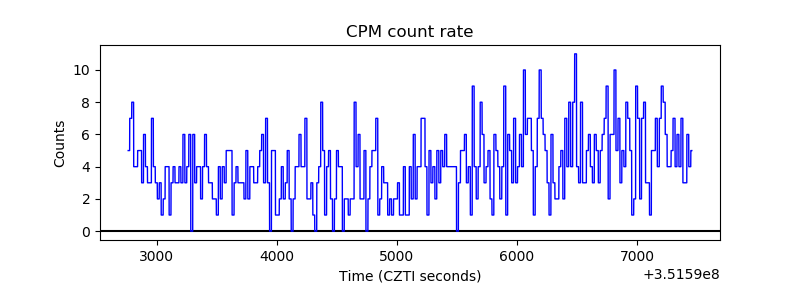 |
| CZT Counter | 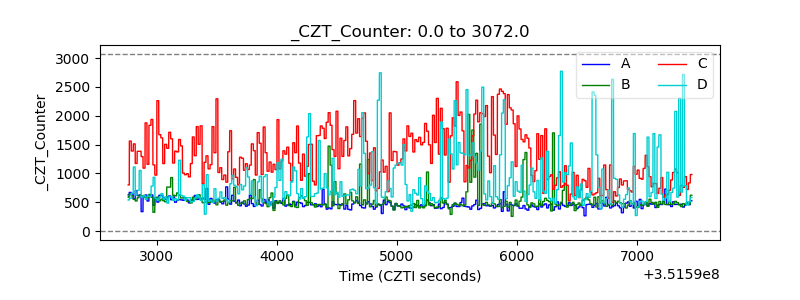 |
| +2.5 Volts monitor | 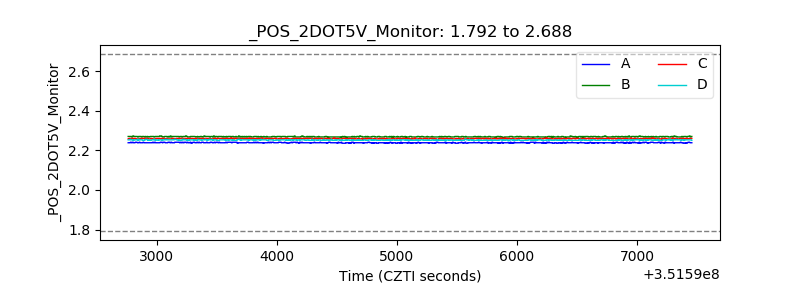 |
| +5 Volts monitor | 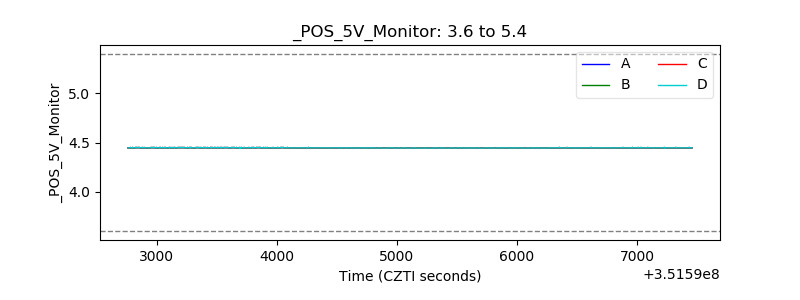 |
| _ROLL_ROT |  |
| _Roll_DEC | 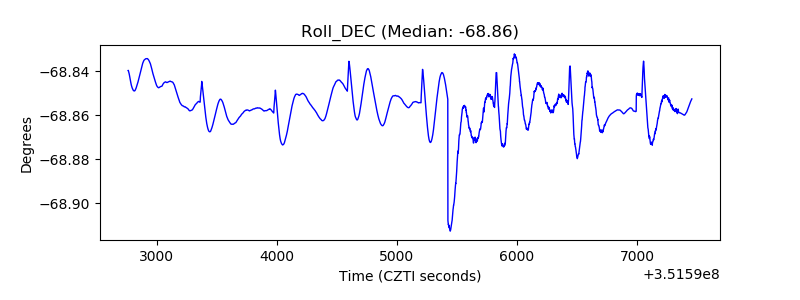 |
| _Roll_RA | 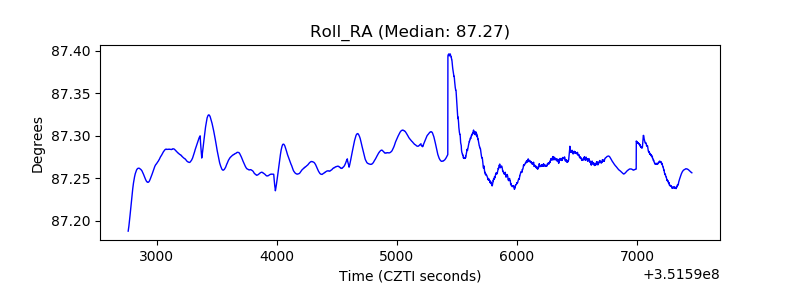 |
| Veto Counter | 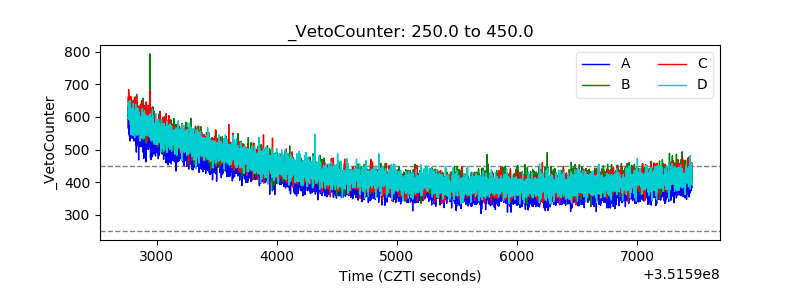 |