| Param | Original file | Final file |
|---|---|---|
| Filename | modeM0/AS1A10_102T02_9000004200cztM0_level2.fits | modeM0/AS1A10_102T02_9000004200cztM0_level2_quad_clean.evt |
| Size (bytes) | 897,445,440 | 904,579,200 |
| Size | 855.9 MB | 862.7 MB |
| Events in quadrant A | 5,647,844 | 5,612,915 |
| Events in quadrant B | 5,326,502 | 5,585,684 |
| Events in quadrant C | 5,434,040 | 5,341,771 |
| Events in quadrant D | 4,646,570 | 4,735,123 |
| Mode SS | |||
|---|---|---|---|
| Quadrant | BADHDUFLAG | Total packets | Discarded packets |
| A | 0 | 1824 | 0 |
| B | 0 | 1824 | 0 |
| C | 0 | 1824 | 0 |
| D | 0 | 1824 | 0 |
| Mode M0 | |||
|---|---|---|---|
| Quadrant | BADHDUFLAG | Total packets | Discarded packets |
| A | 0 | 187870 | 0 |
| B | 0 | 207958 | 0 |
| C | 0 | 235533 | 0 |
| D | 0 | 282135 | 0 |
| Mode M9 | |||
|---|---|---|---|
| Quadrant | BADHDUFLAG | Total packets | Discarded packets |
| A | 0 | 155 | 0 |
| B | 0 | 155 | 0 |
| C | 0 | 155 | 0 |
| D | 0 | 155 | 0 |
| Quadrant | Total seconds | Saturated seconds | Saturation percentage |
|---|---|---|---|
| A | 89262 | 1101 | 1.233448% |
| B | 89262 | 2257 | 2.528512% |
| C | 89262 | 4292 | 4.808317% |
| D | 89262 | 7900 | 8.850351% |
Noise dominated data is calculated using 1-second bins in cleaned event files. If a bin has >2000 counts, and if more than 50% of those come from <1% of pixels, then it is considered to be noise-dominated and hence unusable.
| Quadrant | # 1 sec bins | Bins with >0 counts | Bins with >2000 counts | High rate bins dominated by noise | Noise dominated (total time) | Noise dominated (detector-on time) | Marked lightcurve |
|---|---|---|---|---|---|---|---|
| A | 104932 | 89261 | 0 | 0 | 0.00% | 0.00% |  |
| B | 104932 | 89263 | 0 | 0 | 0.00% | 0.00% |  |
| C | 104932 | 89263 | 0 | 0 | 0.00% | 0.00% | 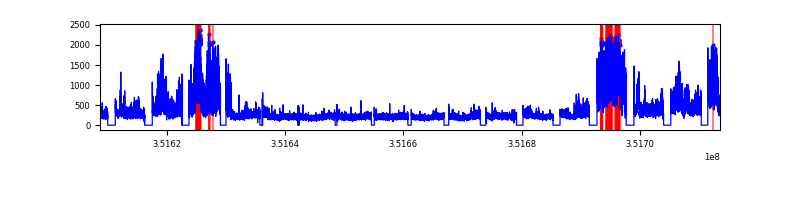 |
| D | 104932 | 89021 | 0 | 0 | 0.00% | 0.00% |  |
Top three noisy pixels from each quadrant. If the there are fewer than three noisy pixels in the level2.evt file, extra rows are filled as -1
| Pixel properties | Quadrant properties | ||||||
|---|---|---|---|---|---|---|---|
| Quadrant | DetID | PixID | Counts | Sigma | Mean | Median | Sigma |
| A | 0 | 29 | 4597 | 9.14 | 1473 | 1398 | 350.0 |
| A | 7 | 110 | 4351 | 8.44 | 1473 | 1398 | 350.0 |
| A | 9 | 19 | 4280 | 8.23 | 1473 | 1398 | 350.0 |
| B | 2 | 9 | 4357 | 10.95 | 1411 | 1354 | 274.4 |
| B | 2 | 8 | 3601 | 8.19 | 1411 | 1354 | 274.4 |
| B | 5 | 128 | 3517 | 7.88 | 1411 | 1354 | 274.4 |
| C | 1 | 81 | 4169 | 7.86 | 1433 | 1353 | 358.3 |
| C | 1 | 80 | 4124 | 7.73 | 1433 | 1353 | 358.3 |
| C | 12 | 241 | 3771 | 6.75 | 1433 | 1353 | 358.3 |
| D | 15 | 46 | 3544 | 6.74 | 1327 | 1216 | 345.2 |
| D | 10 | 189 | 3358 | 6.2 | 1327 | 1216 | 345.2 |
| D | 7 | 3 | 3263 | 5.93 | 1327 | 1216 | 345.2 |
Histogram calculated using DETX and DETY for each event in the final _common_clean file
| Quadrant A |  |
 |
Quadrant B |
|---|---|---|---|
| Quadrant D |  |
 |
Quadrant C |
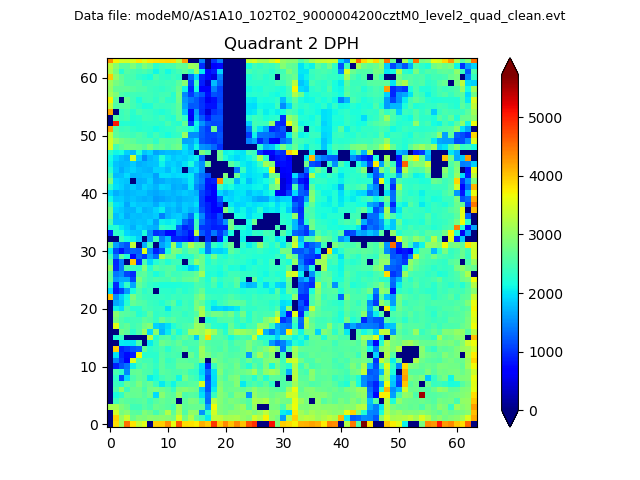
| Plot type | Count rate plots | Images |
|---|---|---|
| Comparison with Poisson distribution Blue bars denote a histogram of data divided into 1 sec bins. Red curve is a Poisson curve with rate = median count rate of data. |
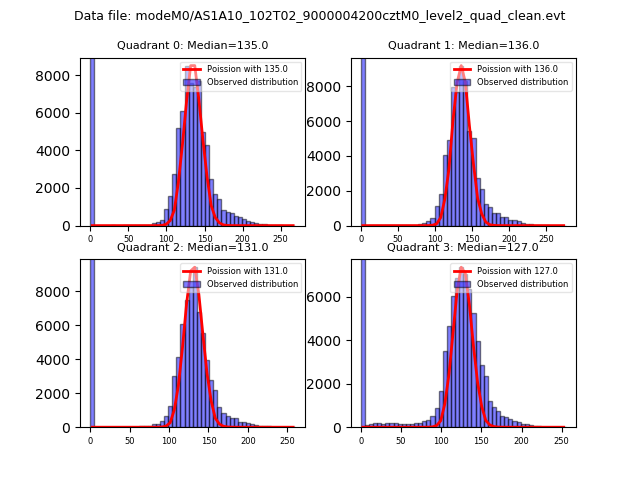 |
 |
| Quadrant-wise count rates Data is divided into 100 sec bins |
 |
|
| Module-wise count rates for Quadrant A Data is divided into 100 sec bins |
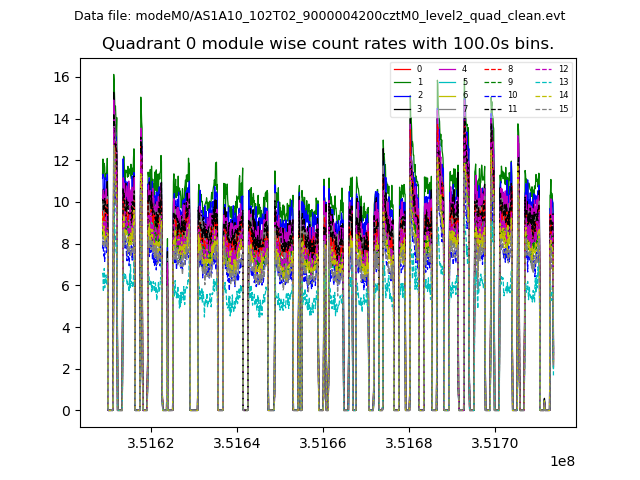 |
 |
| Module-wise count rates for Quadrant B Data is divided into 100 sec bins |
 |
 |
| Module-wise count rates for Quadrant C Data is divided into 100 sec bins |
 |
 |
| Module-wise count rates for Quadrant D Data is divided into 100 sec bins |
 |
 |
| Parameter | Plot |
|---|---|
| CZT HV Monitor |  |
| D_VDD |  |
| Temperature 1 |  |
| Veto HV Monitor |  |
| Veto LLD |  |
| Alpha Counter |  |
| _CPM_Rate |  |
| CZT Counter |  |
| +2.5 Volts monitor |  |
| +5 Volts monitor |  |
| _ROLL_ROT |  |
| _Roll_DEC |  |
| _Roll_RA |  |
| Veto Counter |  |