| Param | Original file | Final file |
|---|---|---|
| Filename | modeM0/AS1A10_102T02_9000004200_29211cztM0_level2.evt | modeM0/AS1A10_102T02_9000004200_29211cztM0_level2_quad_clean.evt |
| Size (bytes) | 541,710,720 | 82,224,000 |
| Size | 516.6 MB | 78.4 MB |
| Events in quadrant A | 3,151,558 | 535,543 |
| Events in quadrant B | 3,356,100 | 538,999 |
| Events in quadrant C | 3,869,274 | 521,505 |
| Events in quadrant D | 5,634,084 | 486,545 |
| Mode SS | |||
|---|---|---|---|
| Quadrant | BADHDUFLAG | Total packets | Discarded packets |
| A | 0 | 118 | 0 |
| B | 0 | 118 | 0 |
| C | 0 | 118 | 0 |
| D | 0 | 118 | 0 |
| Mode M0 | |||
|---|---|---|---|
| Quadrant | BADHDUFLAG | Total packets | Discarded packets |
| A | 0 | 12923 | 1 |
| B | 0 | 13619 | 1 |
| C | 0 | 15394 | 1 |
| D | 0 | 20858 | 1 |
| Mode M9 | |||
|---|---|---|---|
| Quadrant | BADHDUFLAG | Total packets | Discarded packets |
| A | 0 | 13 | 0 |
| B | 0 | 13 | 0 |
| C | 0 | 13 | 0 |
| D | 0 | 13 | 0 |
| Quadrant | Total seconds | Saturated seconds | Saturation percentage |
|---|---|---|---|
| A | 5827 | 109 | 1.870602% |
| B | 5828 | 134 | 2.299245% |
| C | 5828 | 186 | 3.191489% |
| D | 5828 | 764 | 13.109128% |
Noise dominated data is calculated using 1-second bins in cleaned event files. If a bin has >2000 counts, and if more than 50% of those come from <1% of pixels, then it is considered to be noise-dominated and hence unusable.
| Quadrant | # 1 sec bins | Bins with >0 counts | Bins with >2000 counts | High rate bins dominated by noise | Noise dominated (total time) | Noise dominated (detector-on time) | Marked lightcurve |
|---|---|---|---|---|---|---|---|
| A | 7112 | 5828 | 0 | 0 | 0.00% | 0.00% | 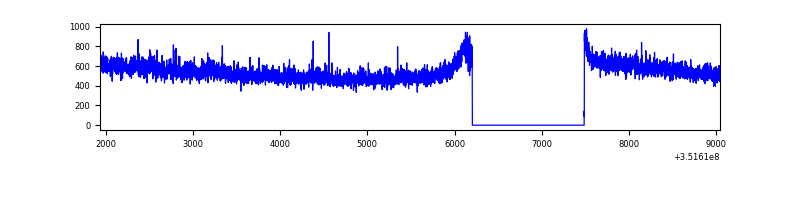 |
| B | 7113 | 5829 | 1 | 1 | 0.01% | 0.02% | 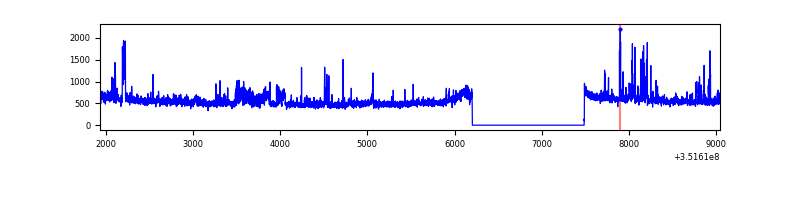 |
| C | 7113 | 5829 | 1 | 1 | 0.01% | 0.02% | 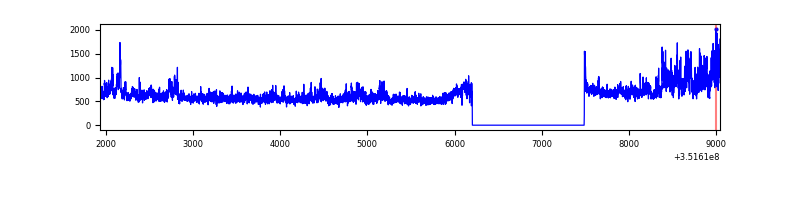 |
| D | 7113 | 5829 | 520 | 520 | 7.31% | 8.92% | 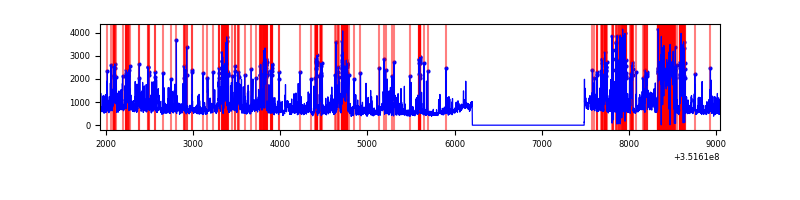 |
Top three noisy pixels from each quadrant. If the there are fewer than three noisy pixels in the level2.evt file, extra rows are filled as -1
| Pixel properties | Quadrant properties | ||||||
|---|---|---|---|---|---|---|---|
| Quadrant | DetID | PixID | Counts | Sigma | Mean | Median | Sigma |
| A | 0 | 13 | 99771 | 636.59 | 789 | 775 | 155.5 |
| A | 13 | 254 | 12094 | 72.79 | 789 | 775 | 155.5 |
| A | 3 | 137 | 6996 | 40.0 | 789 | 775 | 155.5 |
| B | 0 | 183 | 121330 | 839.99 | 778 | 759 | 143.5 |
| B | 10 | 245 | 67194 | 462.84 | 778 | 759 | 143.5 |
| B | 0 | 229 | 60754 | 417.97 | 778 | 759 | 143.5 |
| C | 3 | 233 | 759059 | 4394.34 | 760 | 766 | 172.6 |
| C | 14 | 238 | 127415 | 733.94 | 760 | 766 | 172.6 |
| C | 2 | 114 | 13968 | 76.51 | 760 | 766 | 172.6 |
| D | 1 | 52 | 2239636 | 13253.45 | 719 | 702 | 168.9 |
| D | 8 | 195 | 548658 | 3243.64 | 719 | 702 | 168.9 |
| D | 2 | 250 | 68036 | 398.59 | 719 | 702 | 168.9 |
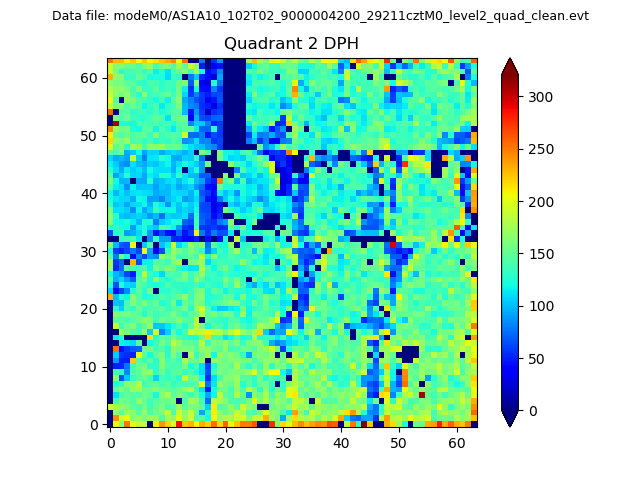
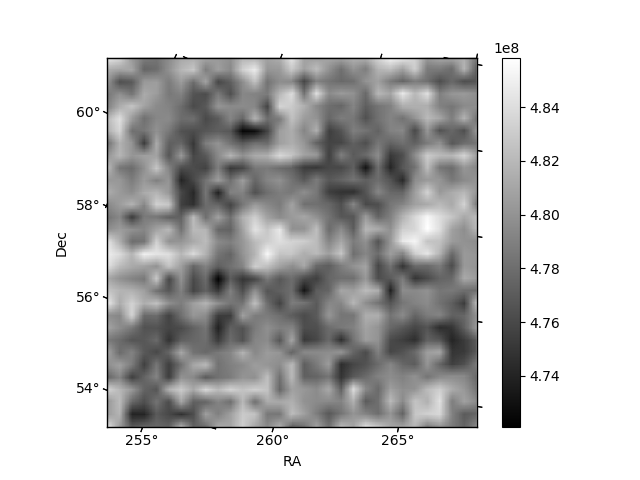
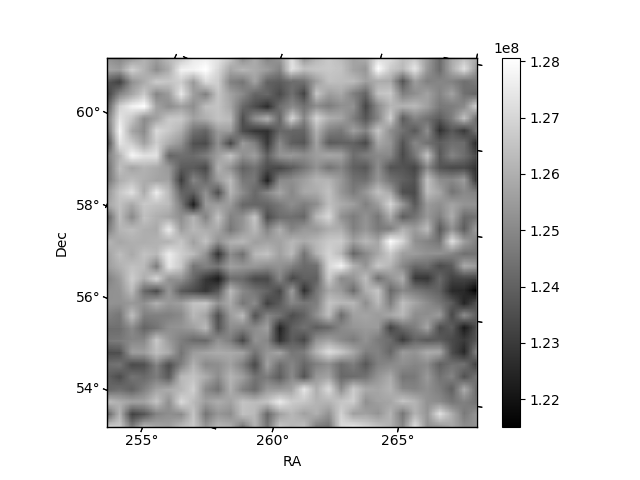
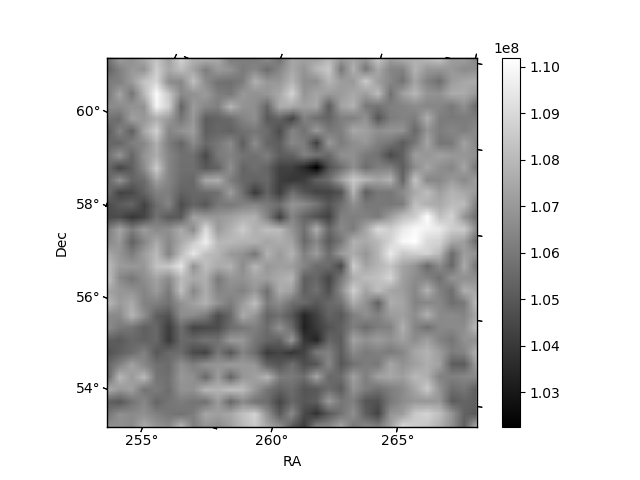
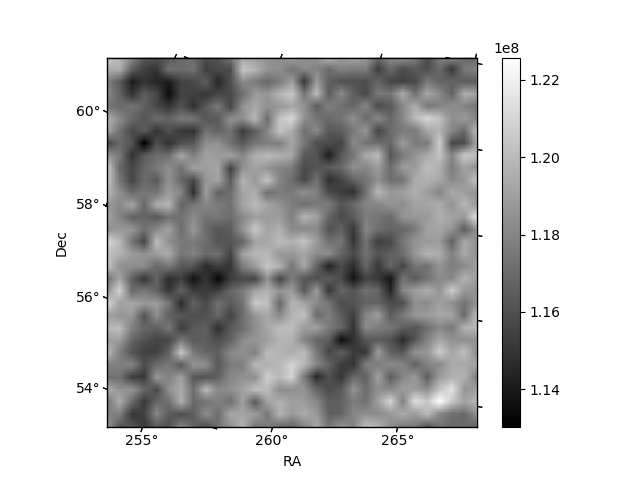
Histogram calculated using DETX and DETY for each event in the final _common_clean file
| Quadrant A | 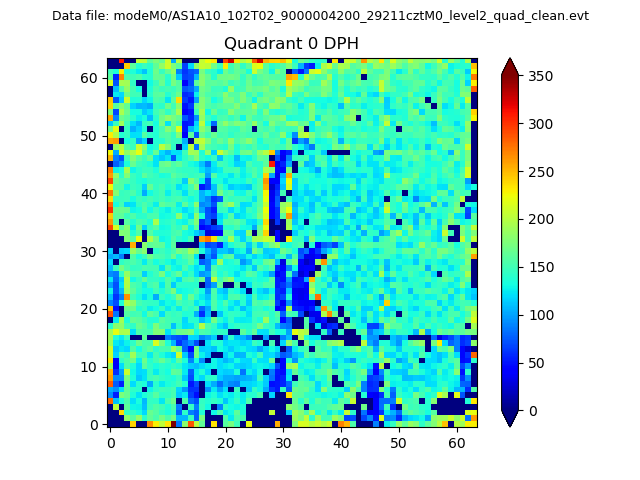 |
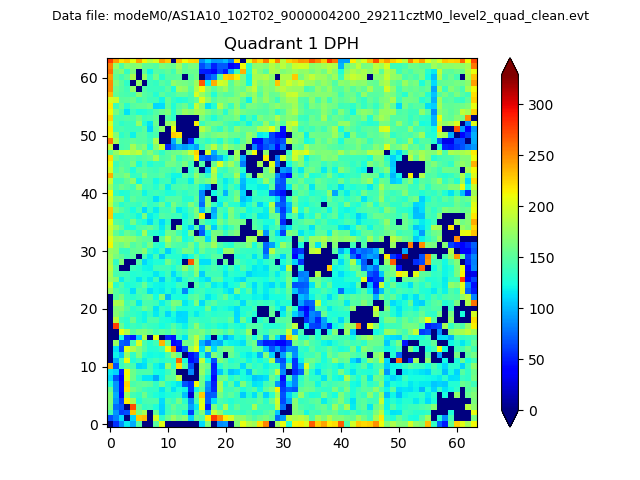 |
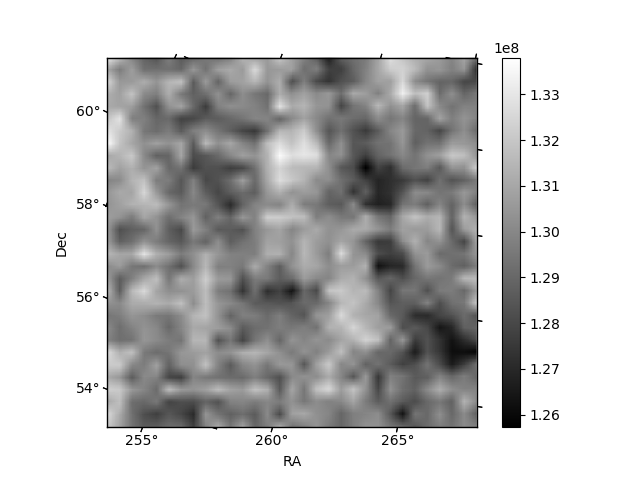
Quadrant B |
|---|---|---|---|
| Quadrant D | 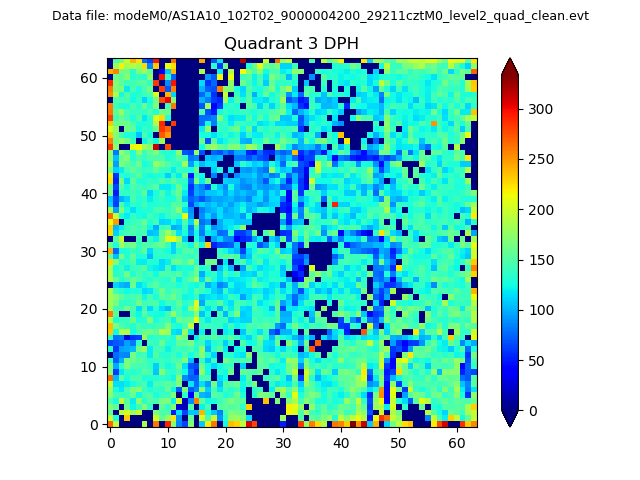 |
 |
Quadrant C |
| Plot type | Count rate plots | Images |
|---|---|---|
| Comparison with Poisson distribution Blue bars denote a histogram of data divided into 1 sec bins. Red curve is a Poisson curve with rate = median count rate of data. |
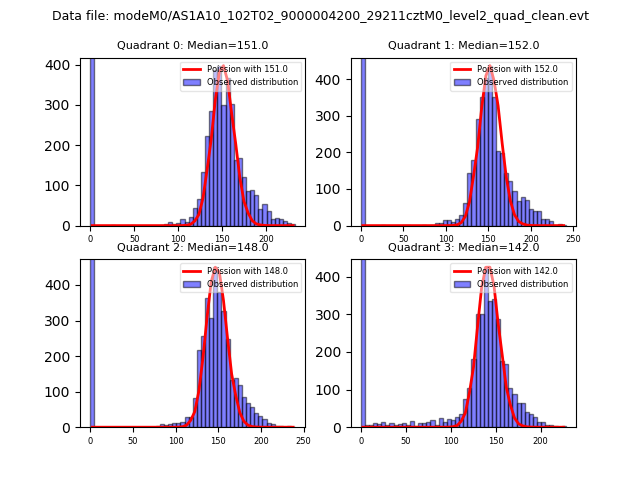 |
 |
| Quadrant-wise count rates Data is divided into 100 sec bins |
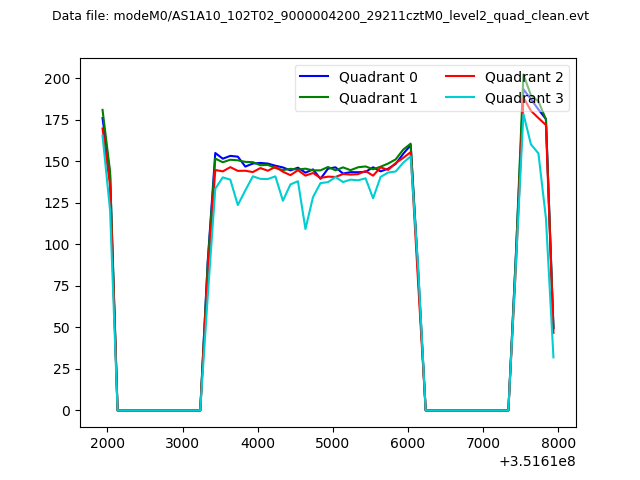 |
|
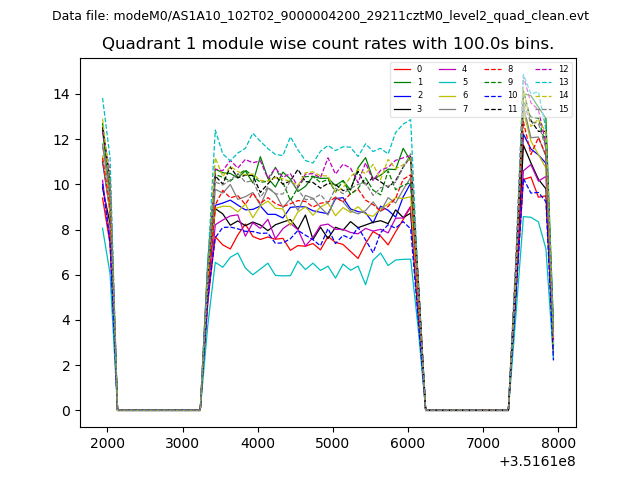
| Module-wise count rates for Quadrant A Data is divided into 100 sec bins |
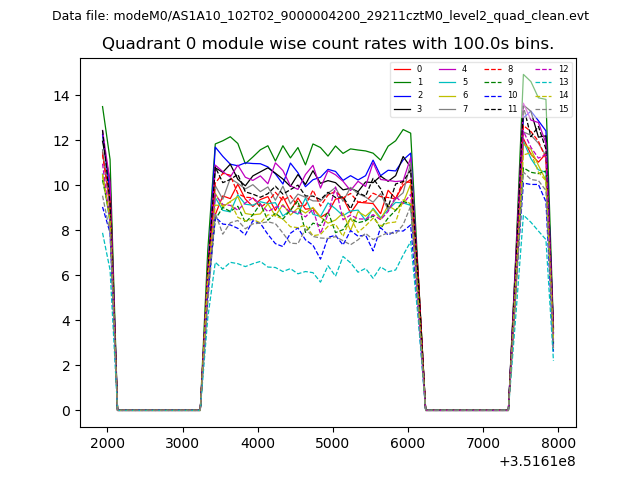 |
 |
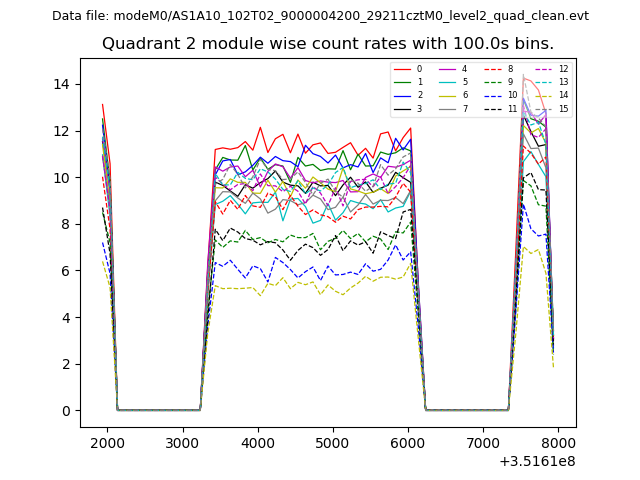
| Module-wise count rates for Quadrant B Data is divided into 100 sec bins |
 |
 |
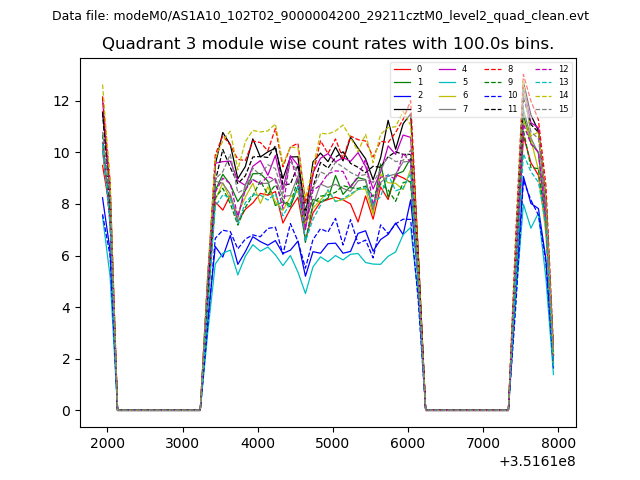
| Module-wise count rates for Quadrant C Data is divided into 100 sec bins |
 |
 |
| Module-wise count rates for Quadrant D Data is divided into 100 sec bins |
 |
 |
| Parameter | Plot |
|---|---|
| CZT HV Monitor | 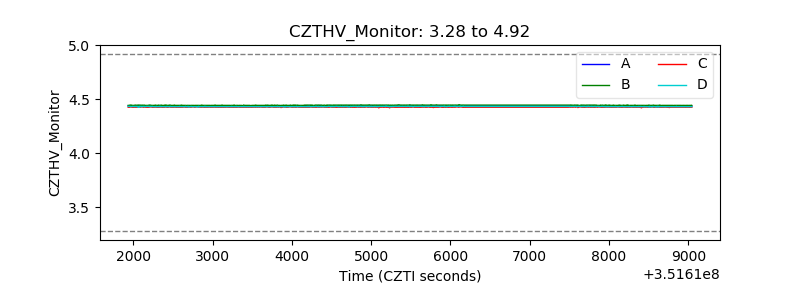 |
| D_VDD | 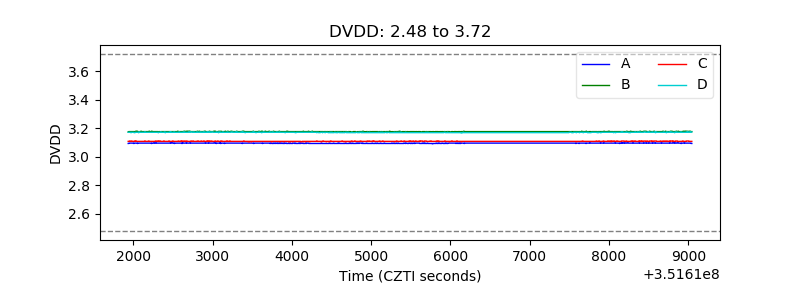 |
| Temperature 1 | 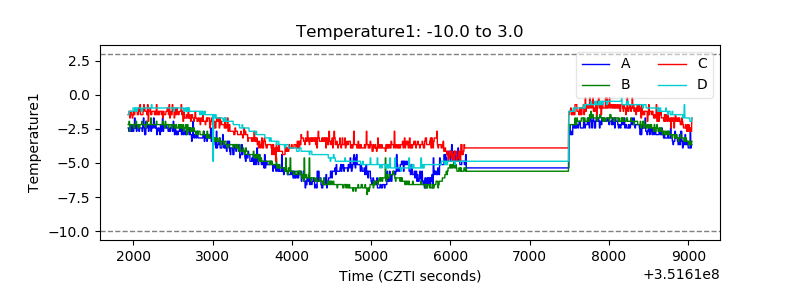 |
| Veto HV Monitor | 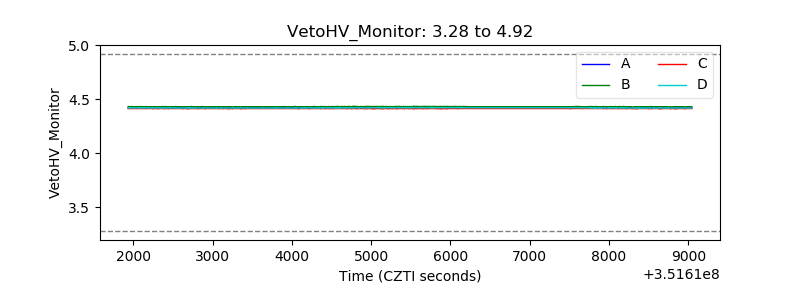 |
| Veto LLD | 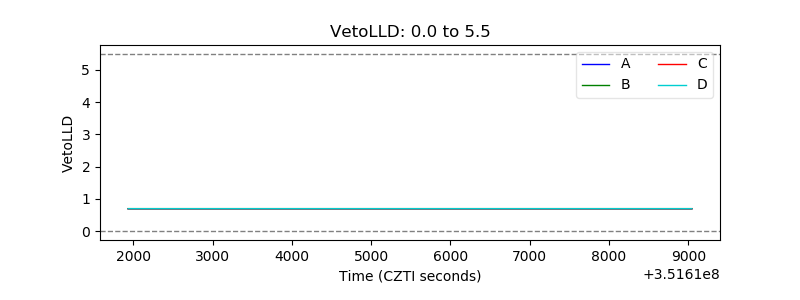 |
| Alpha Counter |  |
| _CPM_Rate | 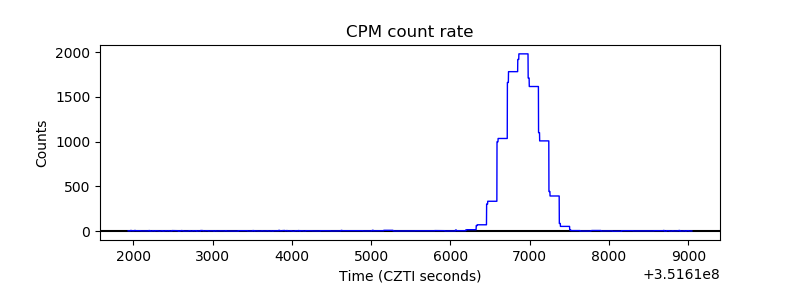 |
| CZT Counter | 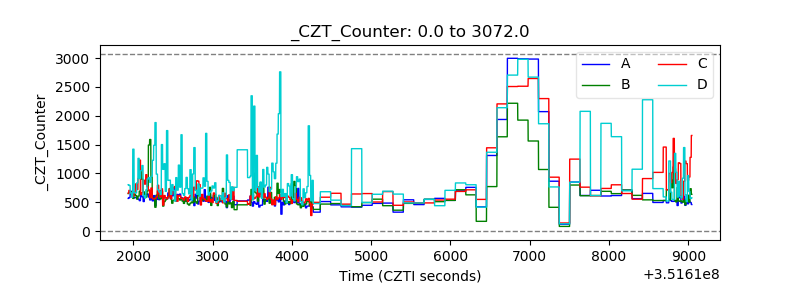 |
| +2.5 Volts monitor |  |
| +5 Volts monitor |  |
| _ROLL_ROT | 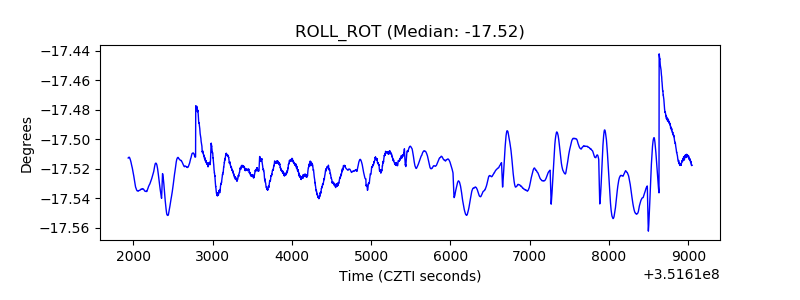 |
| _Roll_DEC | 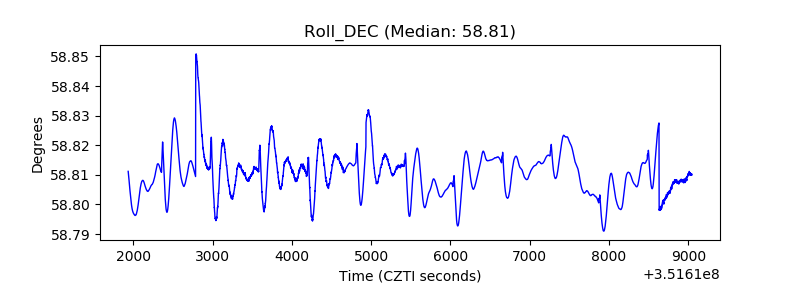 |
| _Roll_RA | 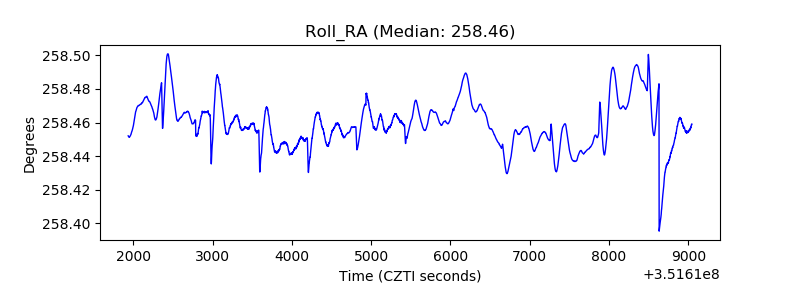 |
| Veto Counter | 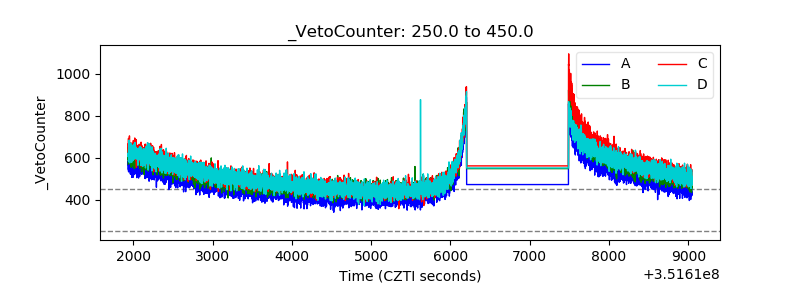 |