| Param | Original file | Final file |
|---|---|---|
| Filename | modeM0/AS1A10_102T02_9000004200_29212cztM0_level2.evt | modeM0/AS1A10_102T02_9000004200_29212cztM0_level2_quad_clean.evt |
| Size (bytes) | 583,911,360 | 81,869,760 |
| Size | 556.9 MB | 78.1 MB |
| Events in quadrant A | 3,153,359 | 523,727 |
| Events in quadrant B | 3,394,631 | 529,513 |
| Events in quadrant C | 5,321,661 | 504,273 |
| Events in quadrant D | 5,398,912 | 493,175 |
| Mode SS | |||
|---|---|---|---|
| Quadrant | BADHDUFLAG | Total packets | Discarded packets |
| A | 0 | 124 | 0 |
| B | 0 | 124 | 0 |
| C | 0 | 124 | 0 |
| D | 0 | 124 | 0 |
| Mode M0 | |||
|---|---|---|---|
| Quadrant | BADHDUFLAG | Total packets | Discarded packets |
| A | 0 | 13113 | 1 |
| B | 0 | 13799 | 1 |
| C | 0 | 20177 | 1 |
| D | 0 | 20221 | 2 |
| Mode M9 | |||
|---|---|---|---|
| Quadrant | BADHDUFLAG | Total packets | Discarded packets |
| A | 0 | 12 | 0 |
| B | 0 | 12 | 0 |
| C | 0 | 12 | 0 |
| D | 0 | 12 | 0 |
| Quadrant | Total seconds | Saturated seconds | Saturation percentage |
|---|---|---|---|
| A | 6135 | 108 | 1.760391% |
| B | 6136 | 170 | 2.770535% |
| C | 6136 | 508 | 8.279009% |
| D | 6135 | 747 | 12.176039% |
Noise dominated data is calculated using 1-second bins in cleaned event files. If a bin has >2000 counts, and if more than 50% of those come from <1% of pixels, then it is considered to be noise-dominated and hence unusable.
| Quadrant | # 1 sec bins | Bins with >0 counts | Bins with >2000 counts | High rate bins dominated by noise | Noise dominated (total time) | Noise dominated (detector-on time) | Marked lightcurve |
|---|---|---|---|---|---|---|---|
| A | 7305 | 6137 | 0 | 0 | 0.00% | 0.00% |  |
| B | 7306 | 6138 | 11 | 11 | 0.15% | 0.18% |  |
| C | 7306 | 6138 | 102 | 102 | 1.40% | 1.66% |  |
| D | 7305 | 6137 | 426 | 426 | 5.83% | 6.94% |  |
Top three noisy pixels from each quadrant. If the there are fewer than three noisy pixels in the level2.evt file, extra rows are filled as -1
| Pixel properties | Quadrant properties | ||||||
|---|---|---|---|---|---|---|---|
| Quadrant | DetID | PixID | Counts | Sigma | Mean | Median | Sigma |
| A | 0 | 13 | 25535 | 154.14 | 808 | 792 | 160.5 |
| A | 13 | 254 | 12768 | 74.61 | 808 | 792 | 160.5 |
| A | 3 | 137 | 7502 | 41.8 | 808 | 792 | 160.5 |
| B | 0 | 229 | 94610 | 636.78 | 798 | 779 | 147.4 |
| B | 10 | 245 | 71231 | 478.12 | 798 | 779 | 147.4 |
| B | 0 | 183 | 65876 | 441.78 | 798 | 779 | 147.4 |
| C | 3 | 233 | 2165024 | 12370.97 | 768 | 775 | 174.9 |
| C | 14 | 238 | 128771 | 731.63 | 768 | 775 | 174.9 |
| C | 2 | 114 | 14867 | 80.55 | 768 | 775 | 174.9 |
| D | 1 | 52 | 1818185 | 10315.06 | 742 | 722 | 176.2 |
| D | 8 | 195 | 595780 | 3377.27 | 742 | 722 | 176.2 |
| D | 2 | 250 | 40942 | 228.27 | 742 | 722 | 176.2 |
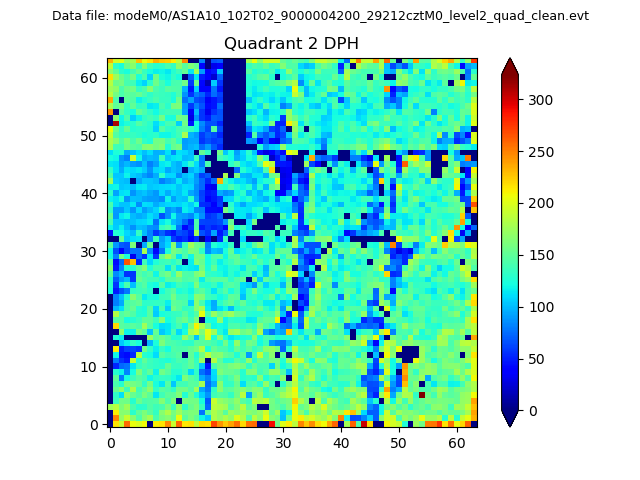
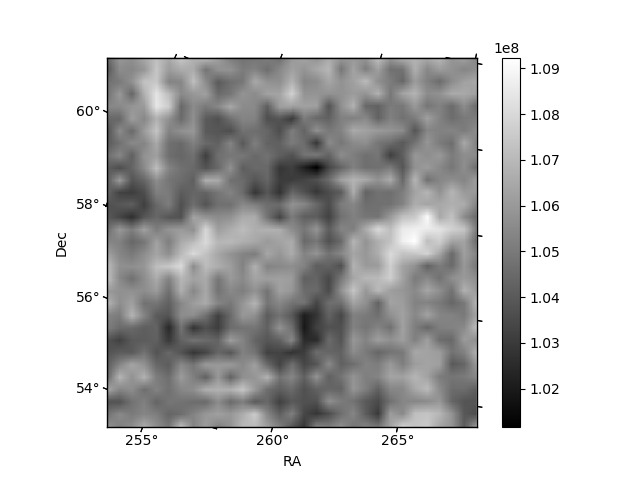
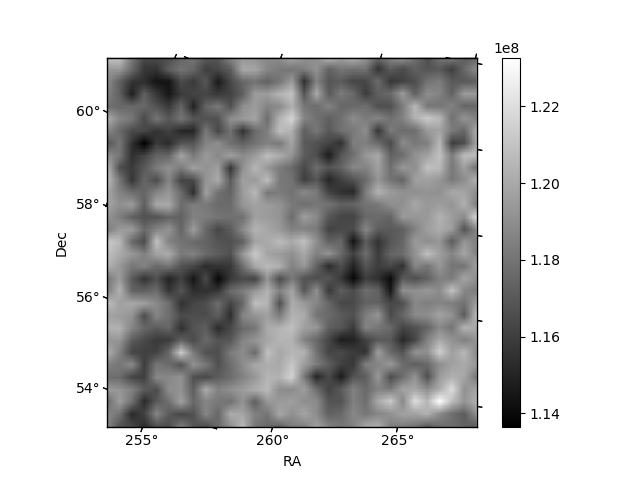
Histogram calculated using DETX and DETY for each event in the final _common_clean file
| Quadrant A | 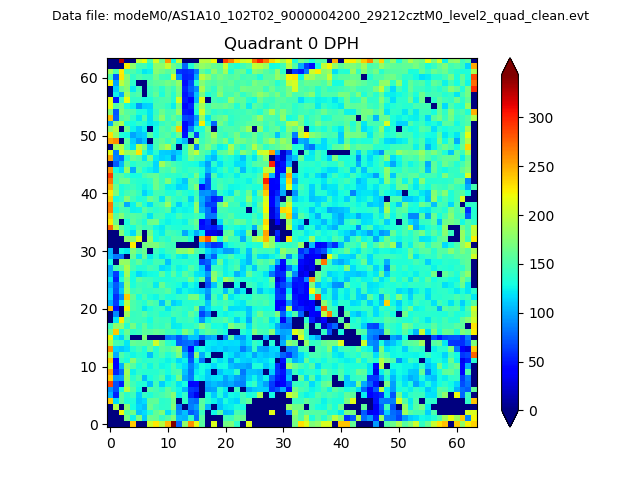 |
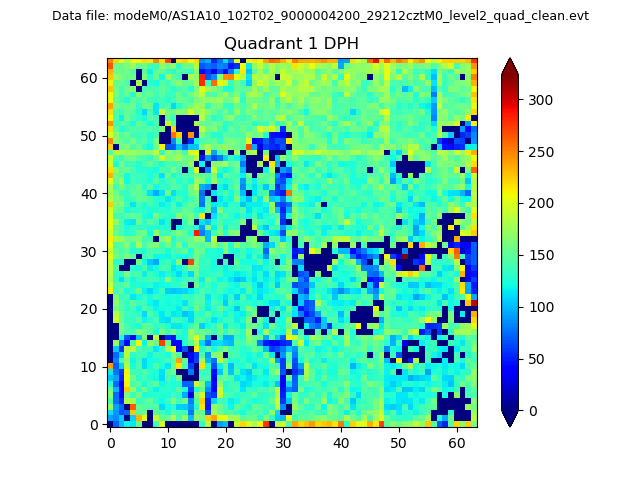 |
Quadrant B |
|---|---|---|---|
| Quadrant D | 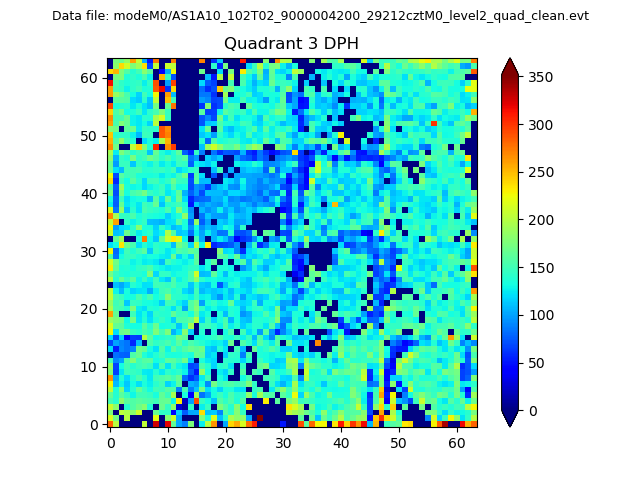 |
 |
Quadrant C |
| Plot type | Count rate plots | Images |
|---|---|---|
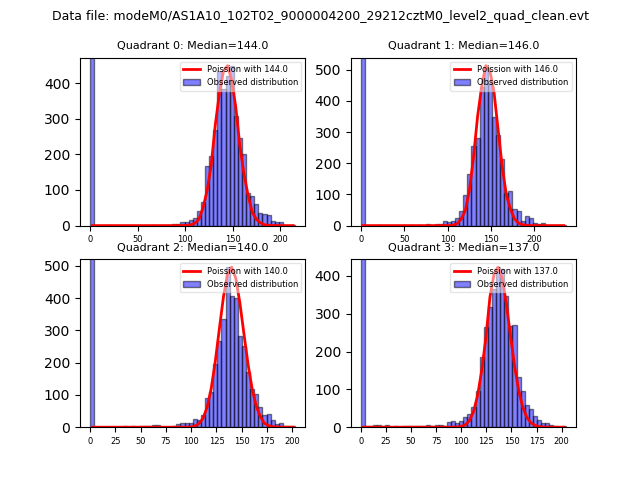
| Comparison with Poisson distribution Blue bars denote a histogram of data divided into 1 sec bins. Red curve is a Poisson curve with rate = median count rate of data. |
 |
 |
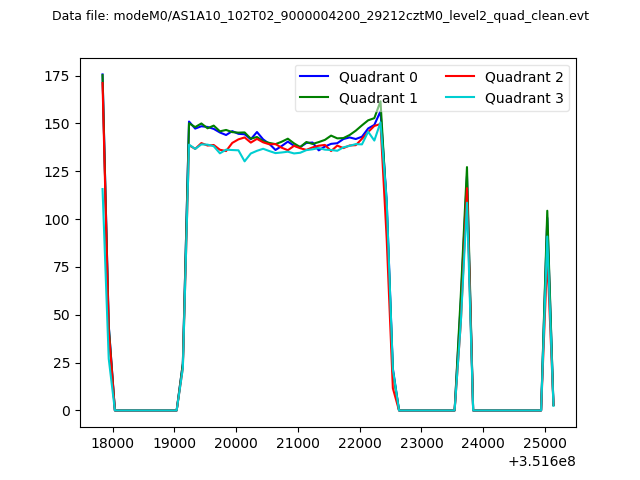
| Quadrant-wise count rates Data is divided into 100 sec bins |
 |
|
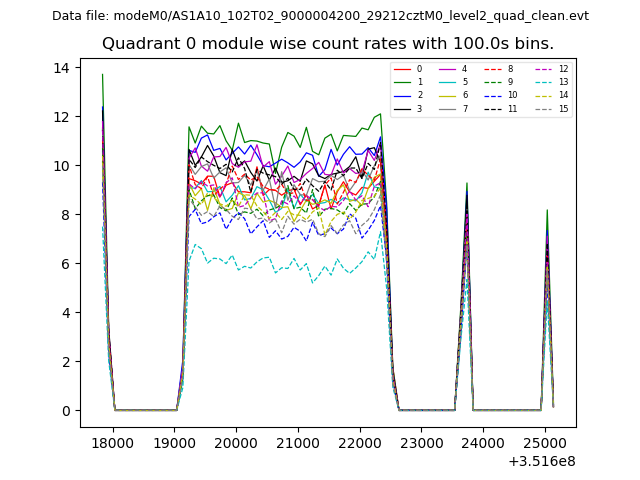
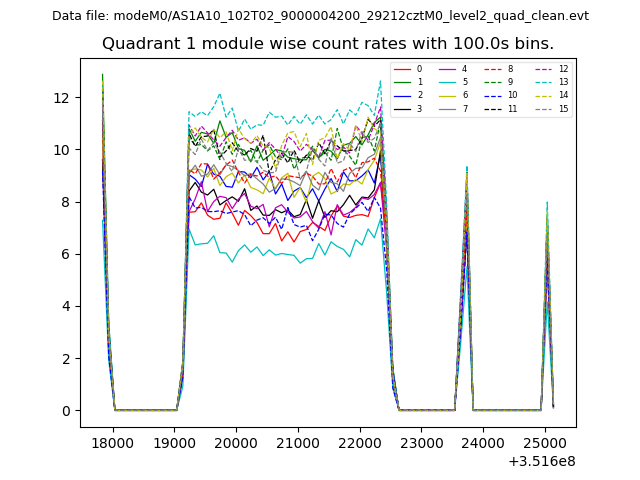
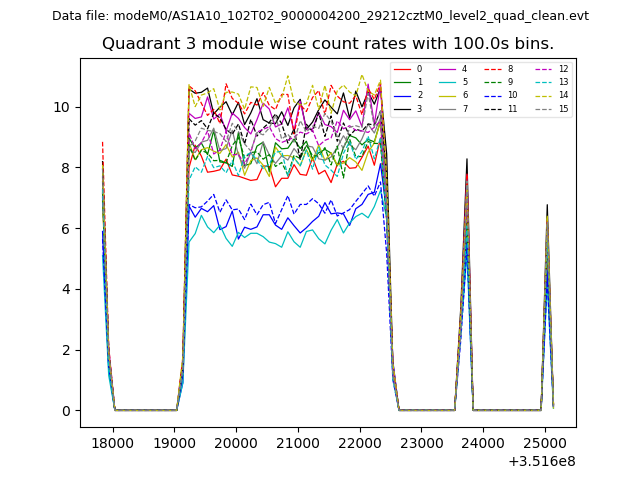
| Module-wise count rates for Quadrant A Data is divided into 100 sec bins |
 |
 |
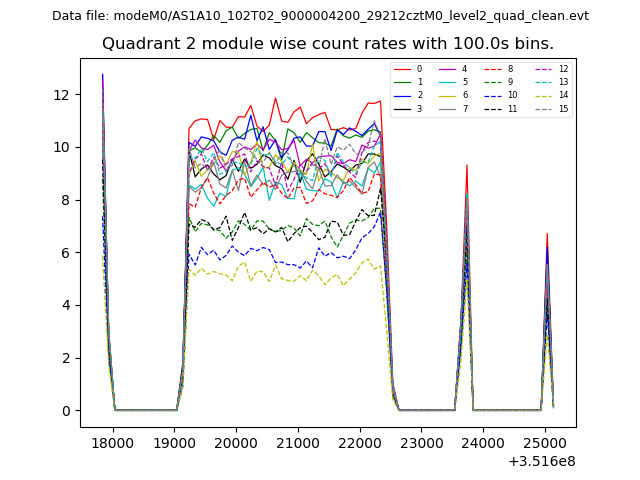
| Module-wise count rates for Quadrant B Data is divided into 100 sec bins |
 |
 |
| Module-wise count rates for Quadrant C Data is divided into 100 sec bins |
 |
 |
| Module-wise count rates for Quadrant D Data is divided into 100 sec bins |
 |
 |
| Parameter | Plot |
|---|---|
| CZT HV Monitor | 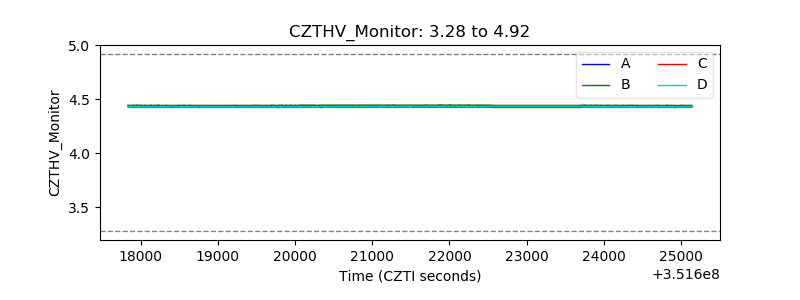 |
| D_VDD | 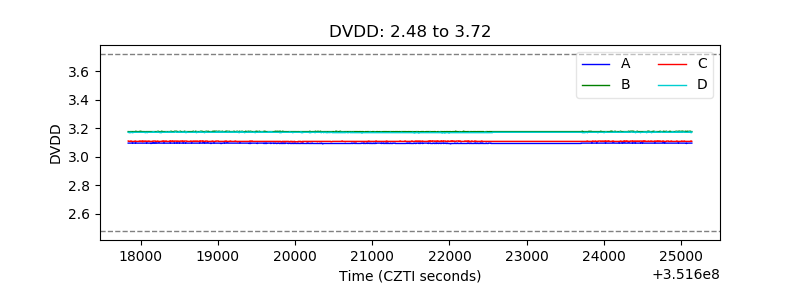 |
| Temperature 1 | 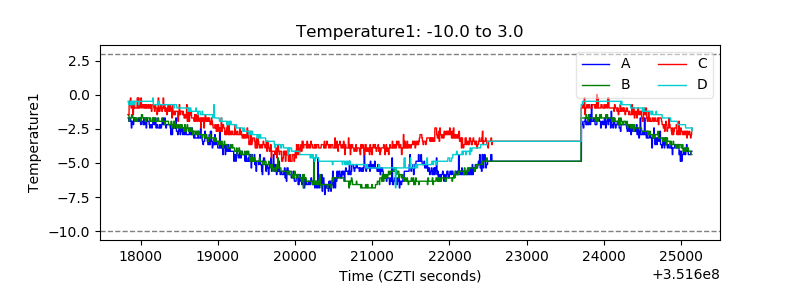 |
| Veto HV Monitor | 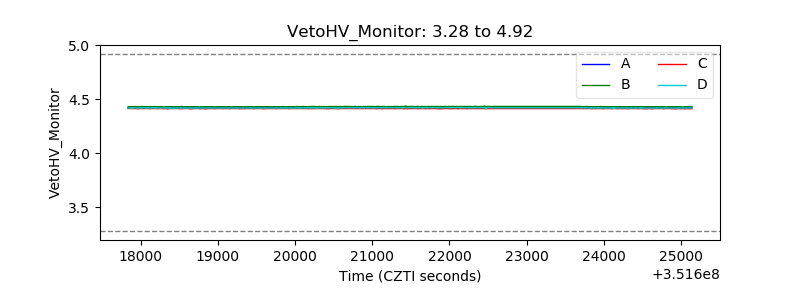 |
| Veto LLD | 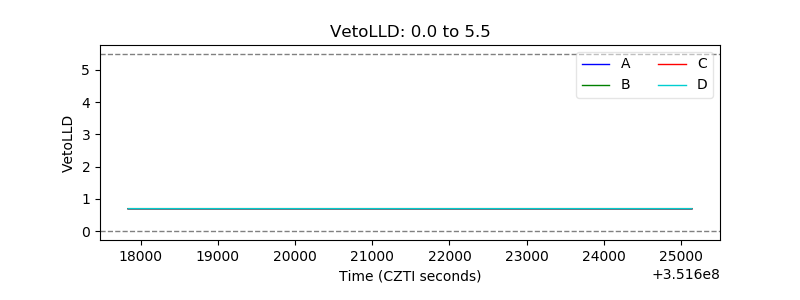 |
| Alpha Counter | 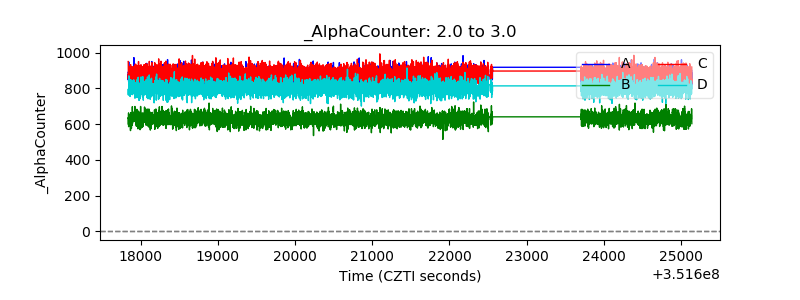 |
| _CPM_Rate | 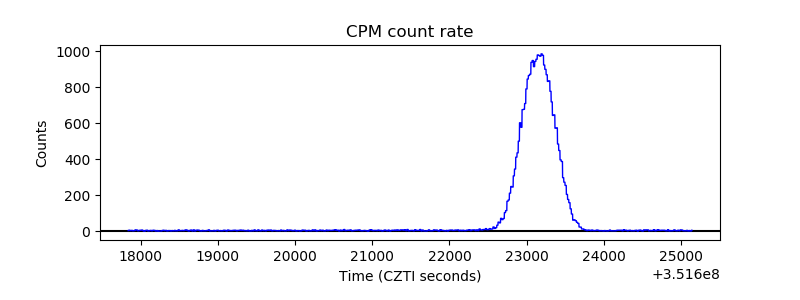 |
| CZT Counter | 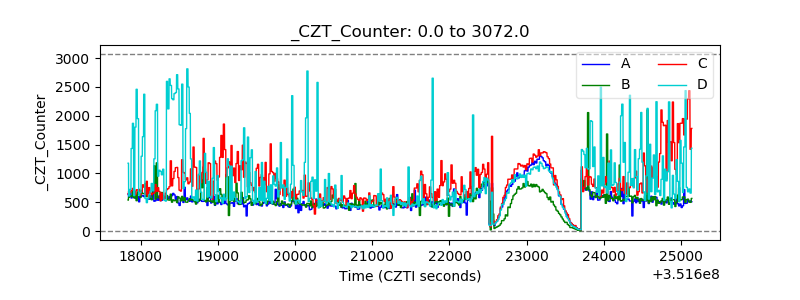 |
| +2.5 Volts monitor | 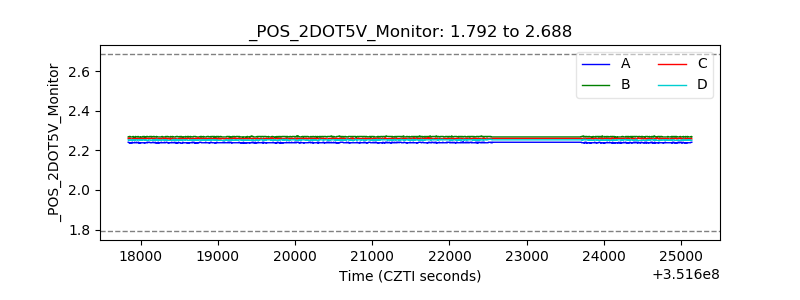 |
| +5 Volts monitor | 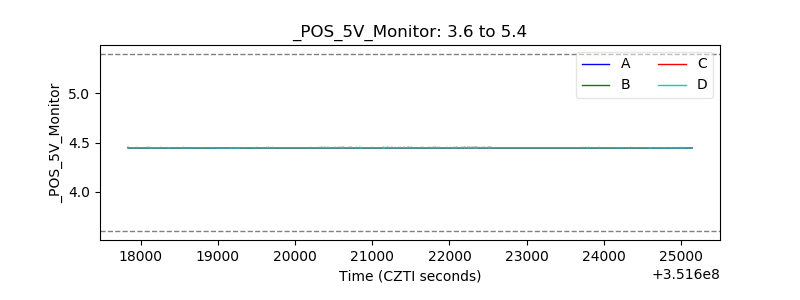 |
| _ROLL_ROT | 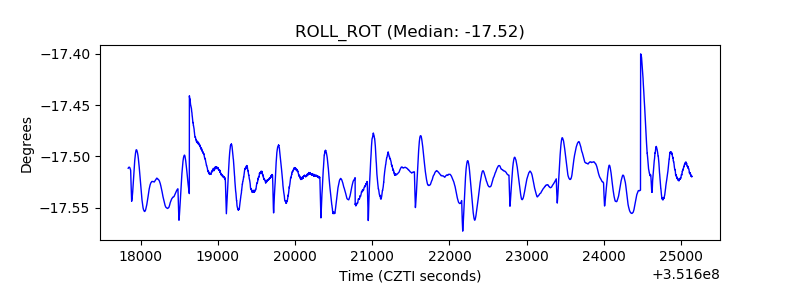 |
| _Roll_DEC | 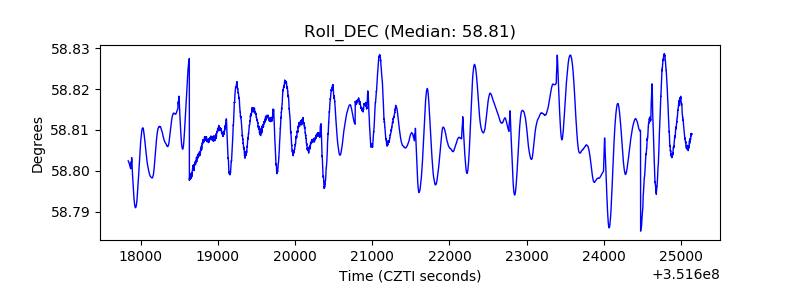 |
| _Roll_RA | 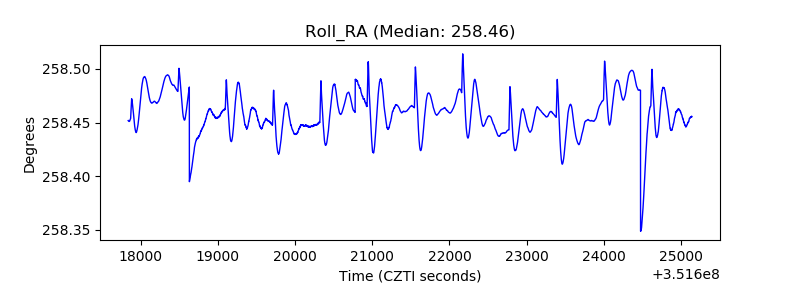 |
| Veto Counter | 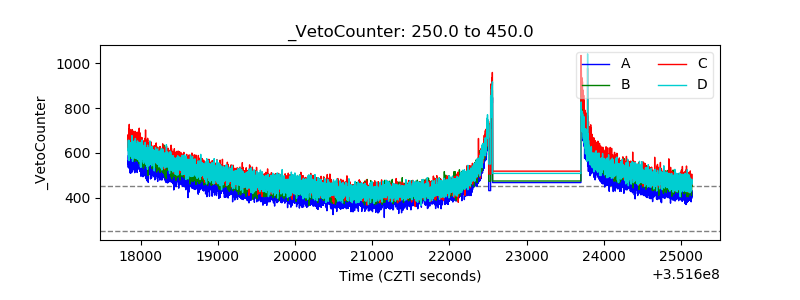 |