| Param | Original file | Final file |
|---|---|---|
| Filename | modeM0/AS1A10_102T02_9000004200_29213cztM0_level2.evt | modeM0/AS1A10_102T02_9000004200_29213cztM0_level2_quad_clean.evt |
| Size (bytes) | 695,986,560 | 95,181,120 |
| Size | 663.7 MB | 90.8 MB |
| Events in quadrant A | 3,343,184 | 621,911 |
| Events in quadrant B | 3,733,322 | 628,072 |
| Events in quadrant C | 7,150,355 | 583,142 |
| Events in quadrant D | 6,394,693 | 577,972 |
| Mode SS | |||
|---|---|---|---|
| Quadrant | BADHDUFLAG | Total packets | Discarded packets |
| A | 0 | 138 | 0 |
| B | 0 | 138 | 0 |
| C | 0 | 138 | 0 |
| D | 0 | 138 | 0 |
| Mode M0 | |||
|---|---|---|---|
| Quadrant | BADHDUFLAG | Total packets | Discarded packets |
| A | 0 | 14172 | 2 |
| B | 0 | 15360 | 2 |
| C | 0 | 26014 | 2 |
| D | 0 | 23708 | 2 |
| Mode M9 | |||
|---|---|---|---|
| Quadrant | BADHDUFLAG | Total packets | Discarded packets |
| A | 0 | 9 | 0 |
| B | 0 | 9 | 0 |
| C | 0 | 9 | 0 |
| D | 0 | 9 | 0 |
| Quadrant | Total seconds | Saturated seconds | Saturation percentage |
|---|---|---|---|
| A | 6754 | 54 | 0.799526% |
| B | 6755 | 123 | 1.820873% |
| C | 6755 | 866 | 12.820133% |
| D | 6755 | 723 | 10.703183% |
Noise dominated data is calculated using 1-second bins in cleaned event files. If a bin has >2000 counts, and if more than 50% of those come from <1% of pixels, then it is considered to be noise-dominated and hence unusable.
| Quadrant | # 1 sec bins | Bins with >0 counts | Bins with >2000 counts | High rate bins dominated by noise | Noise dominated (total time) | Noise dominated (detector-on time) | Marked lightcurve |
|---|---|---|---|---|---|---|---|
| A | 7694 | 6755 | 0 | 0 | 0.00% | 0.00% | 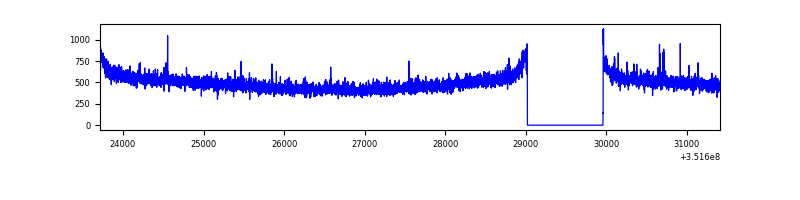 |
| B | 7695 | 6756 | 23 | 23 | 0.30% | 0.34% | 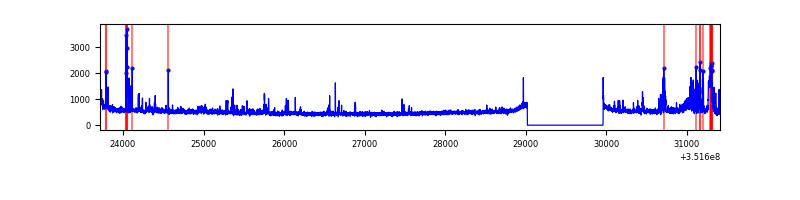 |
| C | 7695 | 6756 | 355 | 355 | 4.61% | 5.25% | 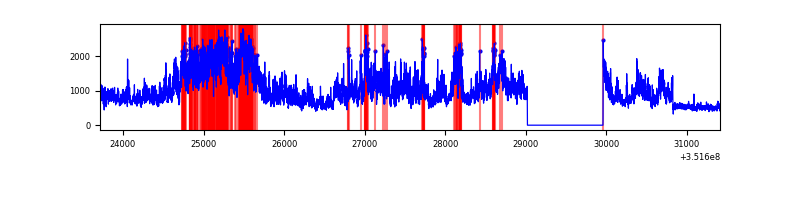 |
| D | 7695 | 6756 | 471 | 471 | 6.12% | 6.97% | 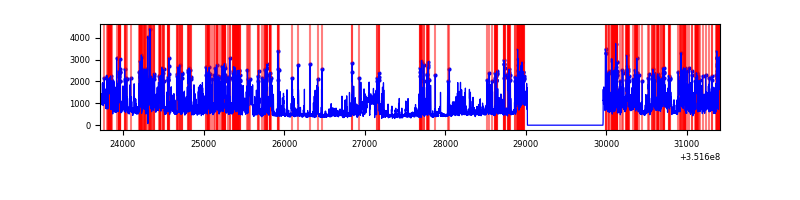 |
Top three noisy pixels from each quadrant. If the there are fewer than three noisy pixels in the level2.evt file, extra rows are filled as -1
| Pixel properties | Quadrant properties | ||||||
|---|---|---|---|---|---|---|---|
| Quadrant | DetID | PixID | Counts | Sigma | Mean | Median | Sigma |
| A | 0 | 13 | 31562 | 181.45 | 852 | 835 | 169.3 |
| A | 13 | 254 | 14467 | 80.5 | 852 | 835 | 169.3 |
| A | 15 | 174 | 10741 | 58.5 | 852 | 835 | 169.3 |
| B | 10 | 245 | 255582 | 1612.11 | 844 | 822 | 158.0 |
| B | 0 | 229 | 102415 | 642.88 | 844 | 822 | 158.0 |
| B | 0 | 183 | 40279 | 249.68 | 844 | 822 | 158.0 |
| C | 3 | 233 | 3846844 | 20775.27 | 803 | 809 | 185.1 |
| C | 14 | 238 | 131572 | 706.35 | 803 | 809 | 185.1 |
| C | 10 | 9 | 21832 | 113.56 | 803 | 809 | 185.1 |
| D | 1 | 52 | 2288188 | 12059.41 | 804 | 783 | 189.7 |
| D | 8 | 195 | 763416 | 4020.67 | 804 | 783 | 189.7 |
| D | 7 | 80 | 131112 | 687.11 | 804 | 783 | 189.7 |
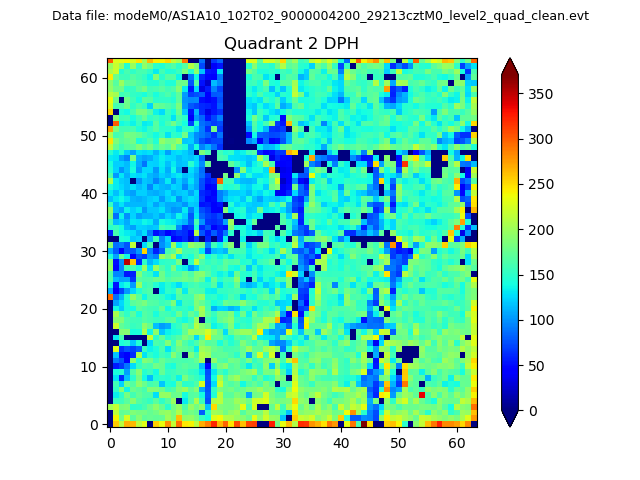
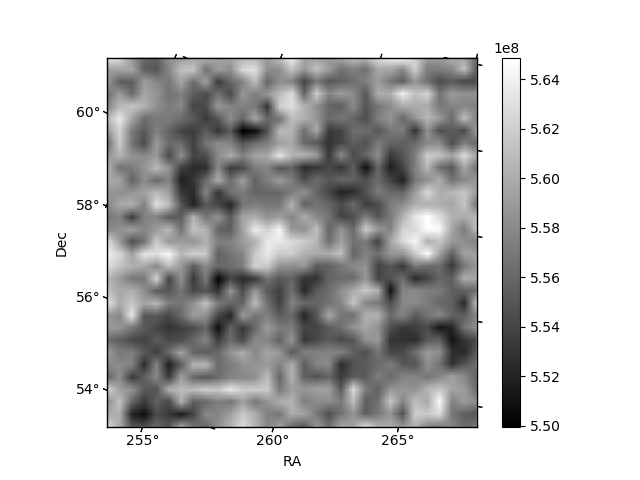
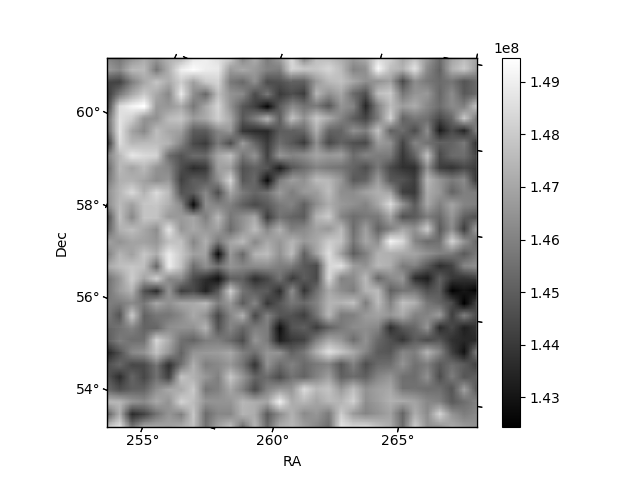
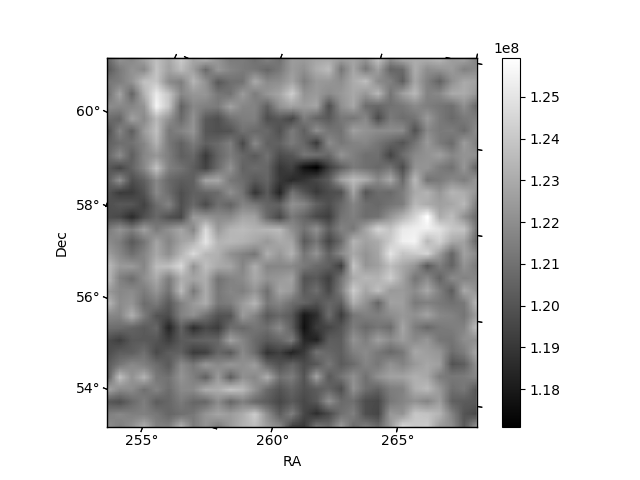
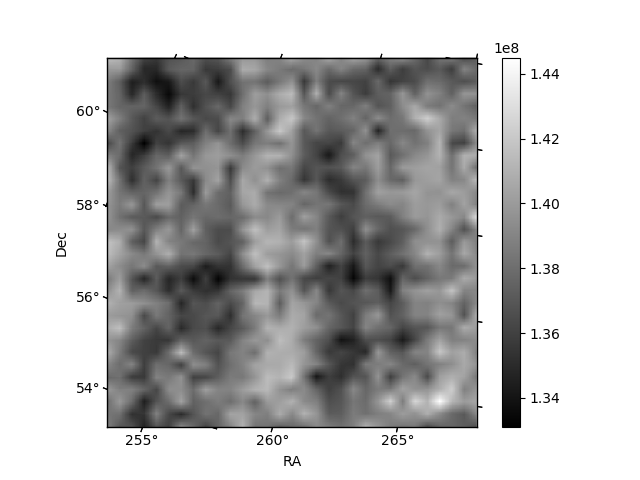
Histogram calculated using DETX and DETY for each event in the final _common_clean file
| Quadrant A | 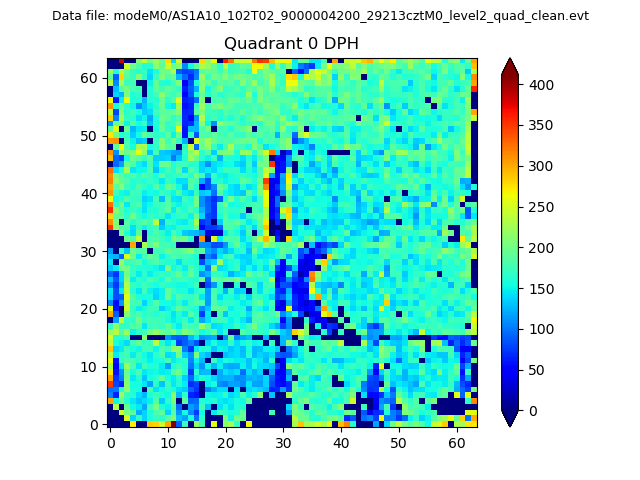 |
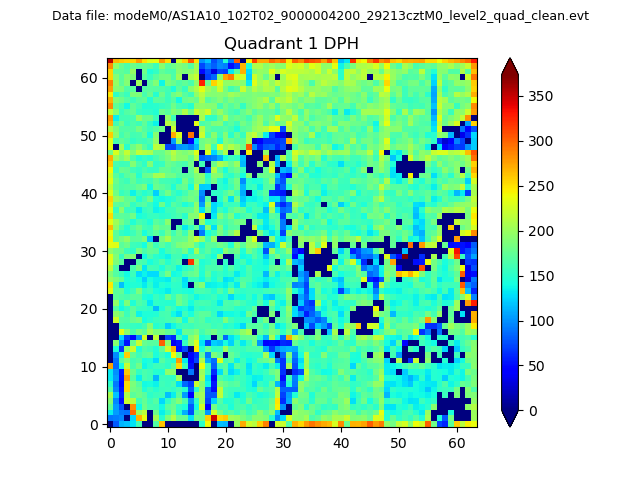 |
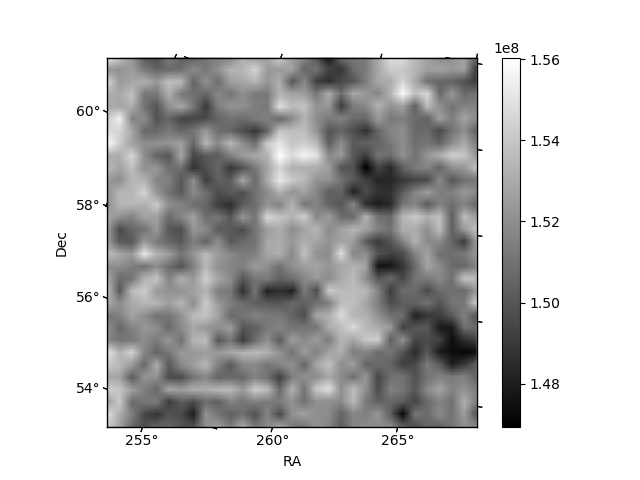
Quadrant B |
|---|---|---|---|
| Quadrant D | 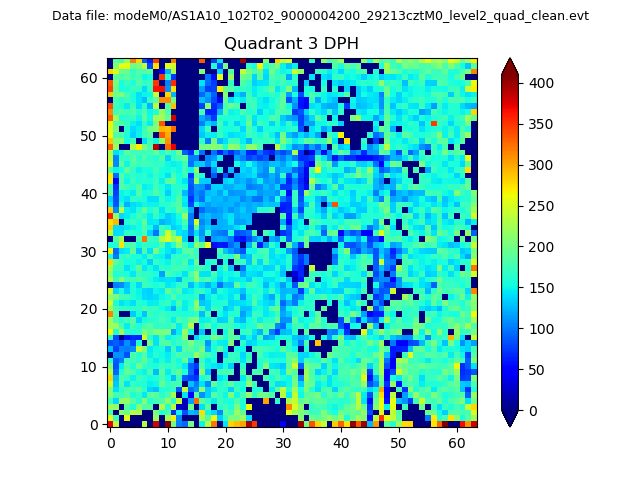 |
 |
Quadrant C |
| Plot type | Count rate plots | Images |
|---|---|---|
| Comparison with Poisson distribution Blue bars denote a histogram of data divided into 1 sec bins. Red curve is a Poisson curve with rate = median count rate of data. |
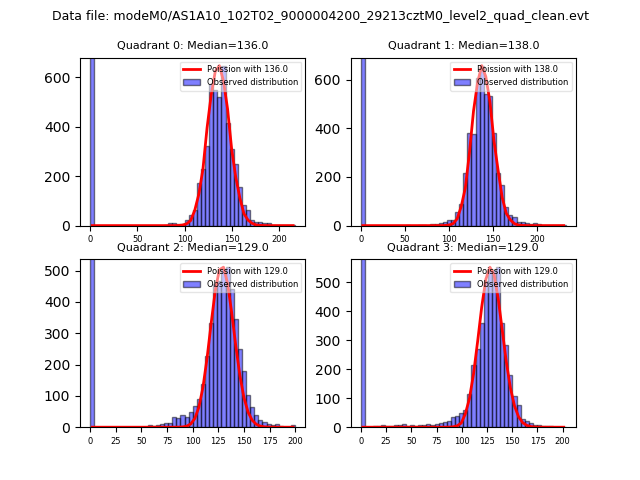 |
 |
| Quadrant-wise count rates Data is divided into 100 sec bins |
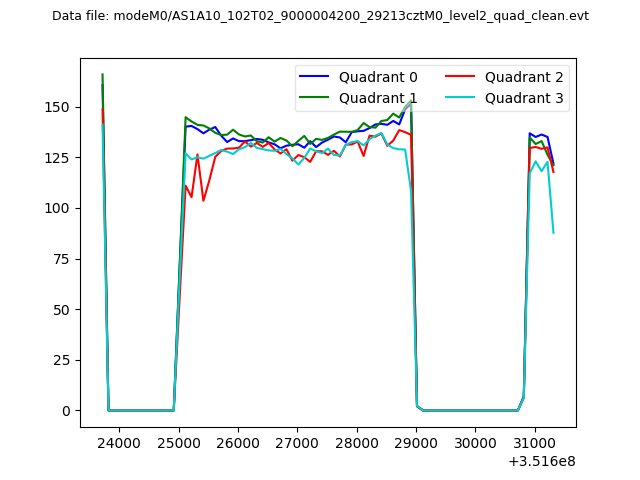 |
|
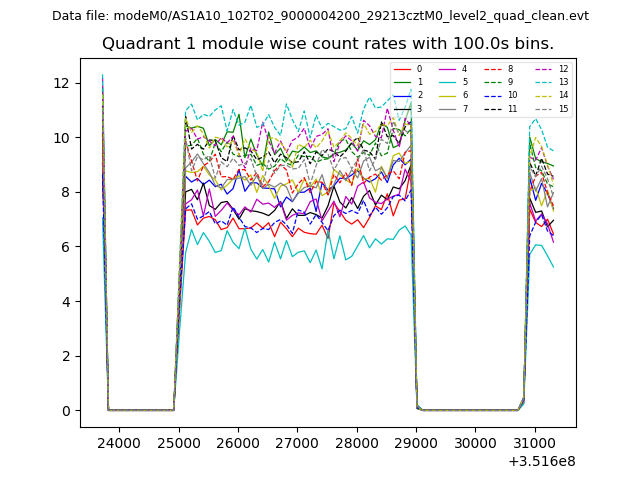
| Module-wise count rates for Quadrant A Data is divided into 100 sec bins |
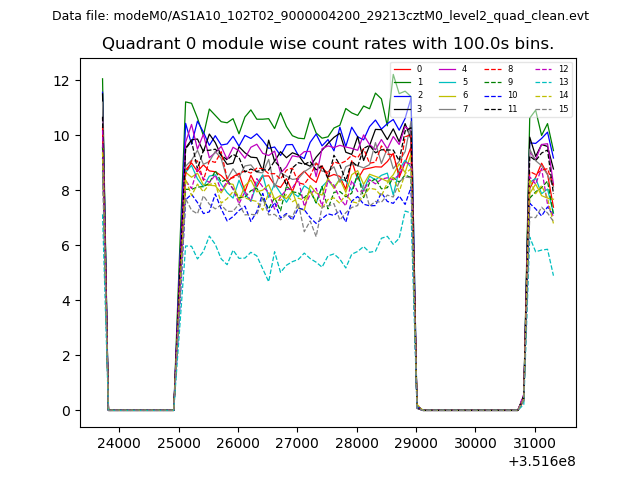 |
 |
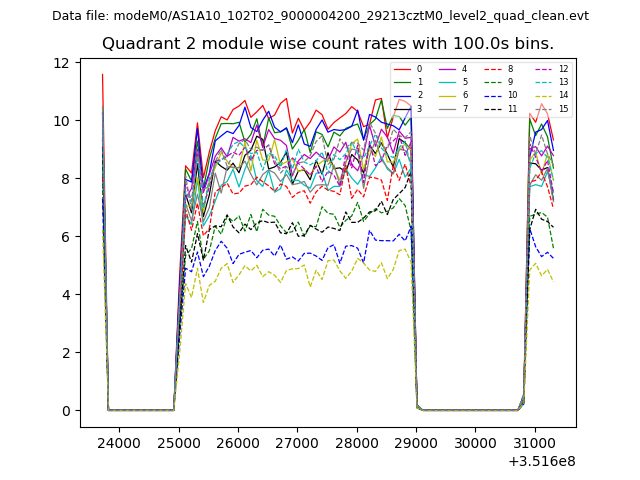
| Module-wise count rates for Quadrant B Data is divided into 100 sec bins |
 |
 |
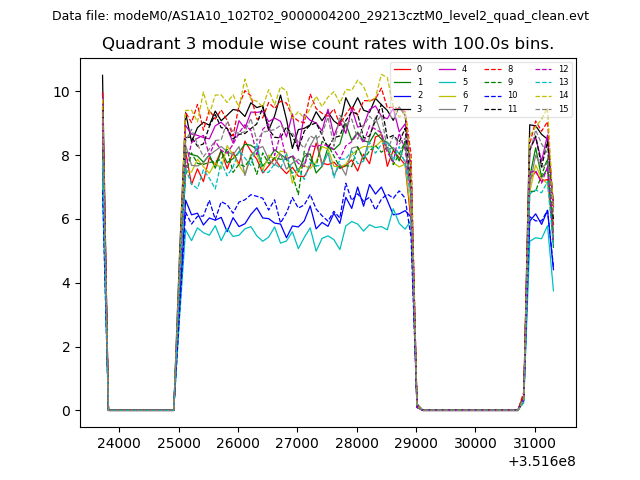
| Module-wise count rates for Quadrant C Data is divided into 100 sec bins |
 |
 |
| Module-wise count rates for Quadrant D Data is divided into 100 sec bins |
 |
 |
| Parameter | Plot |
|---|---|
| CZT HV Monitor | 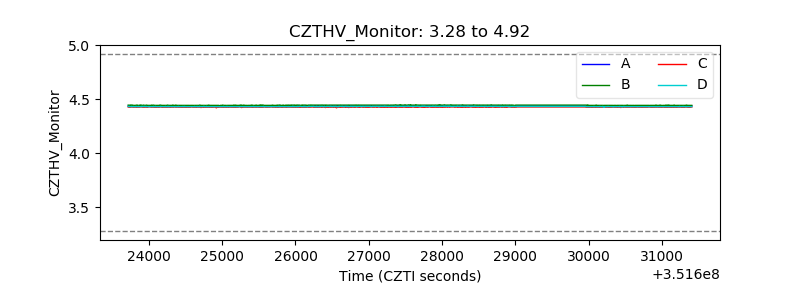 |
| D_VDD | 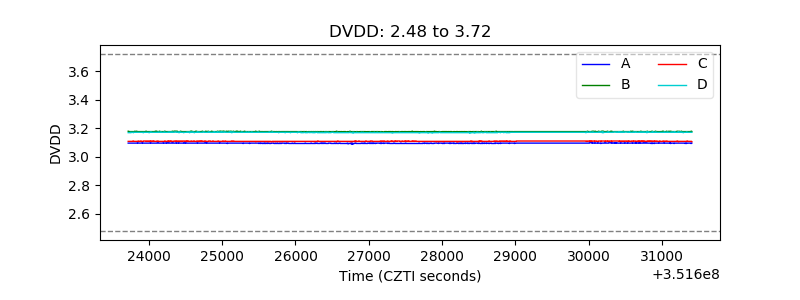 |
| Temperature 1 | 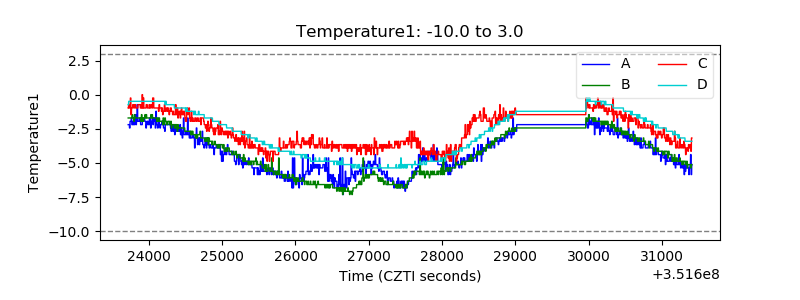 |
| Veto HV Monitor | 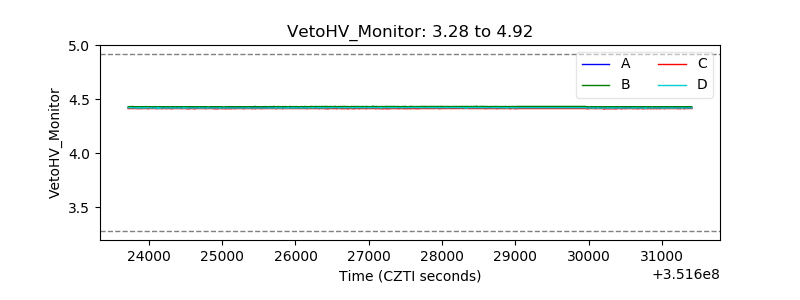 |
| Veto LLD | 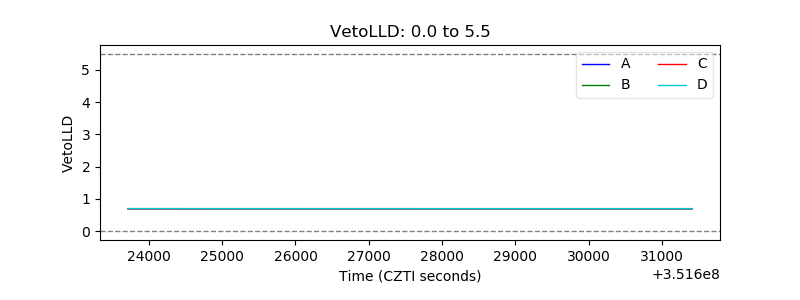 |
| Alpha Counter | 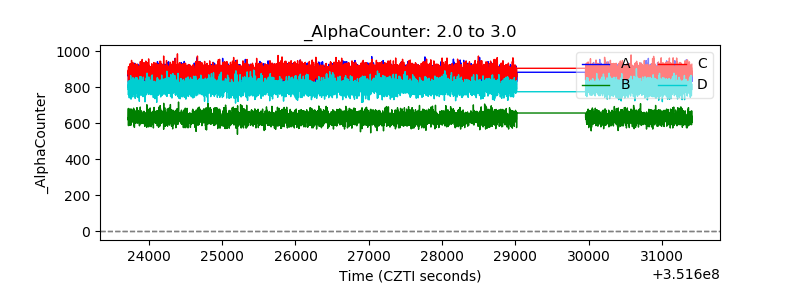 |
| _CPM_Rate | 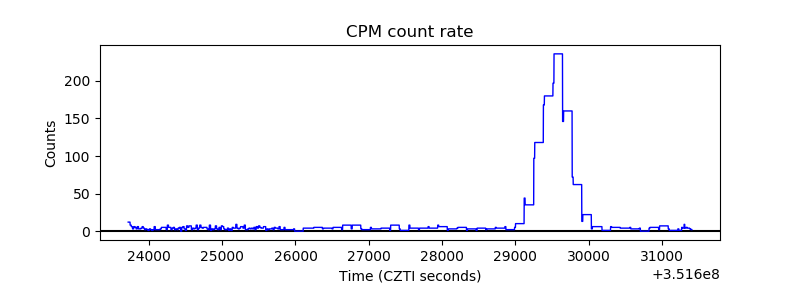 |
| CZT Counter | 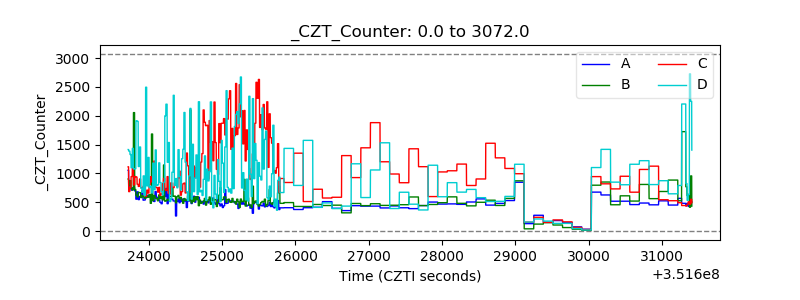 |
| +2.5 Volts monitor | 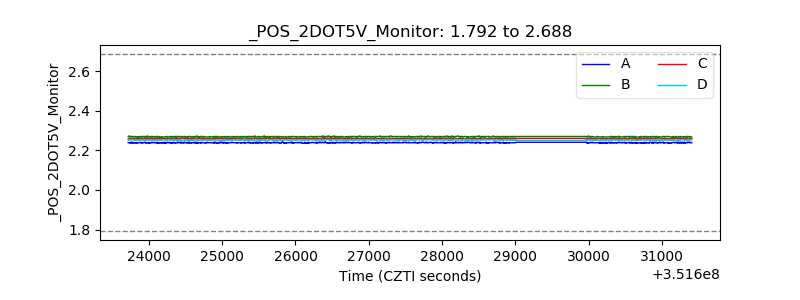 |
| +5 Volts monitor |  |
| _ROLL_ROT | 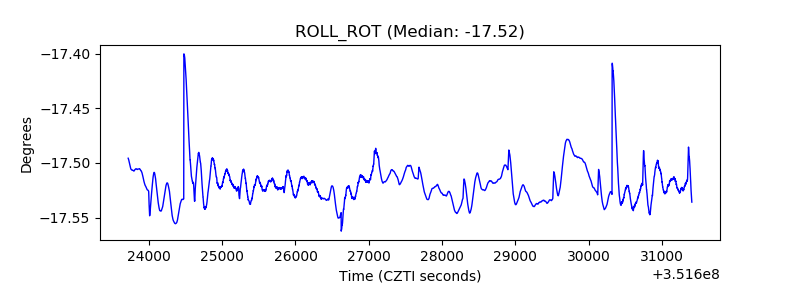 |
| _Roll_DEC | 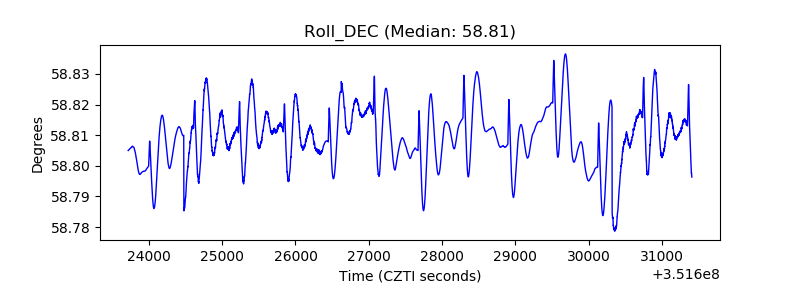 |
| _Roll_RA | 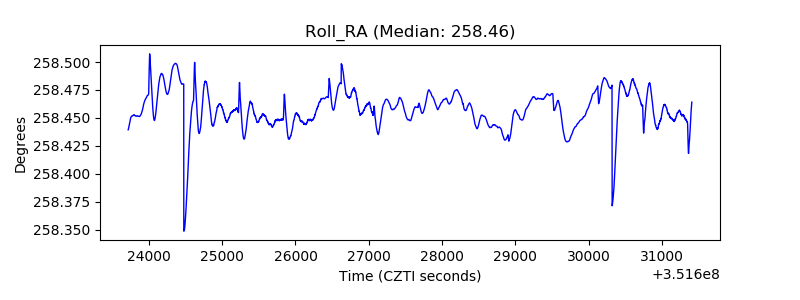 |
| Veto Counter | 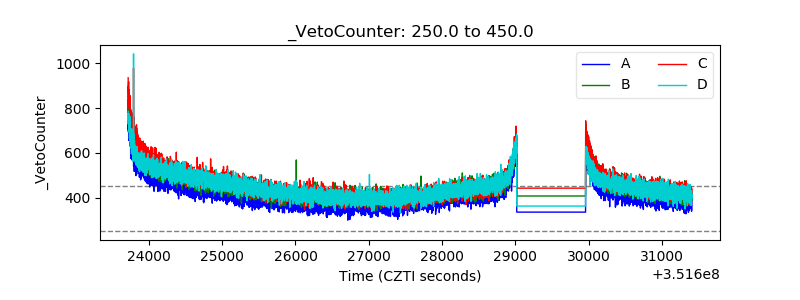 |