| Param | Original file | Final file |
|---|---|---|
| Filename | modeM0/AS1A10_102T02_9000004200_29214cztM0_level2.evt | modeM0/AS1A10_102T02_9000004200_29214cztM0_level2_quad_clean.evt |
| Size (bytes) | 694,491,840 | 105,874,560 |
| Size | 662.3 MB | 101.0 MB |
| Events in quadrant A | 3,348,573 | 714,736 |
| Events in quadrant B | 4,168,018 | 715,494 |
| Events in quadrant C | 3,978,813 | 700,430 |
| Events in quadrant D | 9,062,861 | 586,755 |
| Mode SS | |||
|---|---|---|---|
| Quadrant | BADHDUFLAG | Total packets | Discarded packets |
| A | 0 | 144 | 0 |
| B | 0 | 144 | 0 |
| C | 0 | 144 | 0 |
| D | 0 | 144 | 0 |
| Mode M0 | |||
|---|---|---|---|
| Quadrant | BADHDUFLAG | Total packets | Discarded packets |
| A | 0 | 14484 | 0 |
| B | 0 | 16990 | 0 |
| C | 0 | 16377 | 0 |
| D | 0 | 31792 | 0 |
| Mode M9 | |||
|---|---|---|---|
| Quadrant | BADHDUFLAG | Total packets | Discarded packets |
| A | 0 | 5 | 0 |
| B | 0 | 5 | 0 |
| C | 0 | 5 | 0 |
| D | 0 | 5 | 0 |
| Quadrant | Total seconds | Saturated seconds | Saturation percentage |
|---|---|---|---|
| A | 7013 | 59 | 0.841295% |
| B | 7014 | 186 | 2.651839% |
| C | 7014 | 199 | 2.837183% |
| D | 7014 | 1823 | 25.990875% |
Noise dominated data is calculated using 1-second bins in cleaned event files. If a bin has >2000 counts, and if more than 50% of those come from <1% of pixels, then it is considered to be noise-dominated and hence unusable.
| Quadrant | # 1 sec bins | Bins with >0 counts | Bins with >2000 counts | High rate bins dominated by noise | Noise dominated (total time) | Noise dominated (detector-on time) | Marked lightcurve |
|---|---|---|---|---|---|---|---|
| A | 7483 | 7015 | 0 | 0 | 0.00% | 0.00% | 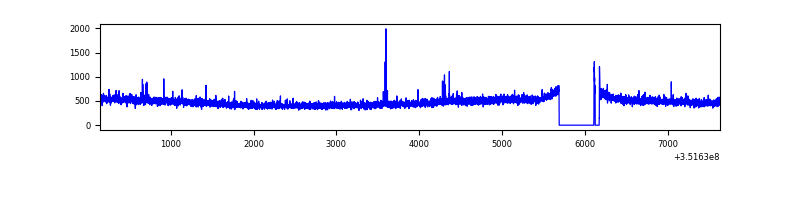 |
| B | 7484 | 7016 | 59 | 59 | 0.79% | 0.84% | 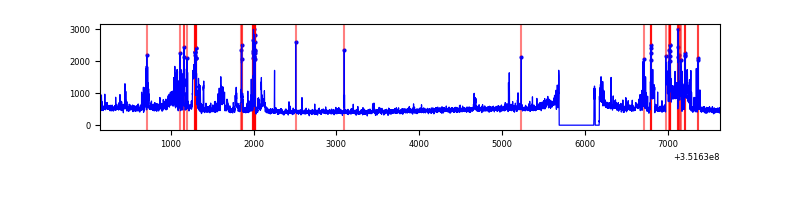 |
| C | 7484 | 7016 | 0 | 0 | 0.00% | 0.00% | 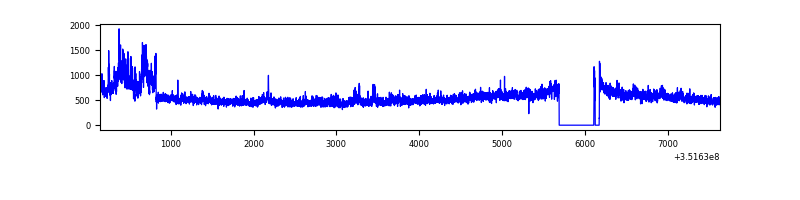 |
| D | 7484 | 7016 | 1492 | 1492 | 19.94% | 21.27% | 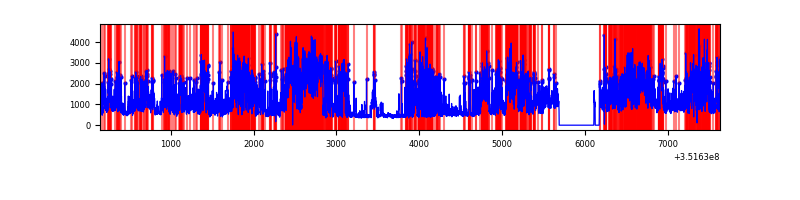 |
Top three noisy pixels from each quadrant. If the there are fewer than three noisy pixels in the level2.evt file, extra rows are filled as -1
| Pixel properties | Quadrant properties | ||||||
|---|---|---|---|---|---|---|---|
| Quadrant | DetID | PixID | Counts | Sigma | Mean | Median | Sigma |
| A | 0 | 13 | 25540 | 144.57 | 851 | 834 | 170.9 |
| A | 15 | 174 | 23933 | 135.17 | 851 | 834 | 170.9 |
| A | 13 | 254 | 15361 | 85.01 | 851 | 834 | 170.9 |
| B | 10 | 245 | 630878 | 3943.59 | 843 | 820 | 159.8 |
| B | 0 | 229 | 102257 | 634.9 | 843 | 820 | 159.8 |
| B | 0 | 183 | 64886 | 400.99 | 843 | 820 | 159.8 |
| C | 3 | 233 | 572384 | 2993.91 | 819 | 827 | 190.9 |
| C | 14 | 238 | 136680 | 711.62 | 819 | 827 | 190.9 |
| C | 10 | 9 | 58324 | 301.18 | 819 | 827 | 190.9 |
| D | 1 | 52 | 4404845 | 25115.2 | 738 | 718 | 175.4 |
| D | 13 | 104 | 1093813 | 6233.54 | 738 | 718 | 175.4 |
| D | 8 | 195 | 583348 | 3322.54 | 738 | 718 | 175.4 |
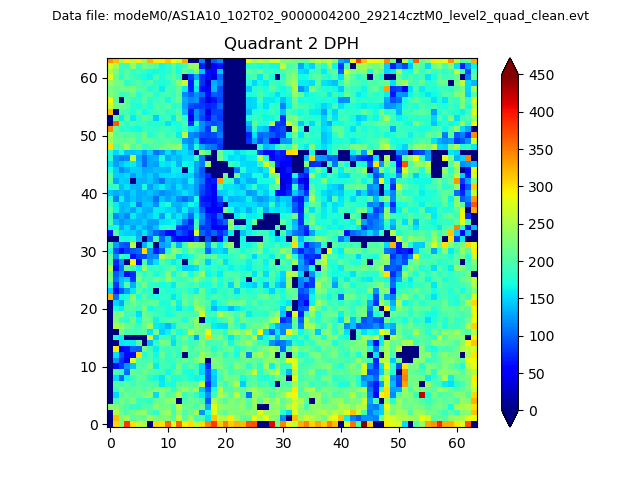
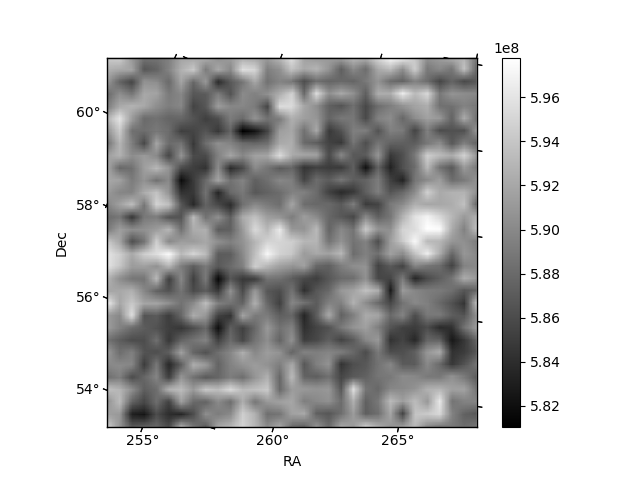
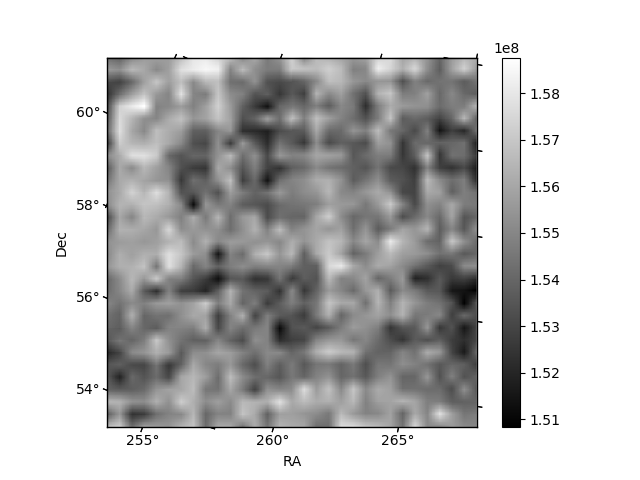
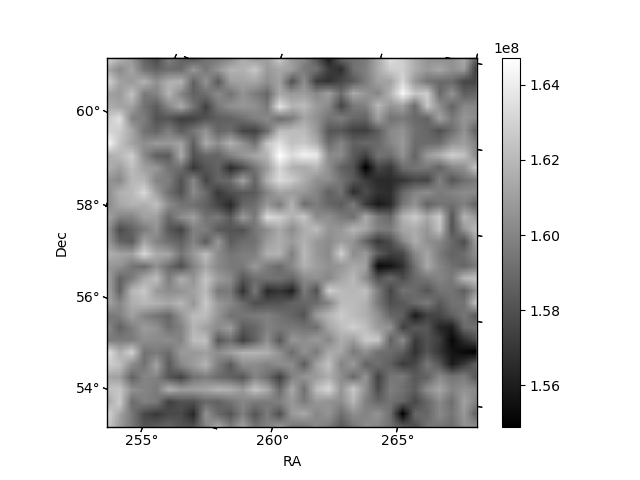
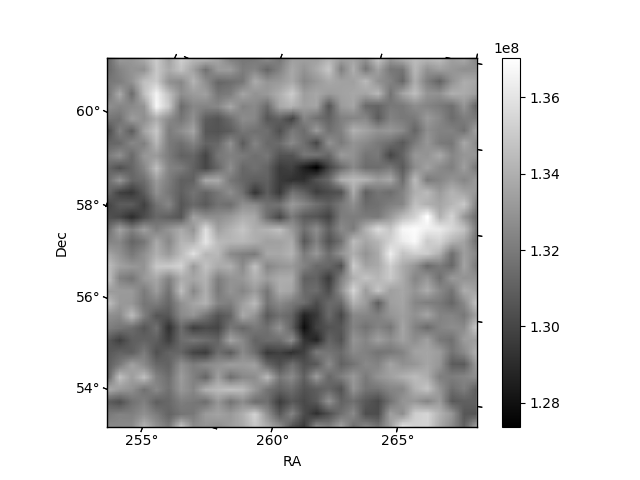
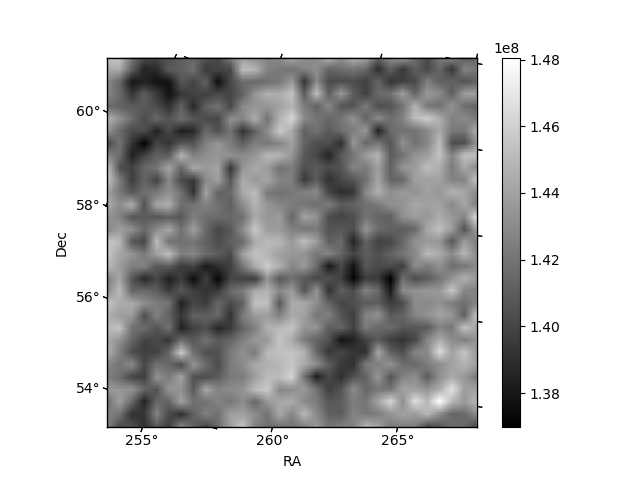
Histogram calculated using DETX and DETY for each event in the final _common_clean file
| Quadrant A | 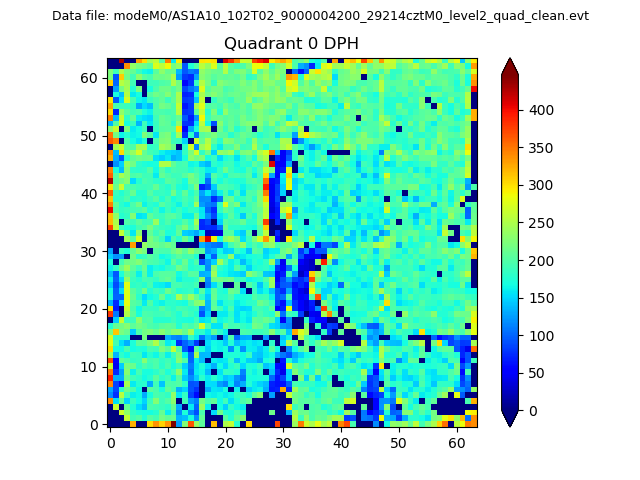 |
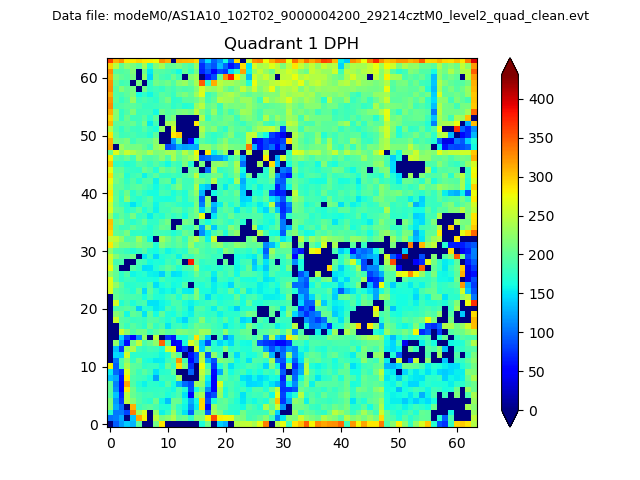 |
Quadrant B |
|---|---|---|---|
| Quadrant D | 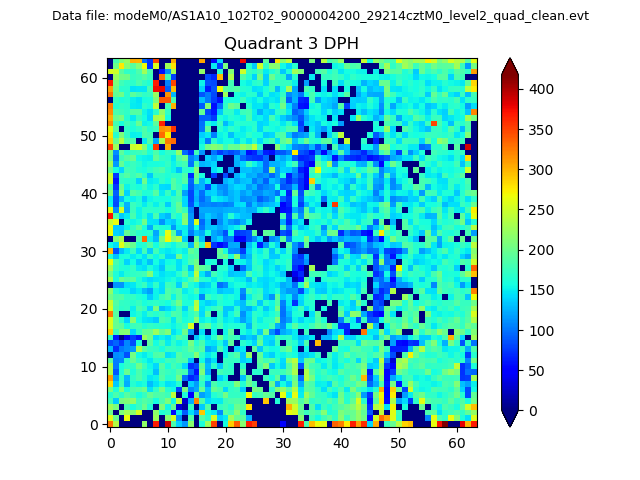 |
 |
Quadrant C |
| Plot type | Count rate plots | Images |
|---|---|---|
| Comparison with Poisson distribution Blue bars denote a histogram of data divided into 1 sec bins. Red curve is a Poisson curve with rate = median count rate of data. |
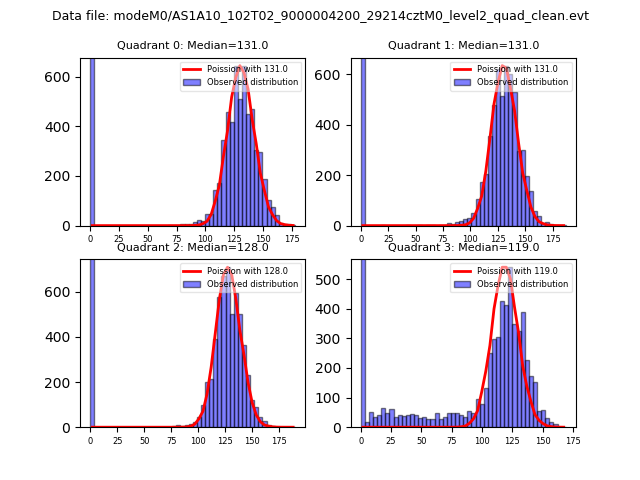 |
 |
| Quadrant-wise count rates Data is divided into 100 sec bins |
 |
|
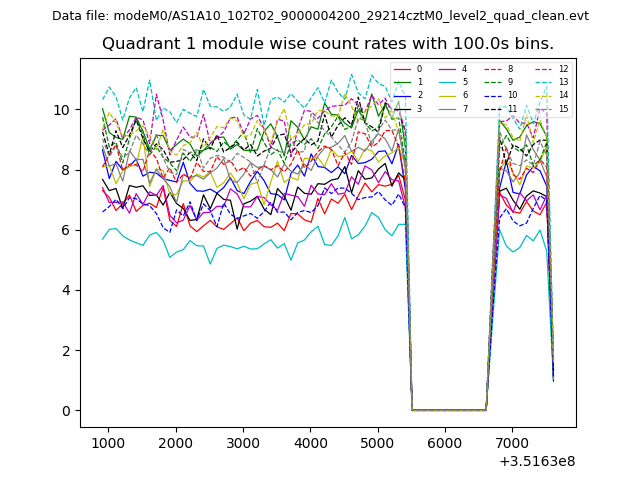
| Module-wise count rates for Quadrant A Data is divided into 100 sec bins |
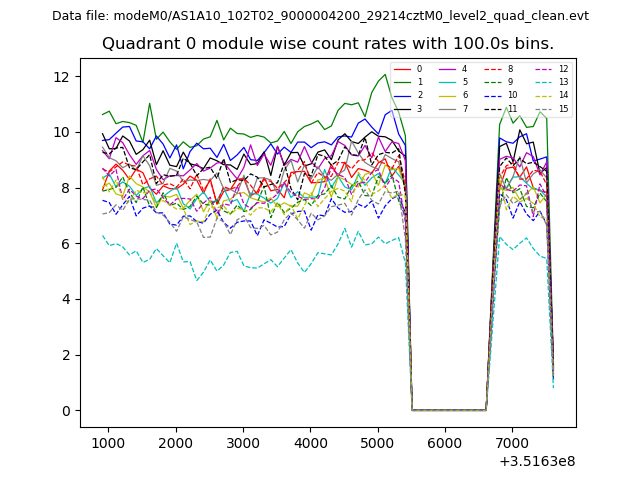 |
 |
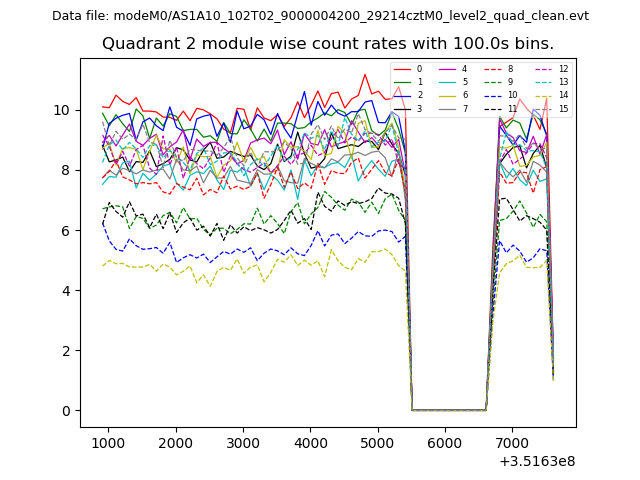
| Module-wise count rates for Quadrant B Data is divided into 100 sec bins |
 |
 |
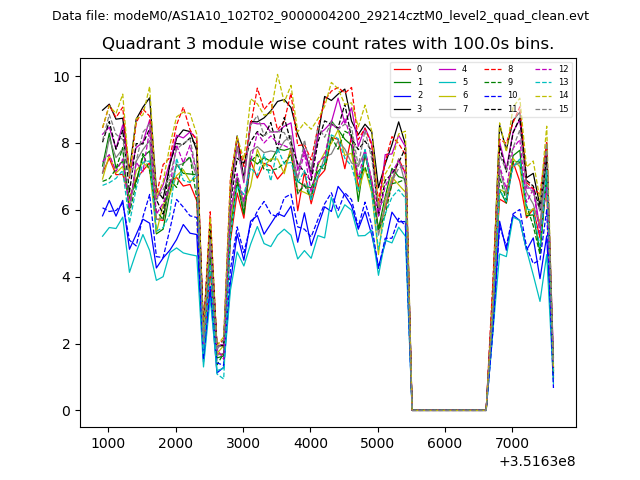
| Module-wise count rates for Quadrant C Data is divided into 100 sec bins |
 |
 |
| Module-wise count rates for Quadrant D Data is divided into 100 sec bins |
 |
 |
| Parameter | Plot |
|---|---|
| CZT HV Monitor | 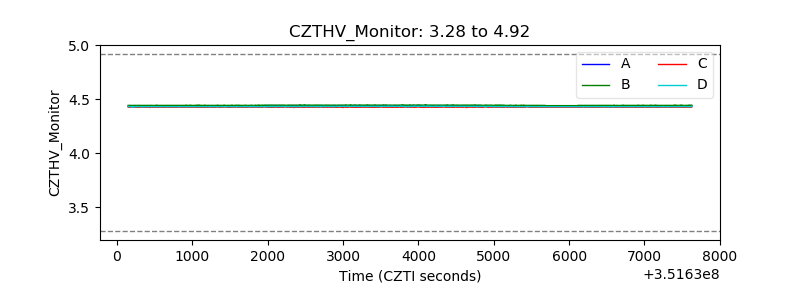 |
| D_VDD | 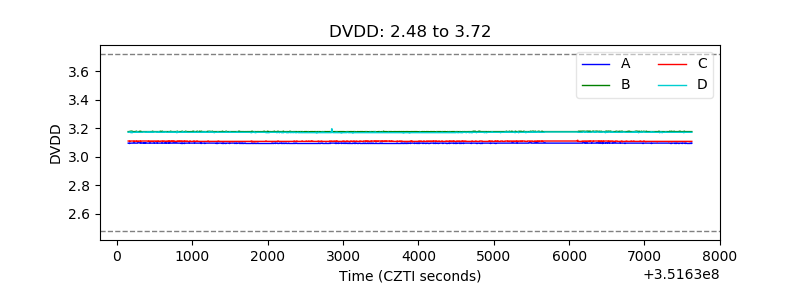 |
| Temperature 1 | 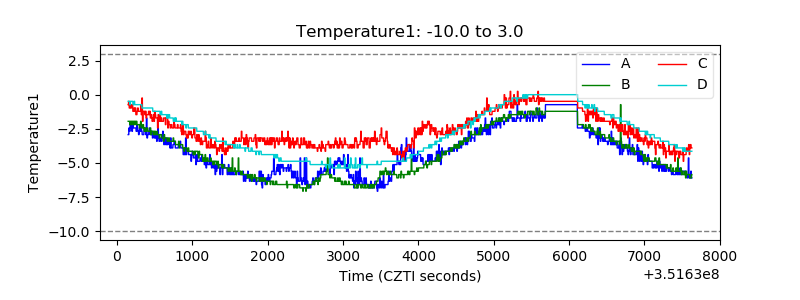 |
| Veto HV Monitor | 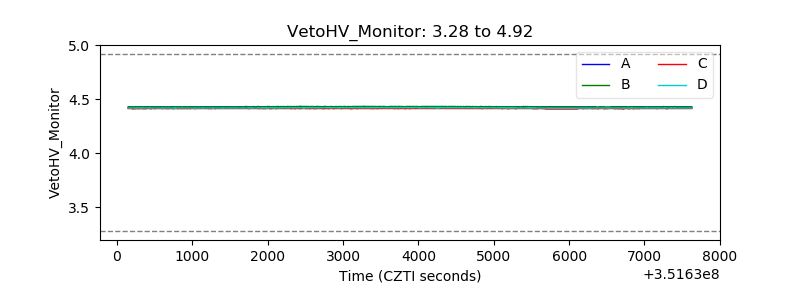 |
| Veto LLD |  |
| Alpha Counter | 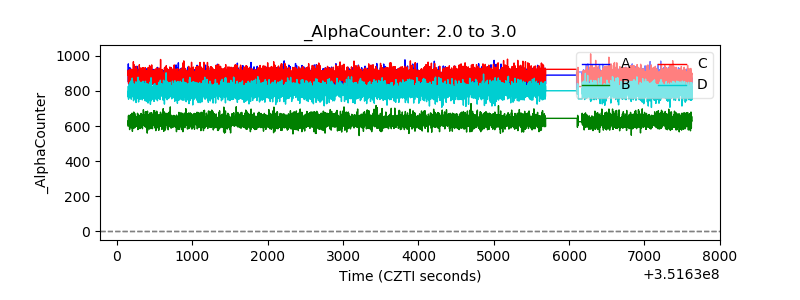 |
| _CPM_Rate | 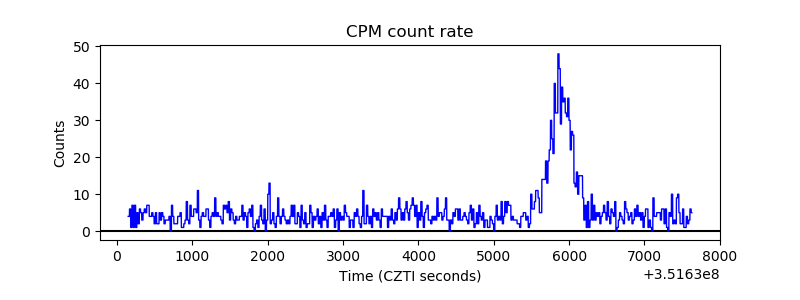 |
| CZT Counter | 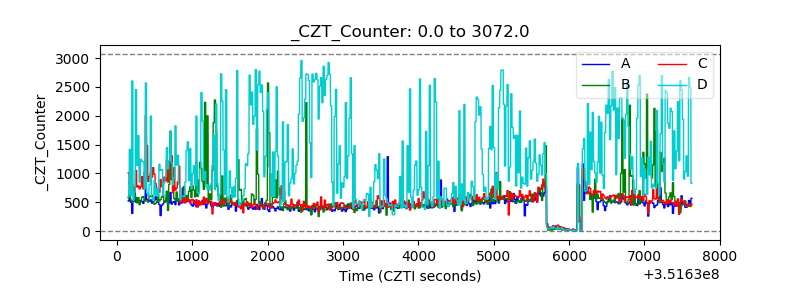 |
| +2.5 Volts monitor |  |
| +5 Volts monitor |  |
| _ROLL_ROT | 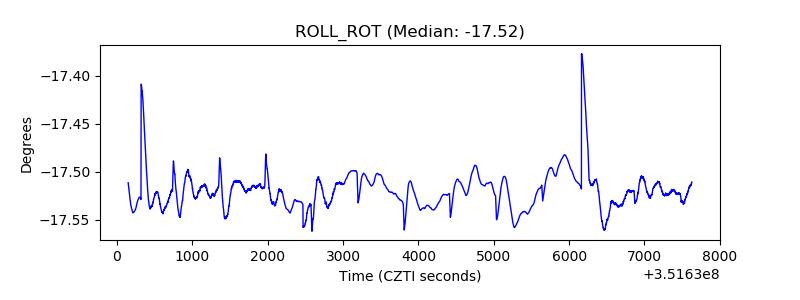 |
| _Roll_DEC | 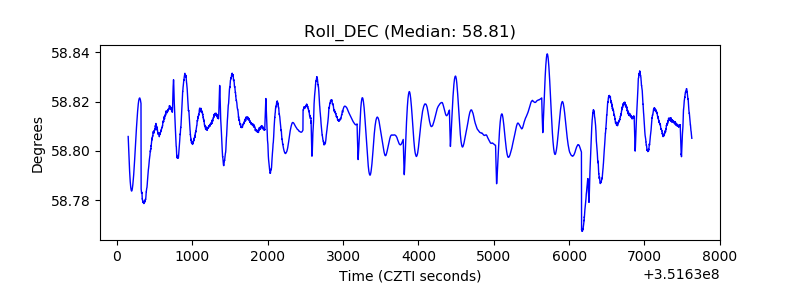 |
| _Roll_RA | 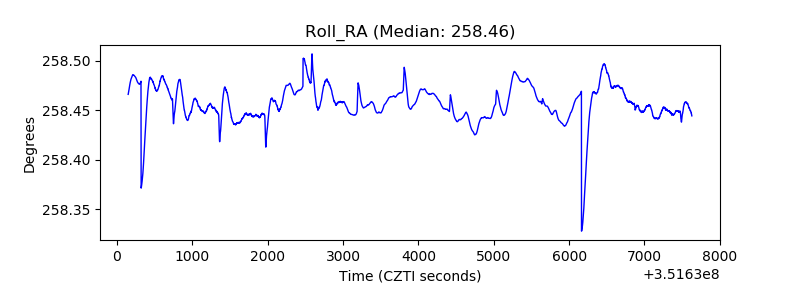 |
| Veto Counter | 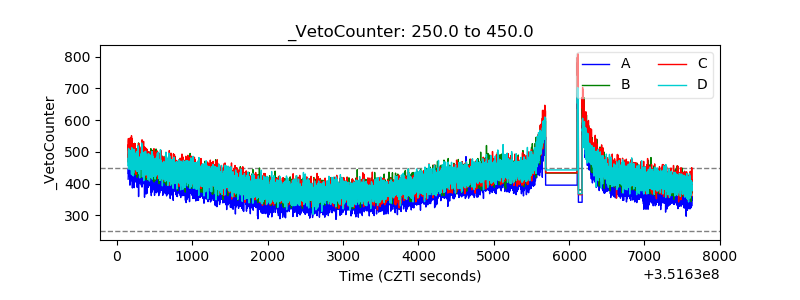 |