| Param | Original file | Final file |
|---|---|---|
| Filename | modeM0/AS1A10_102T02_9000004200_29216cztM0_level2.evt | modeM0/AS1A10_102T02_9000004200_29216cztM0_level2_quad_clean.evt |
| Size (bytes) | 664,433,280 | 121,176,000 |
| Size | 633.7 MB | 115.6 MB |
| Events in quadrant A | 3,976,770 | 787,047 |
| Events in quadrant B | 4,784,651 | 792,933 |
| Events in quadrant C | 4,085,055 | 776,563 |
| Events in quadrant D | 6,716,709 | 739,831 |
| Mode SS | |||
|---|---|---|---|
| Quadrant | BADHDUFLAG | Total packets | Discarded packets |
| A | 0 | 170 | 0 |
| B | 0 | 170 | 0 |
| C | 0 | 170 | 0 |
| D | 0 | 170 | 0 |
| Mode M0 | |||
|---|---|---|---|
| Quadrant | BADHDUFLAG | Total packets | Discarded packets |
| A | 0 | 17409 | 3 |
| B | 0 | 19728 | 3 |
| C | 0 | 17532 | 3 |
| D | 0 | 25673 | 3 |
| Mode M9 | |||
|---|---|---|---|
| Quadrant | BADHDUFLAG | Total packets | Discarded packets |
| A | 0 | 4 | 0 |
| B | 0 | 4 | 0 |
| C | 0 | 4 | 0 |
| D | 0 | 4 | 0 |
| Quadrant | Total seconds | Saturated seconds | Saturation percentage |
|---|---|---|---|
| A | 8251 | 98 | 1.187735% |
| B | 8251 | 275 | 3.332929% |
| C | 8251 | 235 | 2.848140% |
| D | 8252 | 700 | 8.482792% |
Noise dominated data is calculated using 1-second bins in cleaned event files. If a bin has >2000 counts, and if more than 50% of those come from <1% of pixels, then it is considered to be noise-dominated and hence unusable.
| Quadrant | # 1 sec bins | Bins with >0 counts | Bins with >2000 counts | High rate bins dominated by noise | Noise dominated (total time) | Noise dominated (detector-on time) | Marked lightcurve |
|---|---|---|---|---|---|---|---|
| A | 8716 | 8255 | 0 | 0 | 0.00% | 0.00% |  |
| B | 8716 | 8255 | 41 | 41 | 0.47% | 0.50% |  |
| C | 8716 | 8255 | 0 | 0 | 0.00% | 0.00% |  |
| D | 8717 | 8256 | 273 | 273 | 3.13% | 3.31% |  |
Top three noisy pixels from each quadrant. If the there are fewer than three noisy pixels in the level2.evt file, extra rows are filled as -1
| Pixel properties | Quadrant properties | ||||||
|---|---|---|---|---|---|---|---|
| Quadrant | DetID | PixID | Counts | Sigma | Mean | Median | Sigma |
| A | 0 | 13 | 72515 | 350.67 | 1009 | 985 | 204.0 |
| A | 13 | 254 | 16565 | 76.38 | 1009 | 985 | 204.0 |
| A | 3 | 137 | 9986 | 44.13 | 1009 | 985 | 204.0 |
| B | 10 | 246 | 295071 | 1549.48 | 1001 | 974 | 189.8 |
| B | 0 | 229 | 266596 | 1399.45 | 1001 | 974 | 189.8 |
| B | 10 | 245 | 223130 | 1170.45 | 1001 | 974 | 189.8 |
| C | 14 | 238 | 161113 | 701.32 | 976 | 982 | 228.3 |
| C | 3 | 233 | 96755 | 419.45 | 976 | 982 | 228.3 |
| C | 2 | 114 | 20132 | 83.87 | 976 | 982 | 228.3 |
| D | 1 | 52 | 1943033 | 8549.37 | 947 | 917 | 227.2 |
| D | 8 | 195 | 649193 | 2853.77 | 947 | 917 | 227.2 |
| D | 7 | 80 | 216978 | 951.12 | 947 | 917 | 227.2 |
Histogram calculated using DETX and DETY for each event in the final _common_clean file
| Quadrant A | 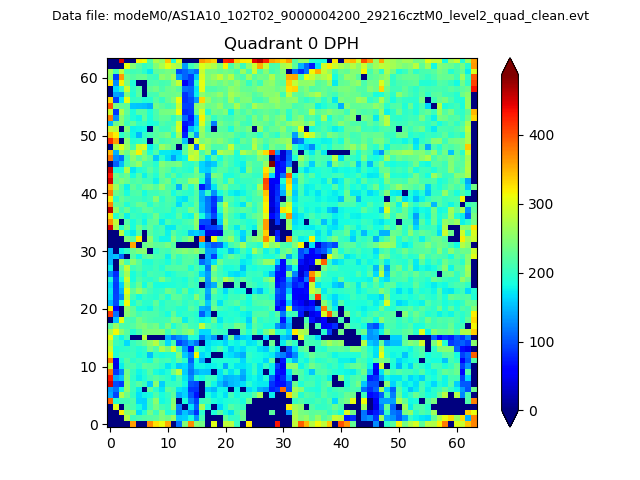 |
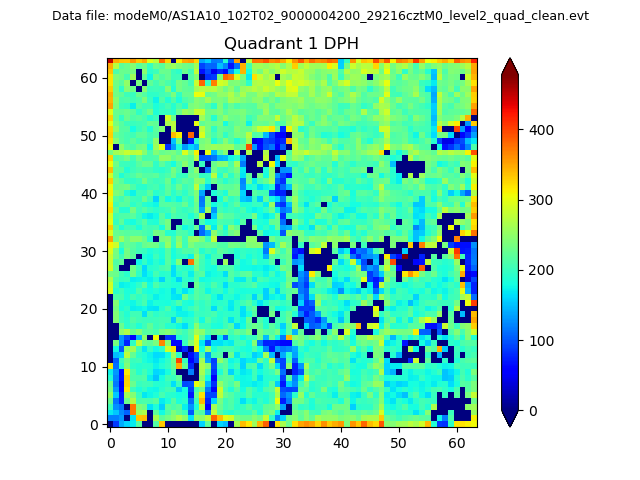 |
Quadrant B |
|---|---|---|---|
| Quadrant D | 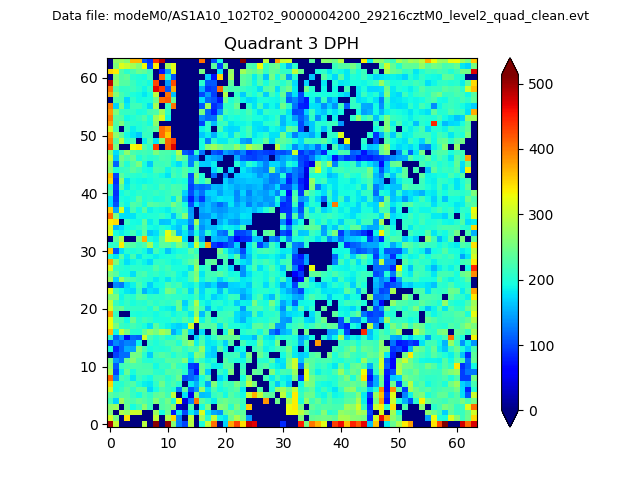 |
 |
Quadrant C |
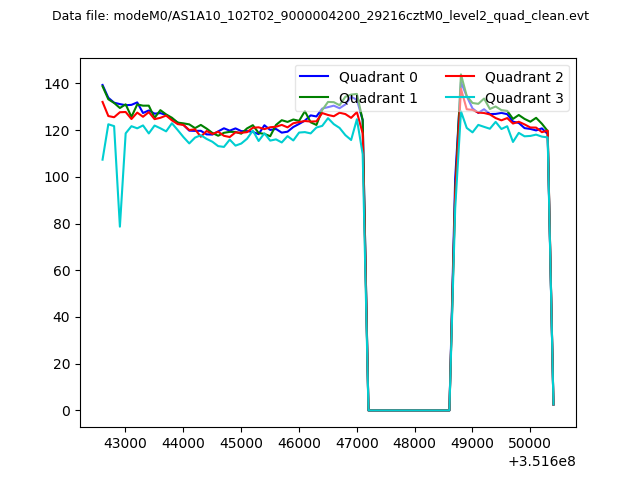
| Plot type | Count rate plots | Images |
|---|---|---|
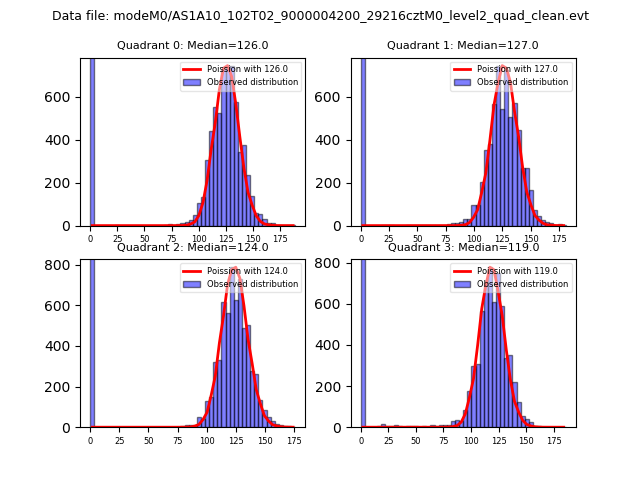
| Comparison with Poisson distribution Blue bars denote a histogram of data divided into 1 sec bins. Red curve is a Poisson curve with rate = median count rate of data. |
 |
 |
| Quadrant-wise count rates Data is divided into 100 sec bins |
 |
|
| Module-wise count rates for Quadrant A Data is divided into 100 sec bins |
 |
 |
| Module-wise count rates for Quadrant B Data is divided into 100 sec bins |
 |
 |
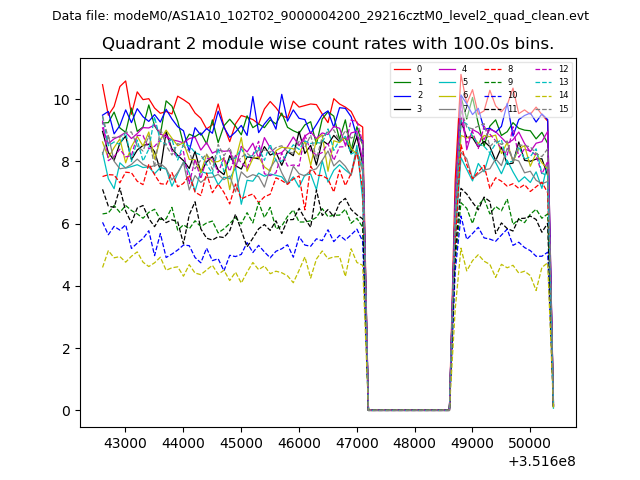
| Module-wise count rates for Quadrant C Data is divided into 100 sec bins |
 |
 |
| Module-wise count rates for Quadrant D Data is divided into 100 sec bins |
 |
 |
| Parameter | Plot |
|---|---|
| CZT HV Monitor | 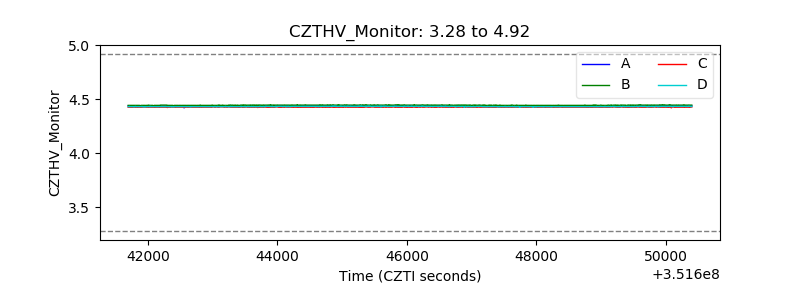 |
| D_VDD | 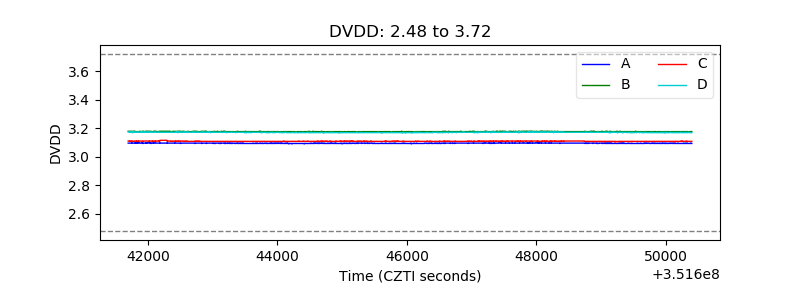 |
| Temperature 1 | 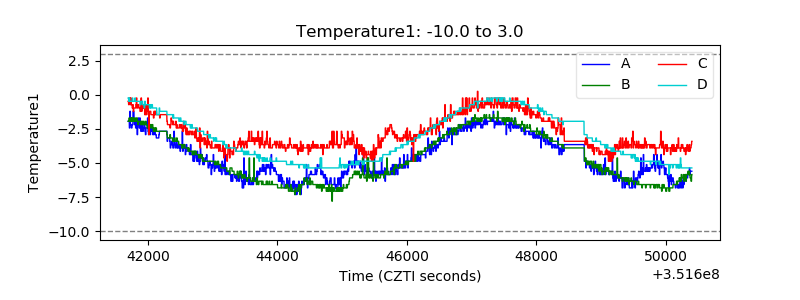 |
| Veto HV Monitor | 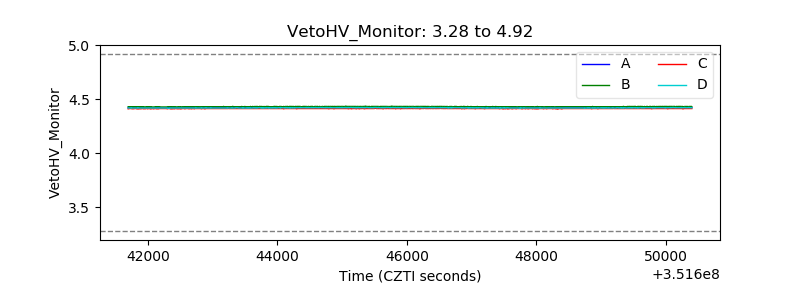 |
| Veto LLD | 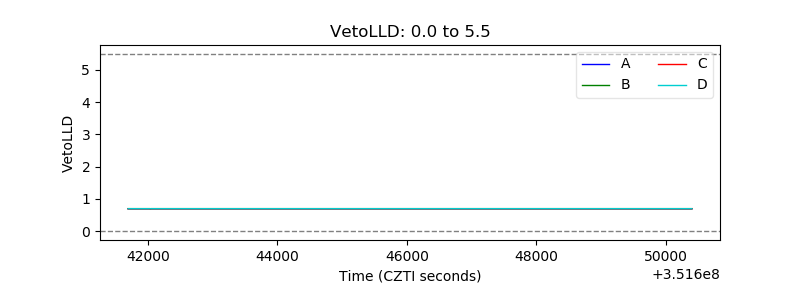 |
| Alpha Counter | 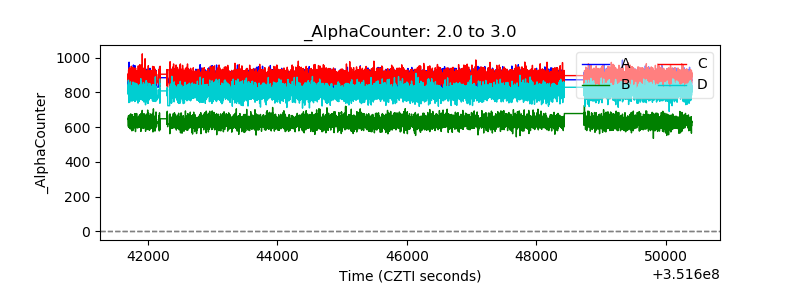 |
| _CPM_Rate | 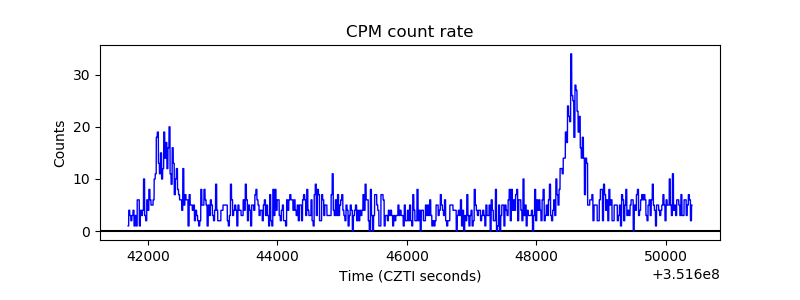 |
| CZT Counter | 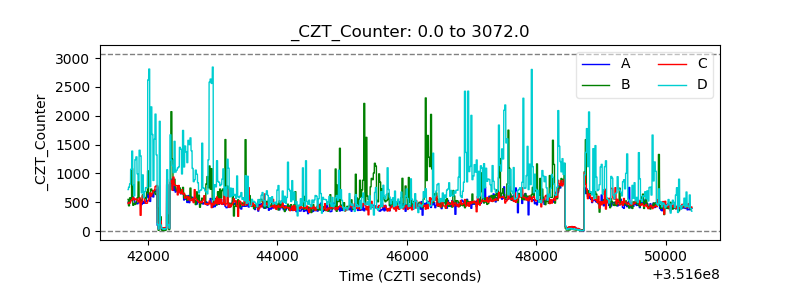 |
| +2.5 Volts monitor |  |
| +5 Volts monitor |  |
| _ROLL_ROT | 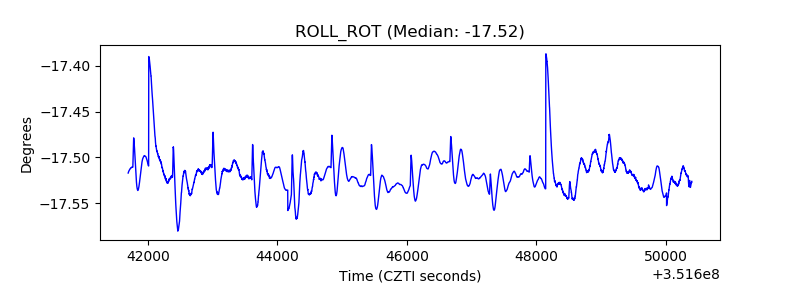 |
| _Roll_DEC |  |
| _Roll_RA | 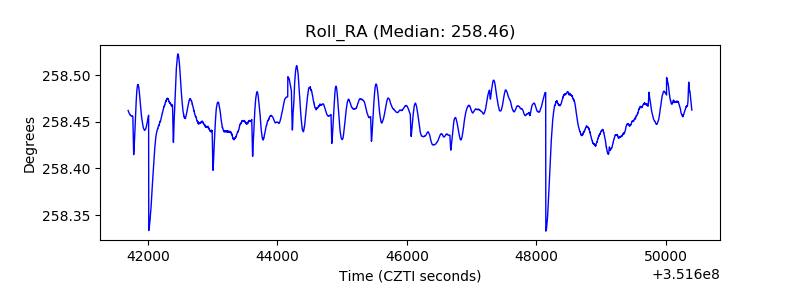 |
| Veto Counter |  |