| Param | Original file | Final file |
|---|---|---|
| Filename | modeM0/AS1A10_102T02_9000004200_29219cztM0_level2.evt | modeM0/AS1A10_102T02_9000004200_29219cztM0_level2_quad_clean.evt |
| Size (bytes) | 1,502,700,480 | 284,109,120 |
| Size | 1.4 GB | 270.9 MB |
| Events in quadrant A | 8,916,112 | 1,855,980 |
| Events in quadrant B | 10,223,369 | 1,884,340 |
| Events in quadrant C | 9,249,944 | 1,830,306 |
| Events in quadrant D | 15,831,122 | 1,718,978 |
| Mode SS | |||
|---|---|---|---|
| Quadrant | BADHDUFLAG | Total packets | Discarded packets |
| A | 0 | 390 | 0 |
| B | 0 | 390 | 0 |
| C | 0 | 390 | 0 |
| D | 0 | 390 | 0 |
| Mode M0 | |||
|---|---|---|---|
| Quadrant | BADHDUFLAG | Total packets | Discarded packets |
| A | 0 | 39305 | 4 |
| B | 0 | 43018 | 4 |
| C | 0 | 39817 | 4 |
| D | 0 | 60535 | 5 |
| Mode M9 | |||
|---|---|---|---|
| Quadrant | BADHDUFLAG | Total packets | Discarded packets |
| A | 0 | 21 | 0 |
| B | 0 | 21 | 0 |
| C | 0 | 21 | 0 |
| D | 0 | 21 | 0 |
| Quadrant | Total seconds | Saturated seconds | Saturation percentage |
|---|---|---|---|
| A | 19087 | 117 | 0.612983% |
| B | 19088 | 424 | 2.221291% |
| C | 19088 | 304 | 1.592624% |
| D | 19087 | 1573 | 8.241211% |
Noise dominated data is calculated using 1-second bins in cleaned event files. If a bin has >2000 counts, and if more than 50% of those come from <1% of pixels, then it is considered to be noise-dominated and hence unusable.
| Quadrant | # 1 sec bins | Bins with >0 counts | Bins with >2000 counts | High rate bins dominated by noise | Noise dominated (total time) | Noise dominated (detector-on time) | Marked lightcurve |
|---|---|---|---|---|---|---|---|
| A | 21262 | 19091 | 0 | 0 | 0.00% | 0.00% | 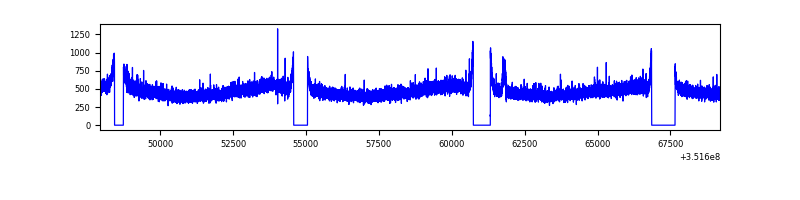 |
| B | 21263 | 19092 | 114 | 114 | 0.54% | 0.60% | 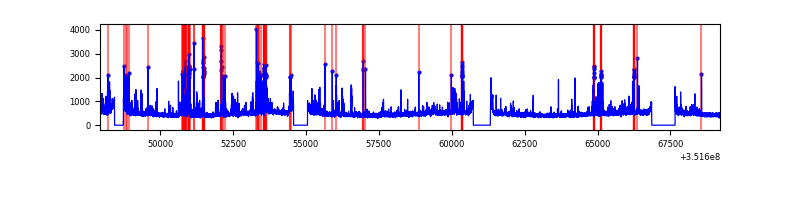 |
| C | 21263 | 19092 | 0 | 0 | 0.00% | 0.00% |  |
| D | 21262 | 19091 | 1029 | 1029 | 4.84% | 5.39% | 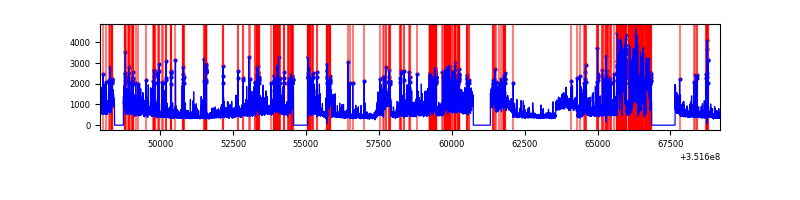 |
Top three noisy pixels from each quadrant. If the there are fewer than three noisy pixels in the level2.evt file, extra rows are filled as -1
| Pixel properties | Quadrant properties | ||||||
|---|---|---|---|---|---|---|---|
| Quadrant | DetID | PixID | Counts | Sigma | Mean | Median | Sigma |
| A | 0 | 13 | 90123 | 192.48 | 2277 | 2220 | 456.7 |
| A | 13 | 254 | 37894 | 78.12 | 2277 | 2220 | 456.7 |
| A | 1 | 113 | 30071 | 60.99 | 2277 | 2220 | 456.7 |
| B | 0 | 229 | 553072 | 1289.29 | 2253 | 2193 | 427.3 |
| B | 10 | 245 | 362163 | 842.48 | 2253 | 2193 | 427.3 |
| B | 10 | 246 | 322669 | 750.05 | 2253 | 2193 | 427.3 |
| C | 14 | 238 | 353659 | 689.02 | 2191 | 2200 | 510.1 |
| C | 3 | 233 | 321110 | 625.21 | 2191 | 2200 | 510.1 |
| C | 2 | 114 | 44983 | 83.87 | 2191 | 2200 | 510.1 |
| D | 1 | 52 | 4905371 | 9828.42 | 2119 | 2060 | 498.9 |
| D | 8 | 195 | 2268880 | 4543.72 | 2119 | 2060 | 498.9 |
| D | 2 | 250 | 155178 | 306.92 | 2119 | 2060 | 498.9 |
Histogram calculated using DETX and DETY for each event in the final _common_clean file
| Quadrant A |  |
 |
Quadrant B |
|---|---|---|---|
| Quadrant D |  |
 |
Quadrant C |
| Plot type | Count rate plots | Images |
|---|---|---|
| Comparison with Poisson distribution Blue bars denote a histogram of data divided into 1 sec bins. Red curve is a Poisson curve with rate = median count rate of data. |
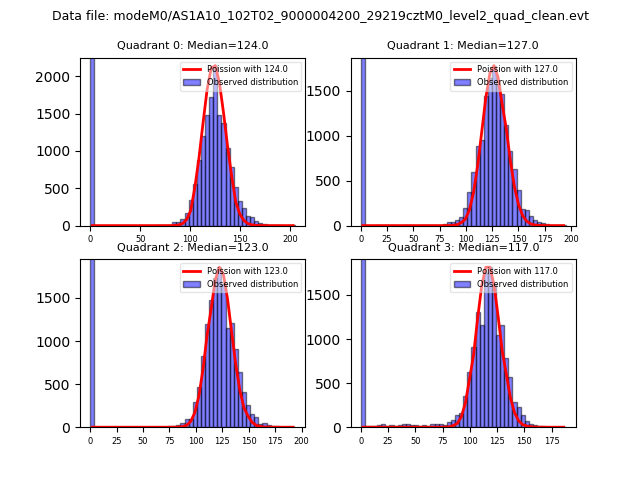 |
 |
| Quadrant-wise count rates Data is divided into 100 sec bins |
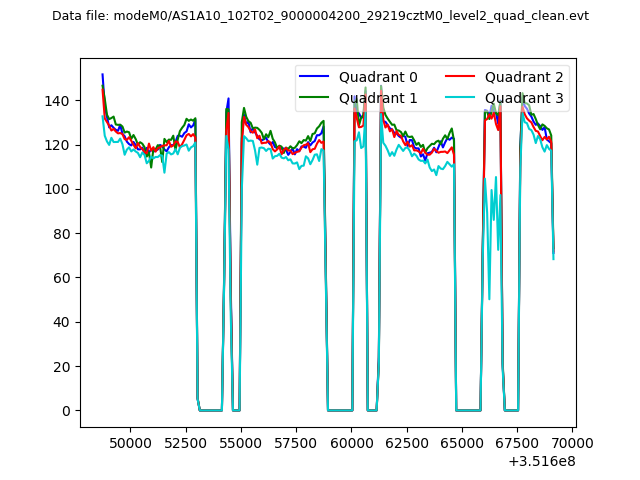 |
|
| Module-wise count rates for Quadrant A Data is divided into 100 sec bins |
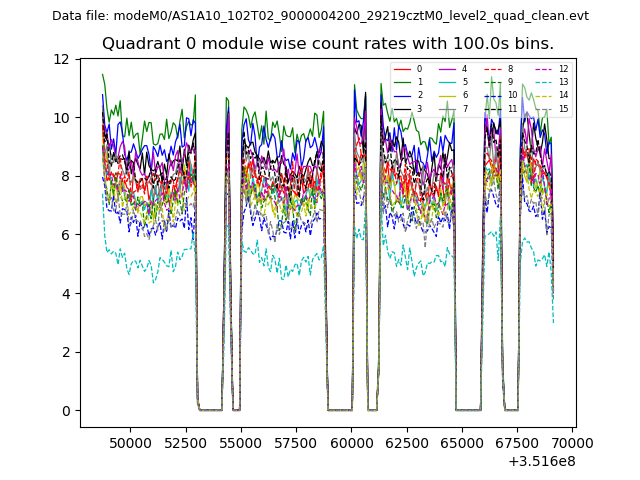 |
 |
| Module-wise count rates for Quadrant B Data is divided into 100 sec bins |
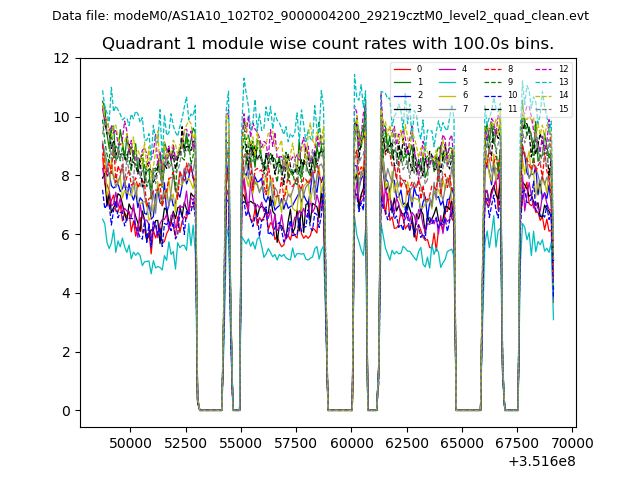 |
 |
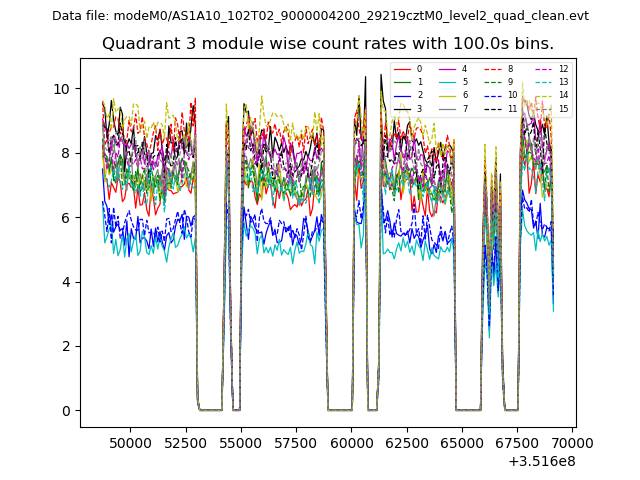
| Module-wise count rates for Quadrant C Data is divided into 100 sec bins |
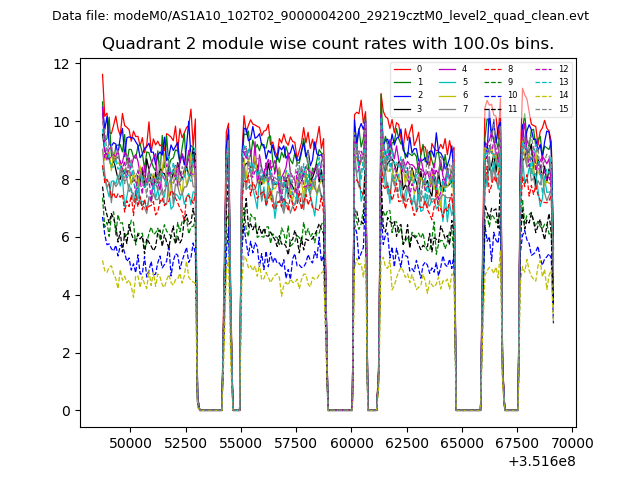 |
 |
| Module-wise count rates for Quadrant D Data is divided into 100 sec bins |
 |
 |
| Parameter | Plot |
|---|---|
| CZT HV Monitor | 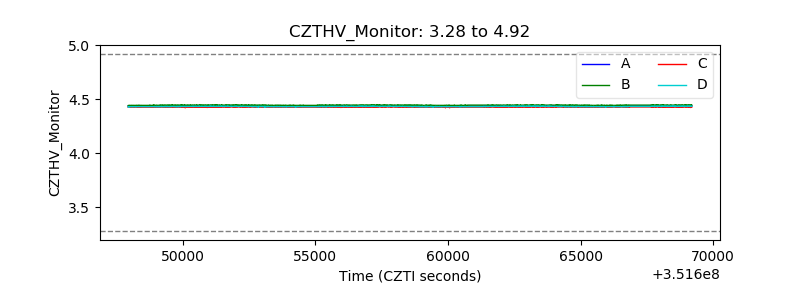 |
| D_VDD |  |
| Temperature 1 |  |
| Veto HV Monitor |  |
| Veto LLD |  |
| Alpha Counter | 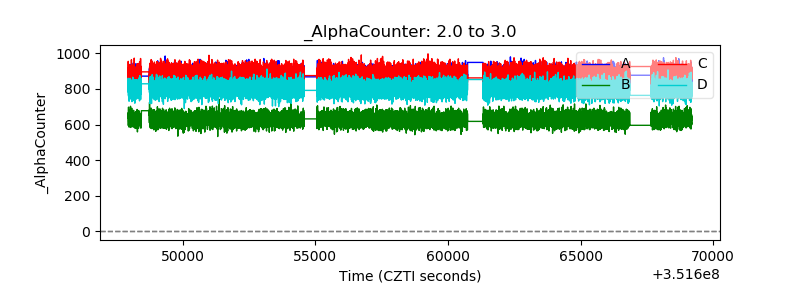 |
| _CPM_Rate | 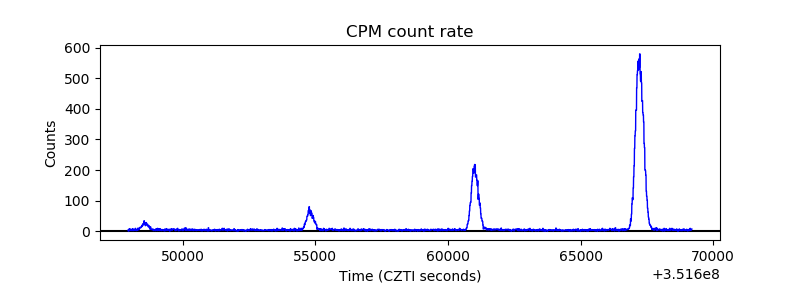 |
| CZT Counter |  |
| +2.5 Volts monitor |  |
| +5 Volts monitor |  |
| _ROLL_ROT | 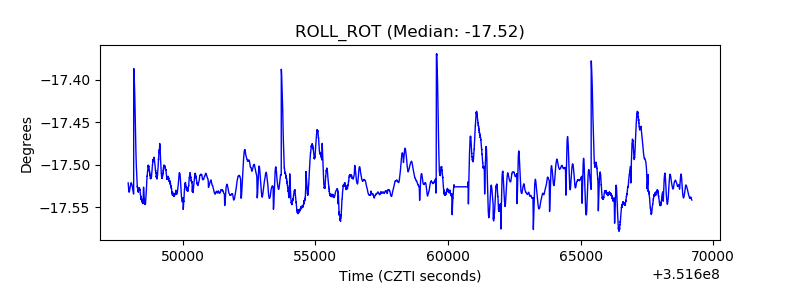 |
| _Roll_DEC |  |
| _Roll_RA |  |
| Veto Counter | 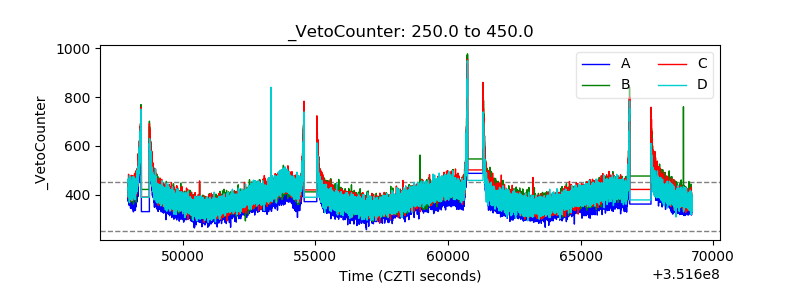 |