| Param | Original file | Final file |
|---|---|---|
| Filename | modeM0/AS1A10_102T02_9000004200_29220cztM0_level2.evt | modeM0/AS1A10_102T02_9000004200_29220cztM0_level2_quad_clean.evt |
| Size (bytes) | 472,533,120 | 105,978,240 |
| Size | 450.6 MB | 101.1 MB |
| Events in quadrant A | 3,060,065 | 700,205 |
| Events in quadrant B | 3,470,840 | 709,936 |
| Events in quadrant C | 3,224,676 | 679,257 |
| Events in quadrant D | 4,108,122 | 661,360 |
| Mode SS | |||
|---|---|---|---|
| Quadrant | BADHDUFLAG | Total packets | Discarded packets |
| A | 0 | 134 | 0 |
| B | 0 | 134 | 0 |
| C | 0 | 134 | 0 |
| D | 0 | 134 | 0 |
| Mode M0 | |||
|---|---|---|---|
| Quadrant | BADHDUFLAG | Total packets | Discarded packets |
| A | 0 | 13345 | 1 |
| B | 0 | 14547 | 1 |
| C | 0 | 13760 | 1 |
| D | 0 | 16512 | 1 |
| Mode M9 | |||
|---|---|---|---|
| Quadrant | BADHDUFLAG | Total packets | Discarded packets |
| A | 0 | 9 | 0 |
| B | 0 | 9 | 0 |
| C | 0 | 9 | 0 |
| D | 0 | 9 | 0 |
| Quadrant | Total seconds | Saturated seconds | Saturation percentage |
|---|---|---|---|
| A | 6578 | 39 | 0.592885% |
| B | 6579 | 111 | 1.687187% |
| C | 6579 | 71 | 1.079191% |
| D | 6579 | 145 | 2.203982% |
Noise dominated data is calculated using 1-second bins in cleaned event files. If a bin has >2000 counts, and if more than 50% of those come from <1% of pixels, then it is considered to be noise-dominated and hence unusable.
| Quadrant | # 1 sec bins | Bins with >0 counts | Bins with >2000 counts | High rate bins dominated by noise | Noise dominated (total time) | Noise dominated (detector-on time) | Marked lightcurve |
|---|---|---|---|---|---|---|---|
| A | 7528 | 6579 | 0 | 0 | 0.00% | 0.00% | 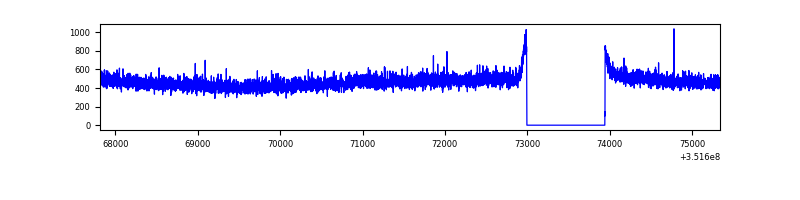 |
| B | 7529 | 6580 | 44 | 44 | 0.58% | 0.67% | 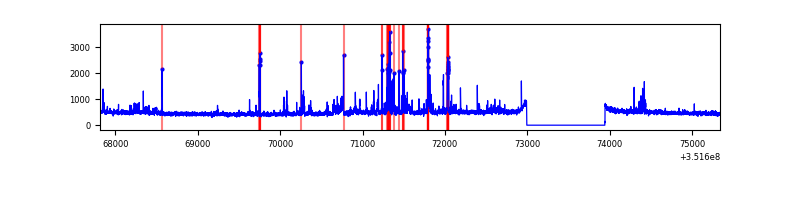 |
| C | 7529 | 6580 | 0 | 0 | 0.00% | 0.00% | 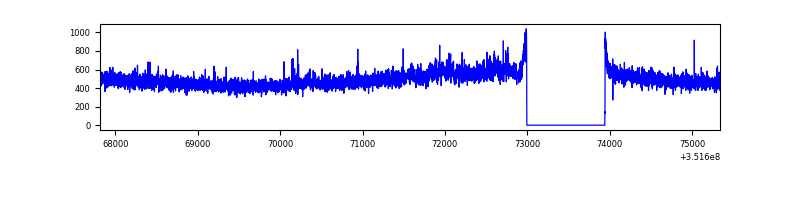 |
| D | 7529 | 6580 | 117 | 117 | 1.55% | 1.78% | 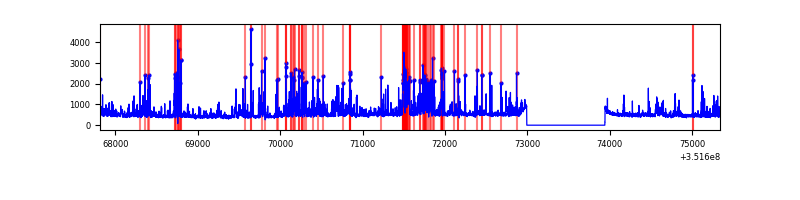 |
Top three noisy pixels from each quadrant. If the there are fewer than three noisy pixels in the level2.evt file, extra rows are filled as -1
| Pixel properties | Quadrant properties | ||||||
|---|---|---|---|---|---|---|---|
| Quadrant | DetID | PixID | Counts | Sigma | Mean | Median | Sigma |
| A | 0 | 13 | 13677 | 82.02 | 788 | 771 | 157.3 |
| A | 13 | 254 | 13142 | 78.62 | 788 | 771 | 157.3 |
| A | 3 | 137 | 7803 | 44.69 | 788 | 771 | 157.3 |
| B | 0 | 229 | 299659 | 2007.05 | 776 | 756 | 148.9 |
| B | 10 | 245 | 89227 | 594.06 | 776 | 756 | 148.9 |
| B | 0 | 183 | 30786 | 201.64 | 776 | 756 | 148.9 |
| C | 3 | 233 | 155017 | 889.81 | 747 | 751 | 173.4 |
| C | 14 | 238 | 129694 | 743.75 | 747 | 751 | 173.4 |
| C | 2 | 114 | 15386 | 84.41 | 747 | 751 | 173.4 |
| D | 1 | 52 | 881673 | 4986.91 | 750 | 729 | 176.7 |
| D | 8 | 195 | 174559 | 984.03 | 750 | 729 | 176.7 |
| D | 2 | 250 | 82927 | 465.31 | 750 | 729 | 176.7 |
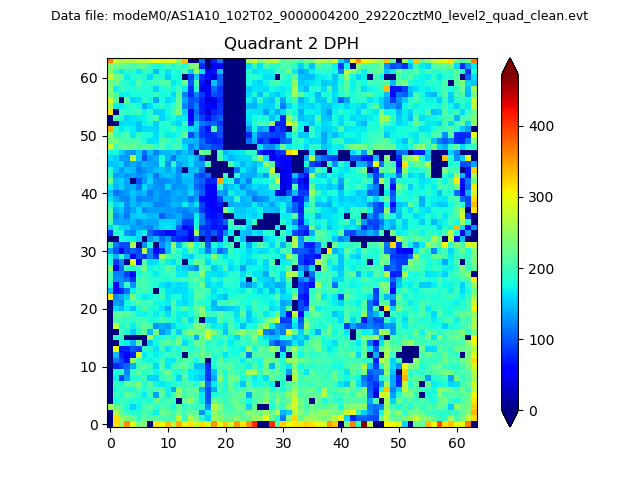
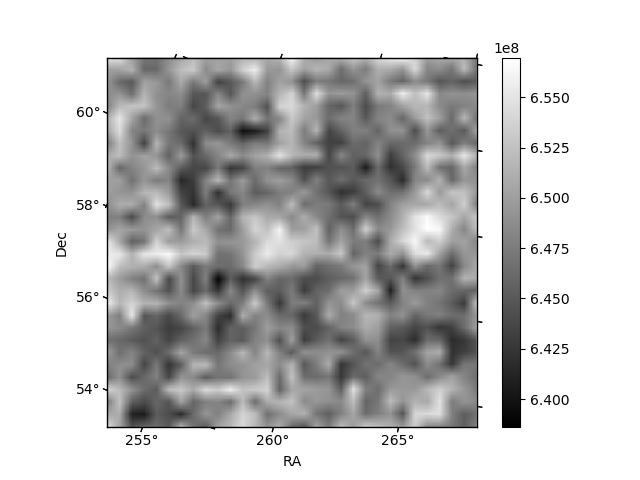
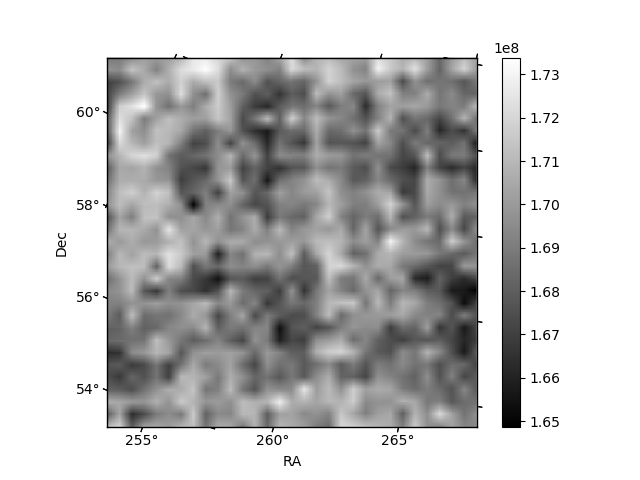
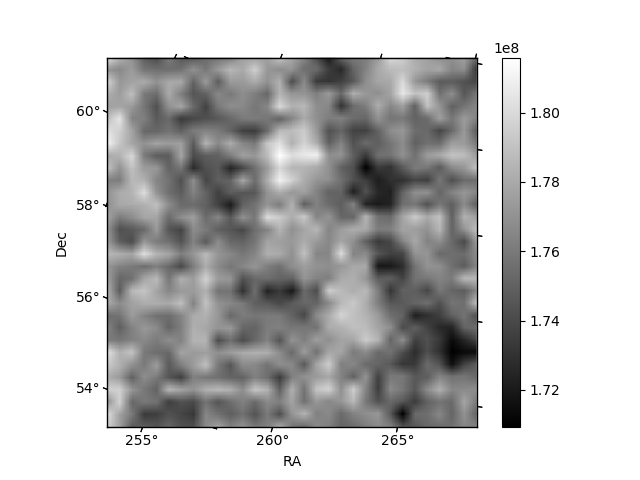
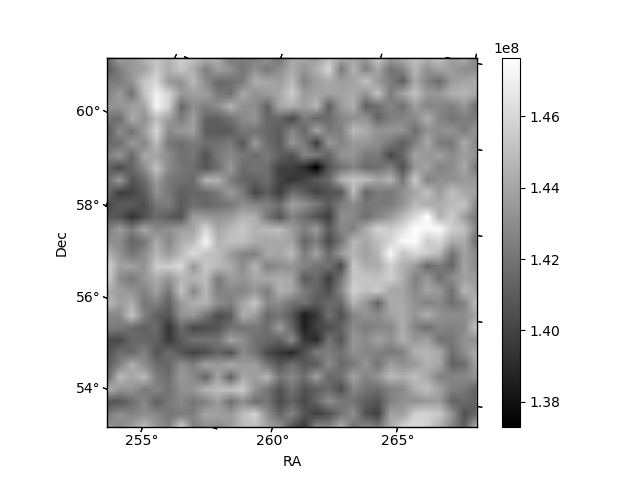
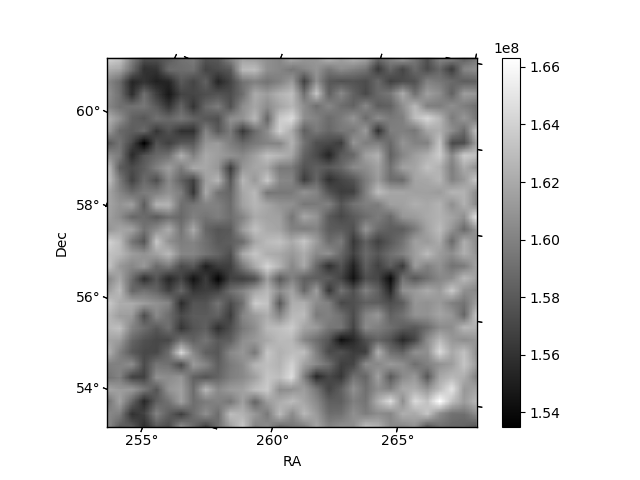
Histogram calculated using DETX and DETY for each event in the final _common_clean file
| Quadrant A | 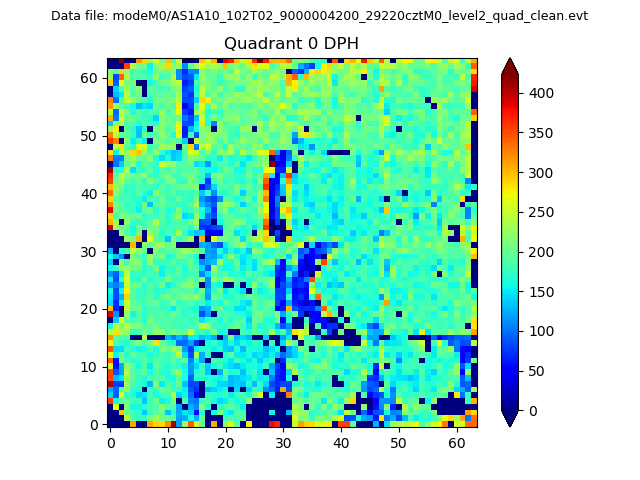 |
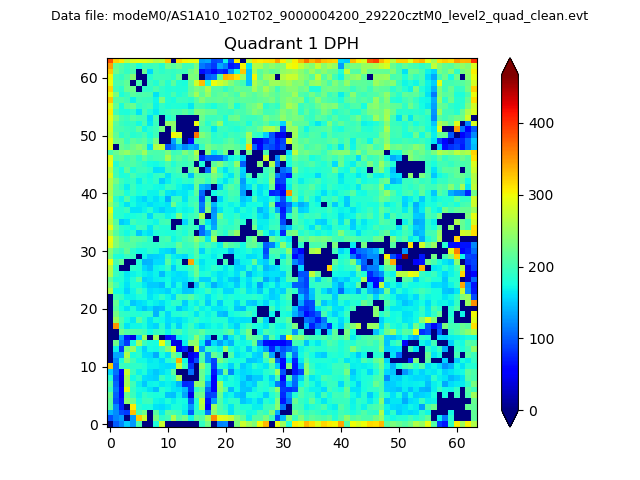 |
Quadrant B |
|---|---|---|---|
| Quadrant D | 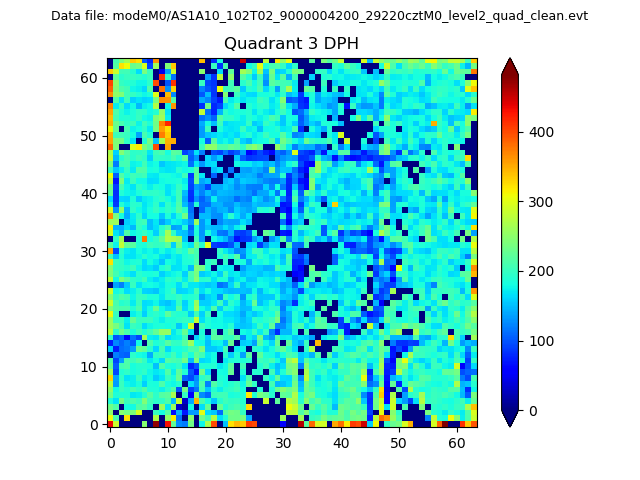 |
 |
Quadrant C |
| Plot type | Count rate plots | Images |
|---|---|---|
| Comparison with Poisson distribution Blue bars denote a histogram of data divided into 1 sec bins. Red curve is a Poisson curve with rate = median count rate of data. |
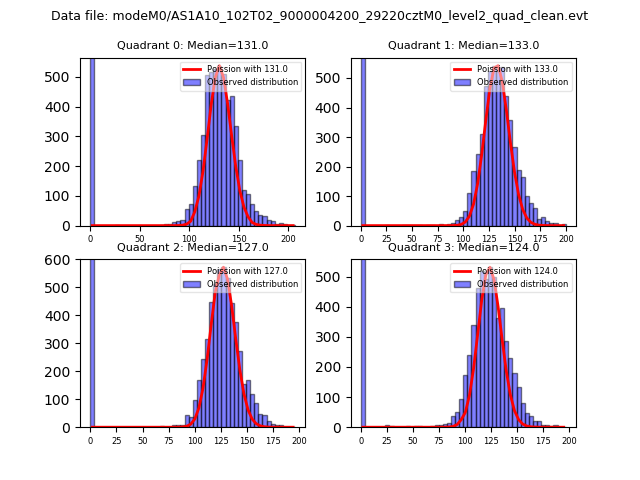 |
 |
| Quadrant-wise count rates Data is divided into 100 sec bins |
 |
|
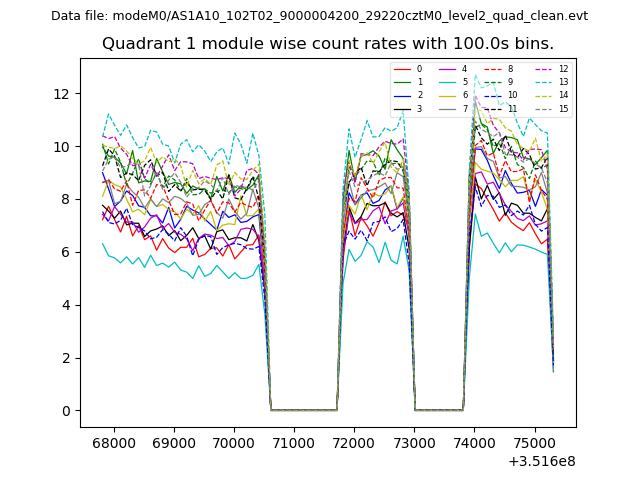
| Module-wise count rates for Quadrant A Data is divided into 100 sec bins |
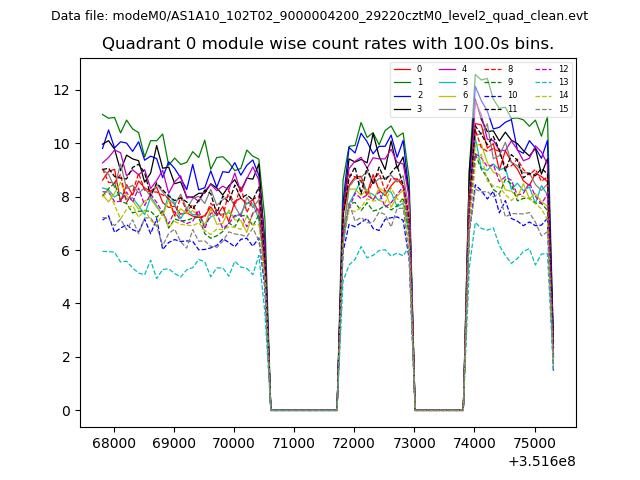 |
 |
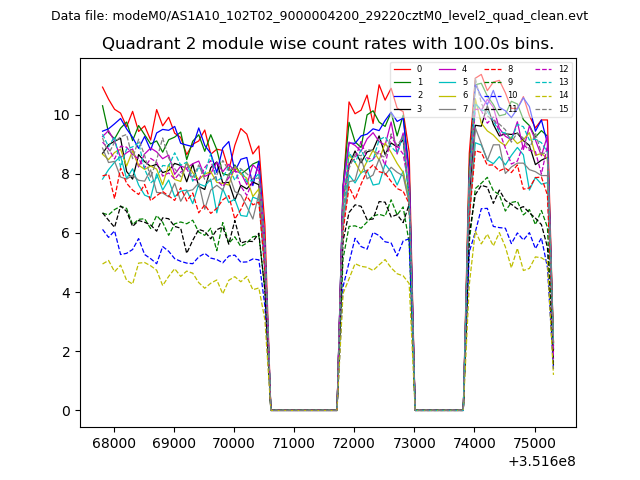
| Module-wise count rates for Quadrant B Data is divided into 100 sec bins |
 |
 |
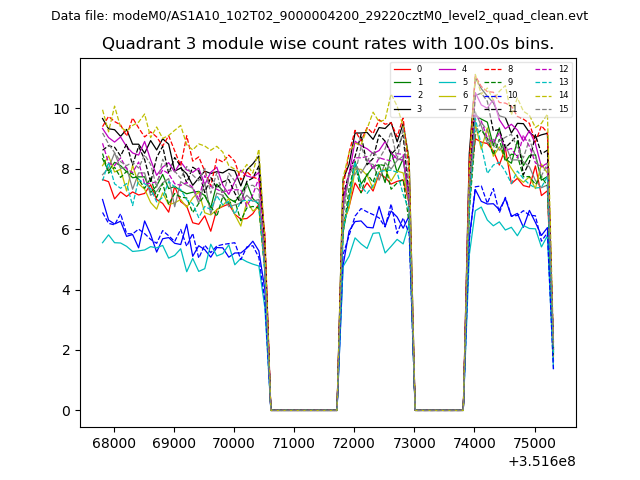
| Module-wise count rates for Quadrant C Data is divided into 100 sec bins |
 |
 |
| Module-wise count rates for Quadrant D Data is divided into 100 sec bins |
 |
 |
| Parameter | Plot |
|---|---|
| CZT HV Monitor | 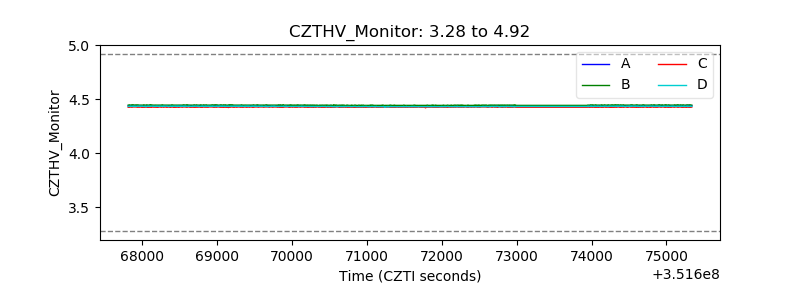 |
| D_VDD | 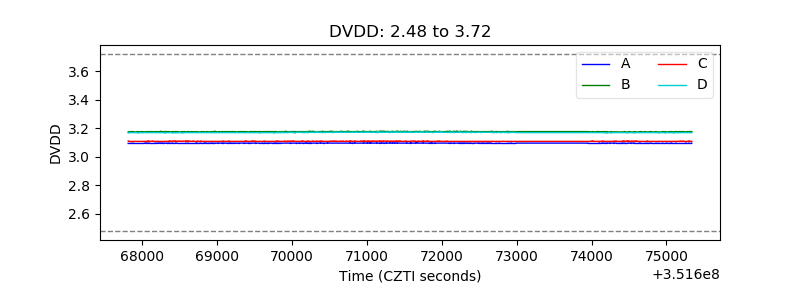 |
| Temperature 1 | 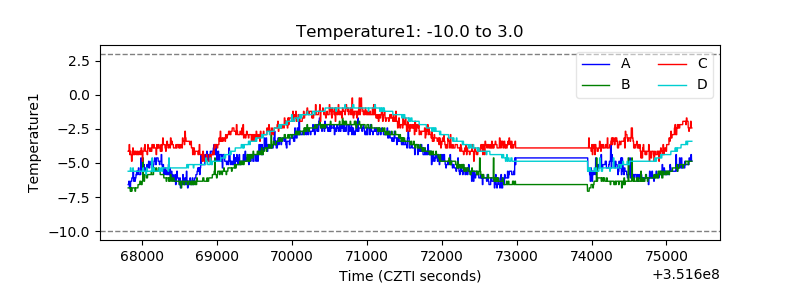 |
| Veto HV Monitor | 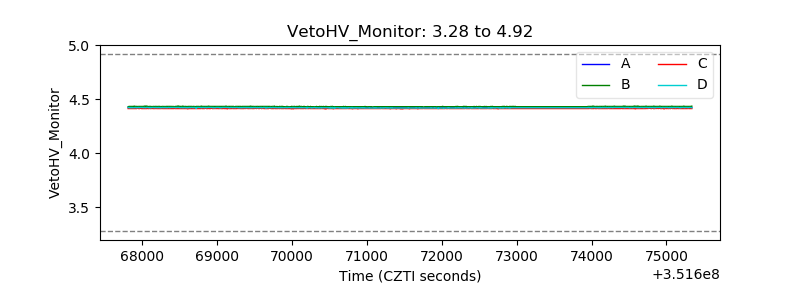 |
| Veto LLD | 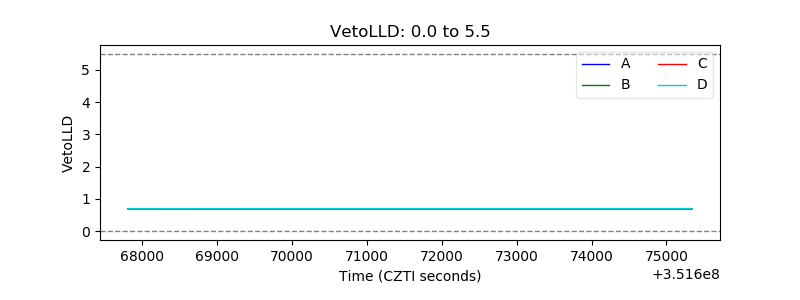 |
| Alpha Counter | 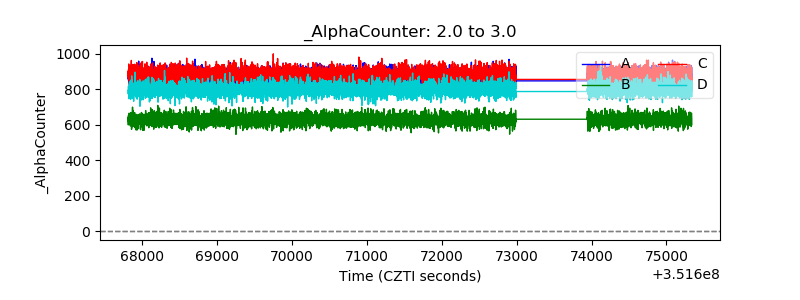 |
| _CPM_Rate | 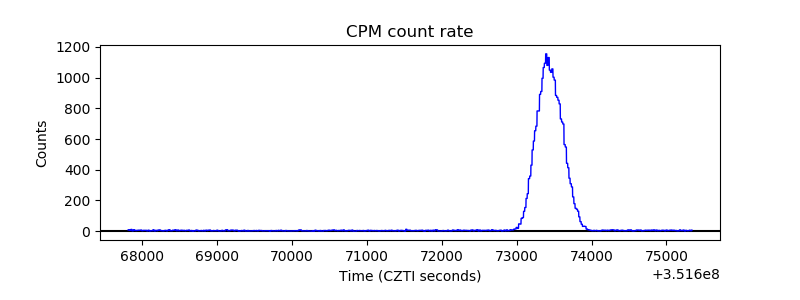 |
| CZT Counter | 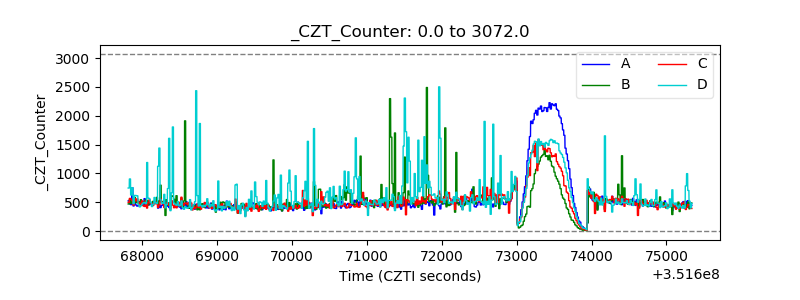 |
| +2.5 Volts monitor |  |
| +5 Volts monitor |  |
| _ROLL_ROT | 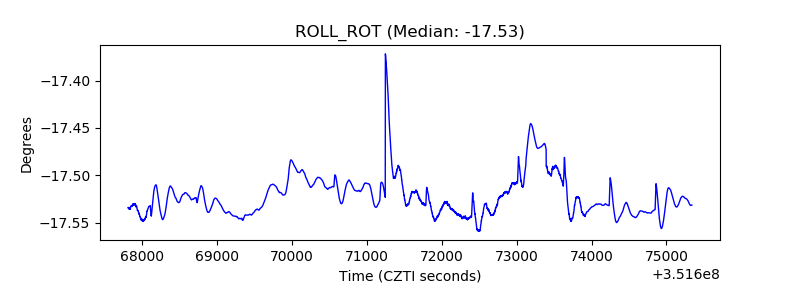 |
| _Roll_DEC | 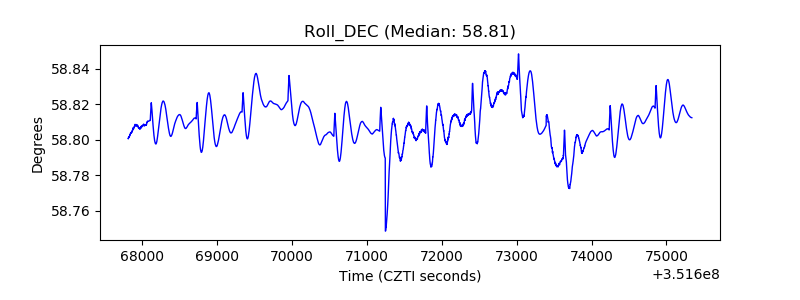 |
| _Roll_RA | 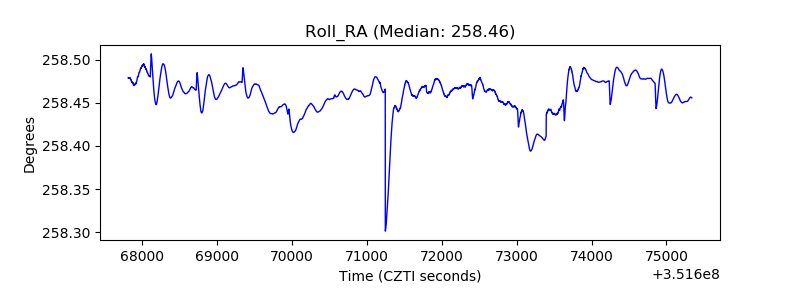 |
| Veto Counter | 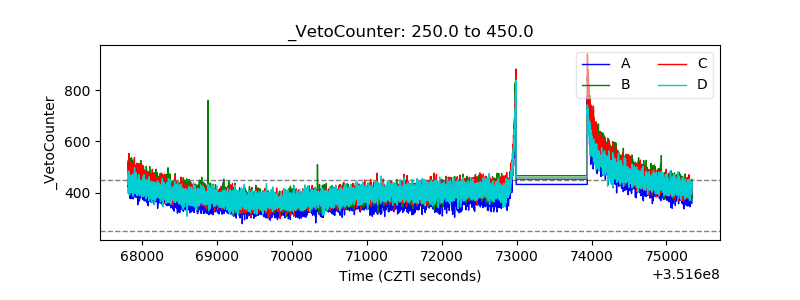 |