| Param | Original file | Final file |
|---|---|---|
| Filename | modeM0/AS1A10_102T02_9000004200_29222cztM0_level2.evt | modeM0/AS1A10_102T02_9000004200_29222cztM0_level2_quad_clean.evt |
| Size (bytes) | 467,832,960 | 110,016,000 |
| Size | 446.2 MB | 104.9 MB |
| Events in quadrant A | 3,113,758 | 738,120 |
| Events in quadrant B | 3,337,710 | 741,336 |
| Events in quadrant C | 3,308,605 | 706,152 |
| Events in quadrant D | 3,968,820 | 695,084 |
| Mode SS | |||
|---|---|---|---|
| Quadrant | BADHDUFLAG | Total packets | Discarded packets |
| A | 0 | 132 | 0 |
| B | 0 | 132 | 0 |
| C | 0 | 132 | 0 |
| D | 0 | 132 | 0 |
| Mode M0 | |||
|---|---|---|---|
| Quadrant | BADHDUFLAG | Total packets | Discarded packets |
| A | 0 | 13258 | 1 |
| B | 0 | 13914 | 1 |
| C | 0 | 13626 | 1 |
| D | 0 | 15921 | 1 |
| Mode M9 | |||
|---|---|---|---|
| Quadrant | BADHDUFLAG | Total packets | Discarded packets |
| A | 0 | 11 | 0 |
| B | 0 | 11 | 0 |
| C | 0 | 11 | 0 |
| D | 0 | 11 | 0 |
| Quadrant | Total seconds | Saturated seconds | Saturation percentage |
|---|---|---|---|
| A | 6468 | 27 | 0.417440% |
| B | 6468 | 64 | 0.989487% |
| C | 6468 | 77 | 1.190476% |
| D | 6468 | 93 | 1.437848% |
Noise dominated data is calculated using 1-second bins in cleaned event files. If a bin has >2000 counts, and if more than 50% of those come from <1% of pixels, then it is considered to be noise-dominated and hence unusable.
| Quadrant | # 1 sec bins | Bins with >0 counts | Bins with >2000 counts | High rate bins dominated by noise | Noise dominated (total time) | Noise dominated (detector-on time) | Marked lightcurve |
|---|---|---|---|---|---|---|---|
| A | 7568 | 6469 | 0 | 0 | 0.00% | 0.00% | 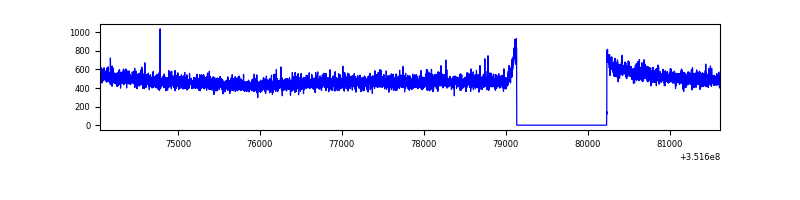 |
| B | 7568 | 6469 | 19 | 19 | 0.25% | 0.29% | 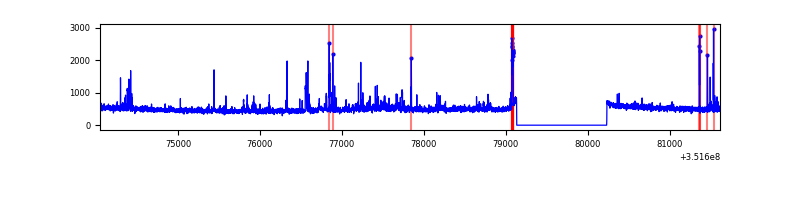 |
| C | 7568 | 6469 | 0 | 0 | 0.00% | 0.00% | 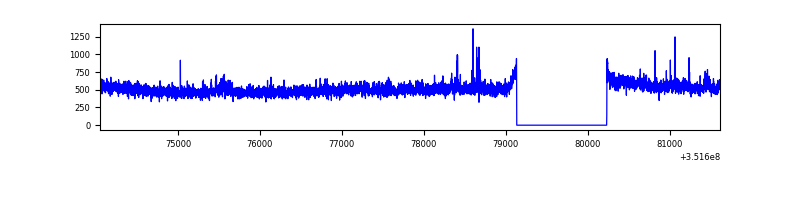 |
| D | 7568 | 6469 | 71 | 71 | 0.94% | 1.10% | 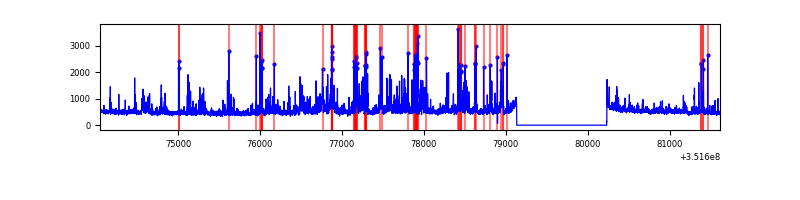 |
Top three noisy pixels from each quadrant. If the there are fewer than three noisy pixels in the level2.evt file, extra rows are filled as -1
| Pixel properties | Quadrant properties | ||||||
|---|---|---|---|---|---|---|---|
| Quadrant | DetID | PixID | Counts | Sigma | Mean | Median | Sigma |
| A | 13 | 254 | 11896 | 69.33 | 805 | 789 | 160.2 |
| A | 3 | 137 | 7765 | 43.54 | 805 | 789 | 160.2 |
| A | 0 | 13 | 6722 | 37.03 | 805 | 789 | 160.2 |
| B | 0 | 229 | 130772 | 875.61 | 787 | 769 | 148.5 |
| B | 0 | 183 | 60971 | 405.48 | 787 | 769 | 148.5 |
| B | 0 | 190 | 33571 | 220.93 | 787 | 769 | 148.5 |
| C | 3 | 233 | 192360 | 1099.78 | 755 | 757 | 174.2 |
| C | 14 | 238 | 137768 | 786.43 | 755 | 757 | 174.2 |
| C | 14 | 254 | 19819 | 109.41 | 755 | 757 | 174.2 |
| D | 1 | 52 | 713688 | 3932.6 | 767 | 748 | 181.3 |
| D | 8 | 195 | 125338 | 687.24 | 767 | 748 | 181.3 |
| D | 13 | 153 | 65444 | 356.87 | 767 | 748 | 181.3 |
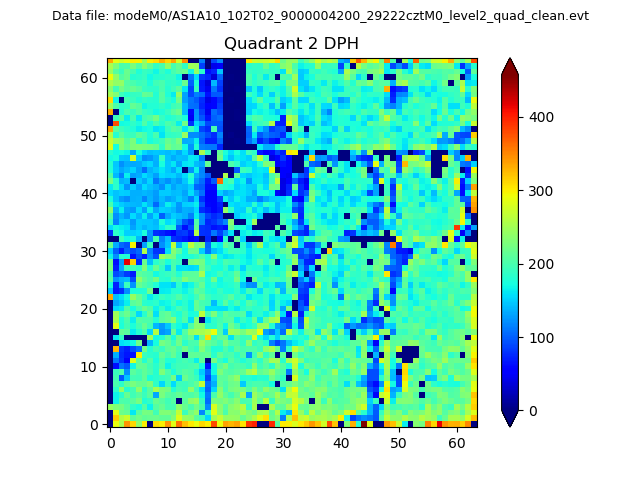
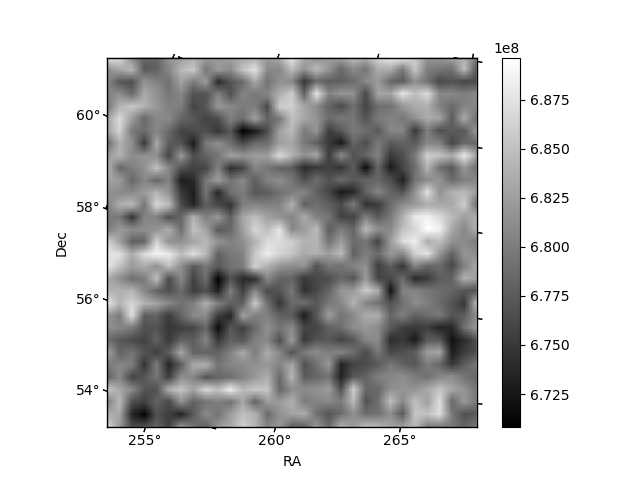
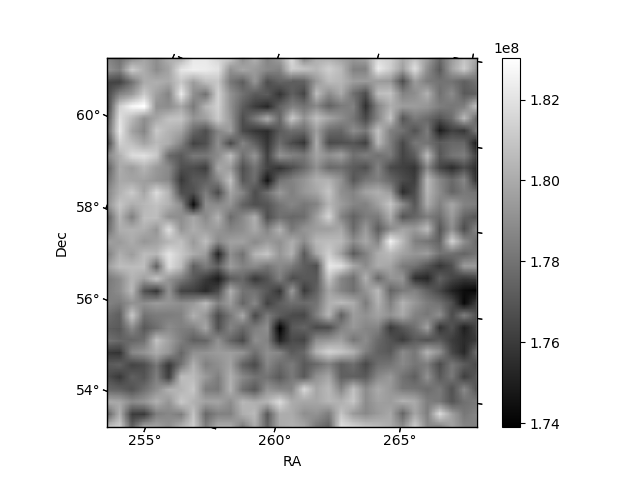
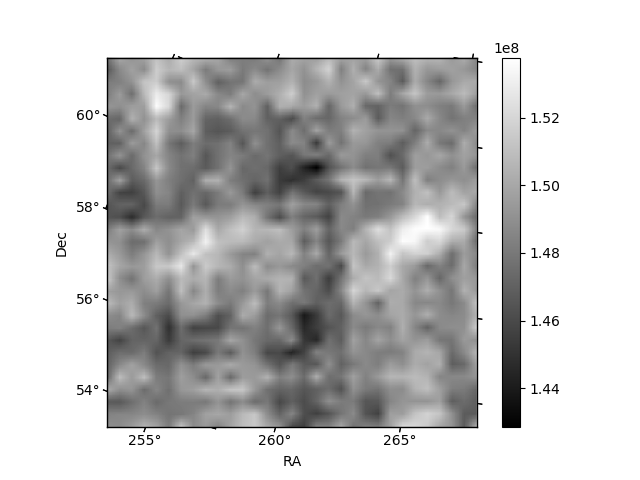
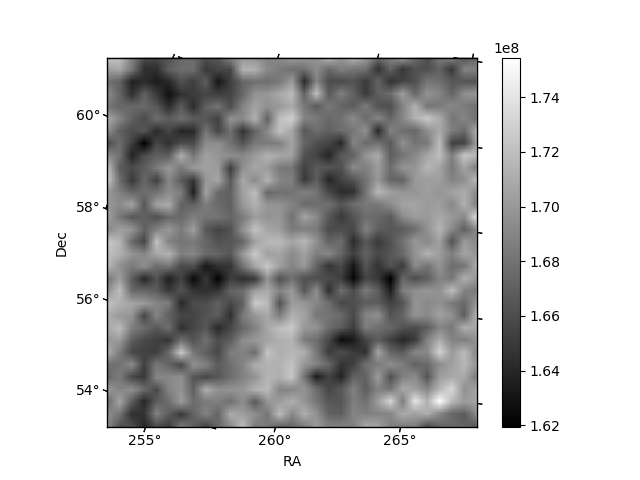
Histogram calculated using DETX and DETY for each event in the final _common_clean file
| Quadrant A | 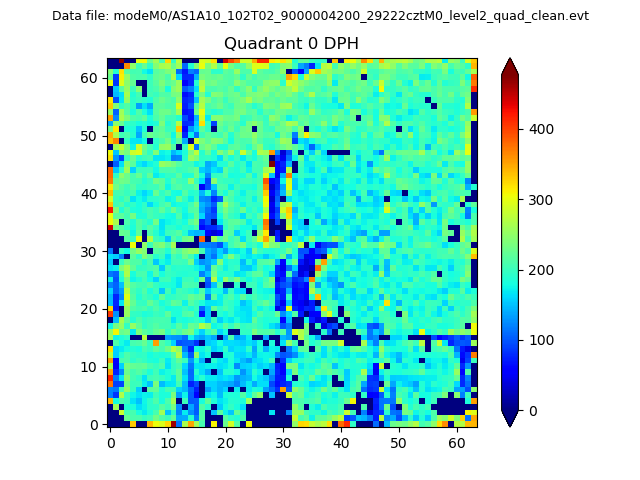 |
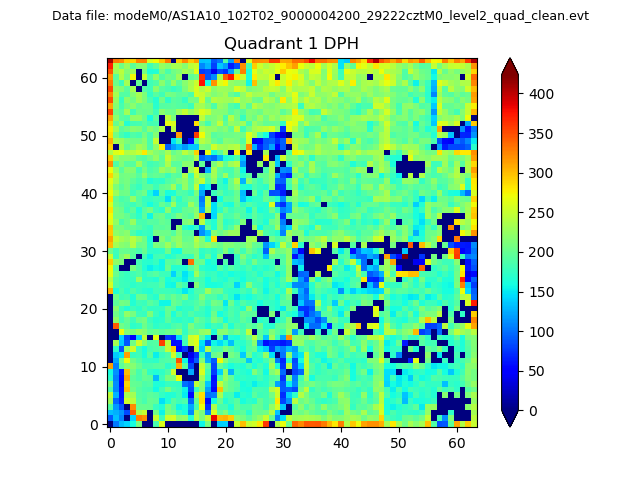 |
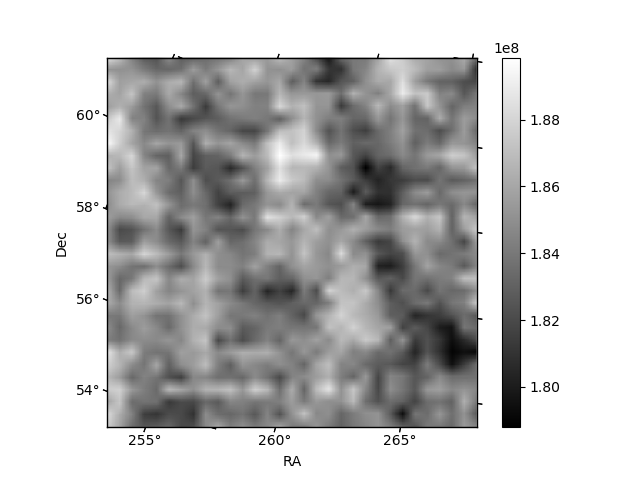
Quadrant B |
|---|---|---|---|
| Quadrant D | 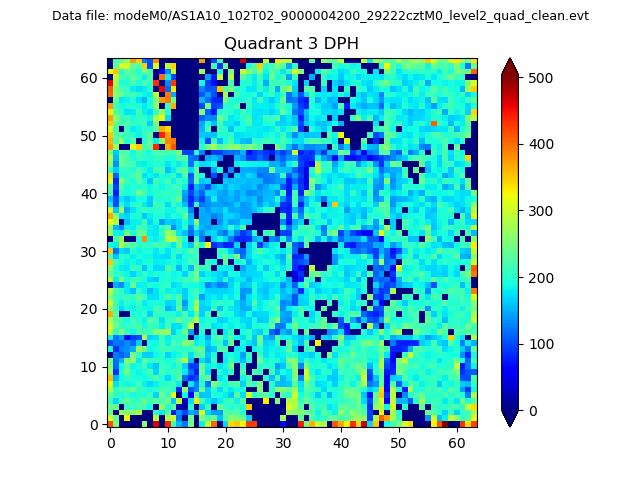 |
 |
Quadrant C |
| Plot type | Count rate plots | Images |
|---|---|---|
| Comparison with Poisson distribution Blue bars denote a histogram of data divided into 1 sec bins. Red curve is a Poisson curve with rate = median count rate of data. |
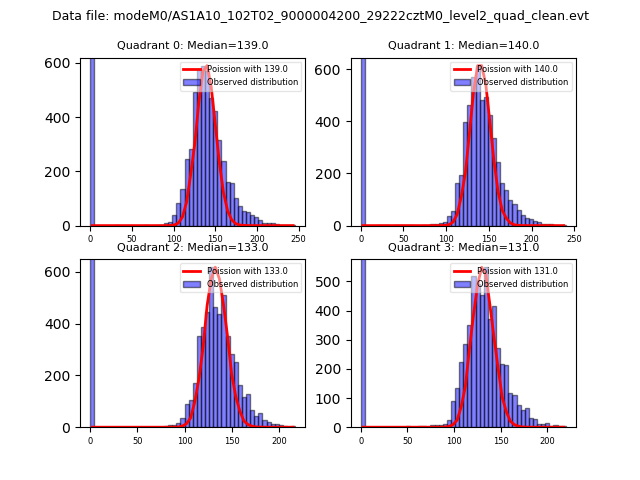 |
 |
| Quadrant-wise count rates Data is divided into 100 sec bins |
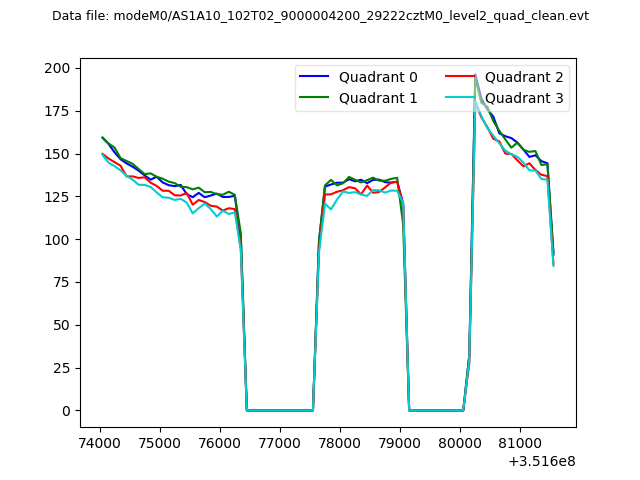 |
|
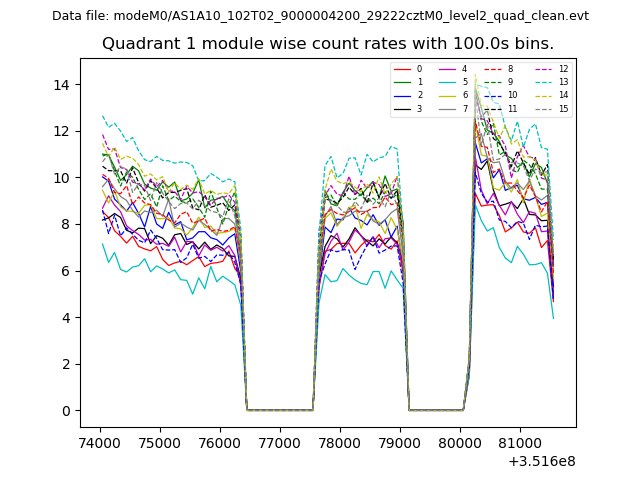
| Module-wise count rates for Quadrant A Data is divided into 100 sec bins |
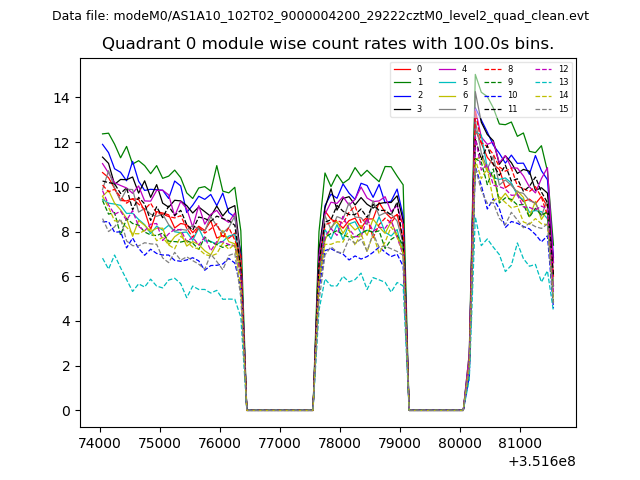 |
 |
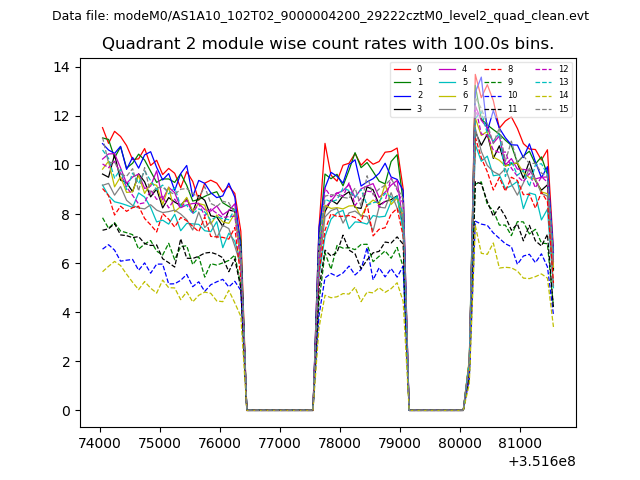
| Module-wise count rates for Quadrant B Data is divided into 100 sec bins |
 |
 |
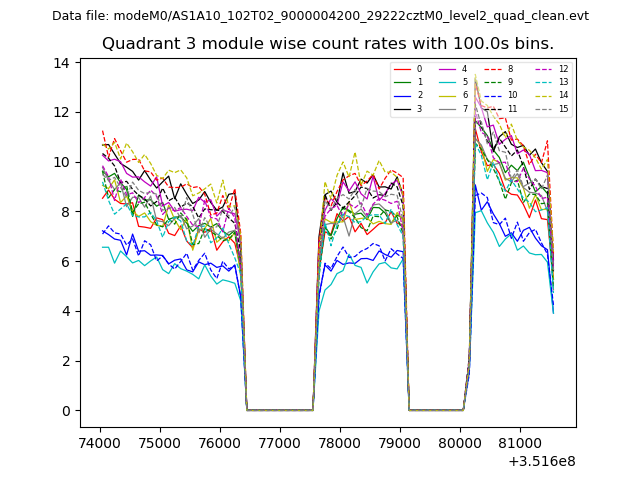
| Module-wise count rates for Quadrant C Data is divided into 100 sec bins |
 |
 |
| Module-wise count rates for Quadrant D Data is divided into 100 sec bins |
 |
 |
| Parameter | Plot |
|---|---|
| CZT HV Monitor | 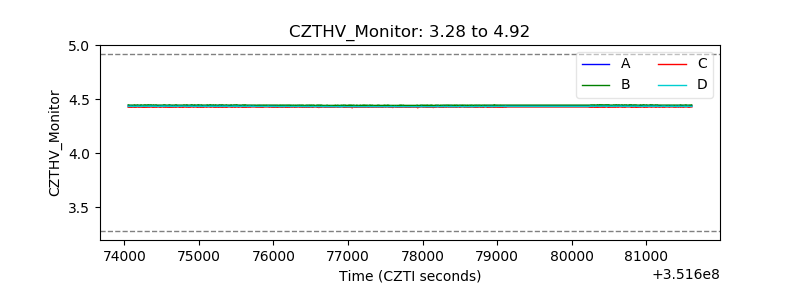 |
| D_VDD | 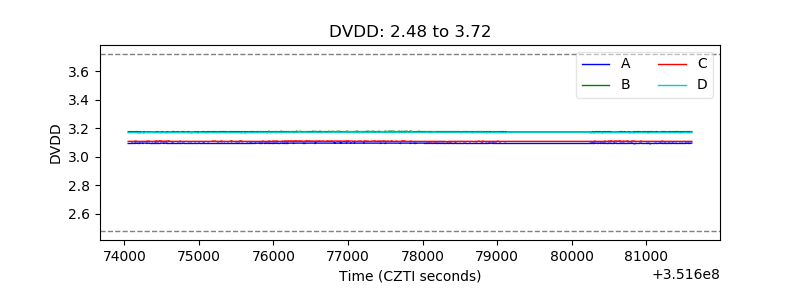 |
| Temperature 1 | 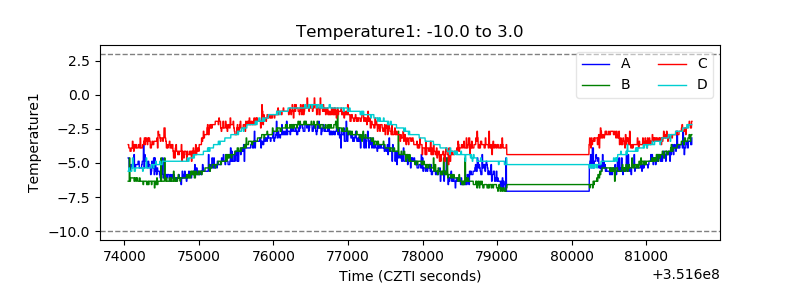 |
| Veto HV Monitor | 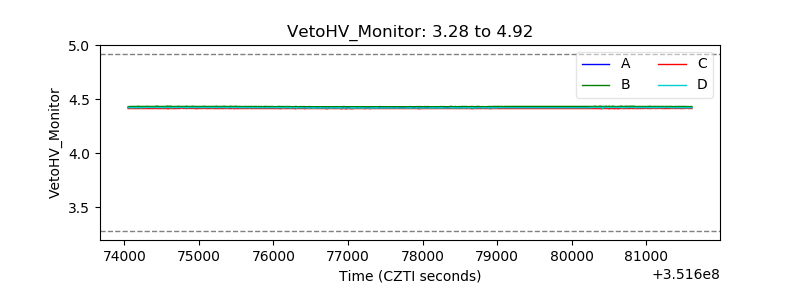 |
| Veto LLD | 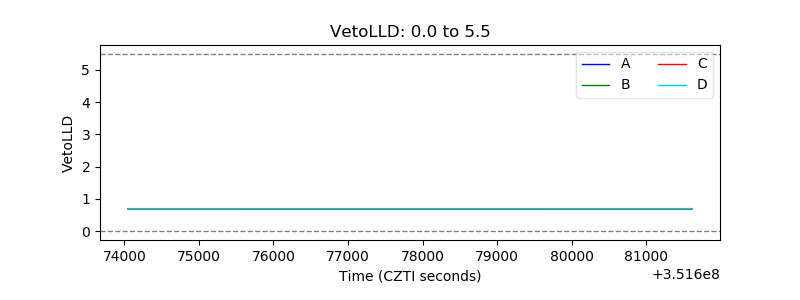 |
| Alpha Counter | 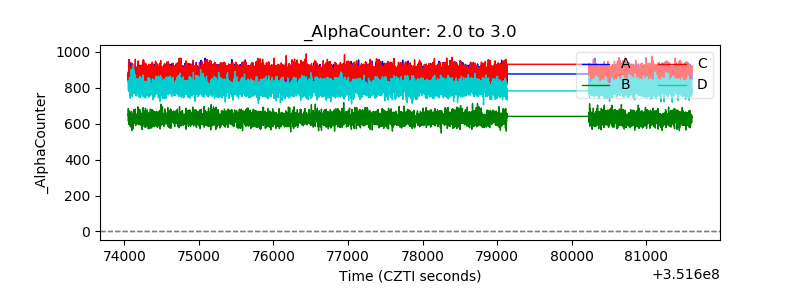 |
| _CPM_Rate | 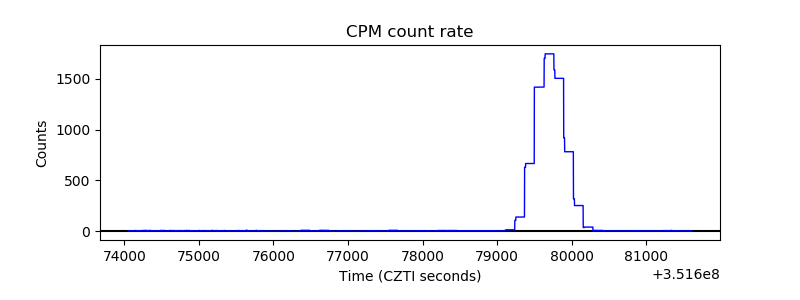 |
| CZT Counter | 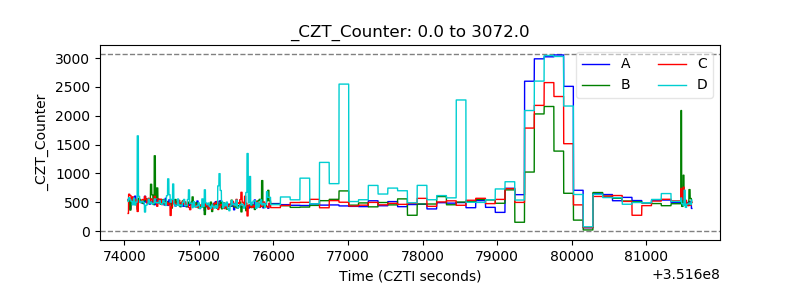 |
| +2.5 Volts monitor |  |
| +5 Volts monitor |  |
| _ROLL_ROT |  |
| _Roll_DEC | 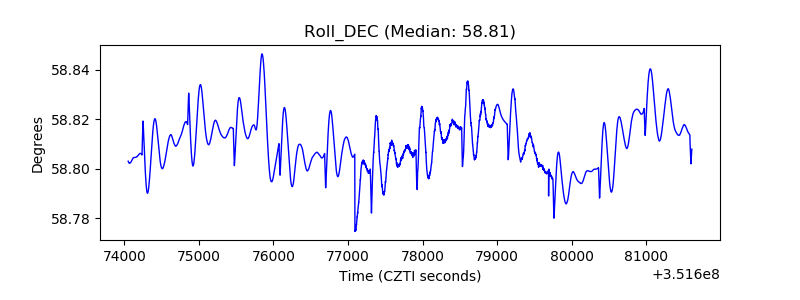 |
| _Roll_RA | 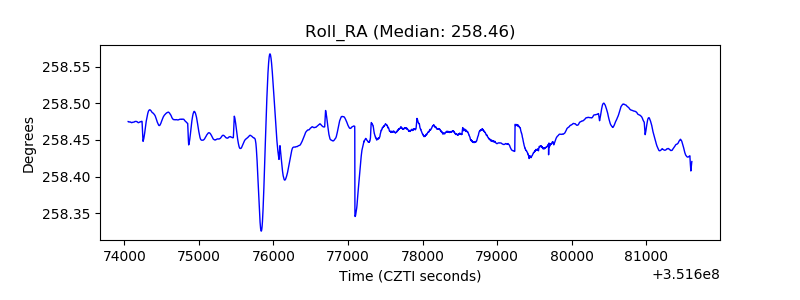 |
| Veto Counter | 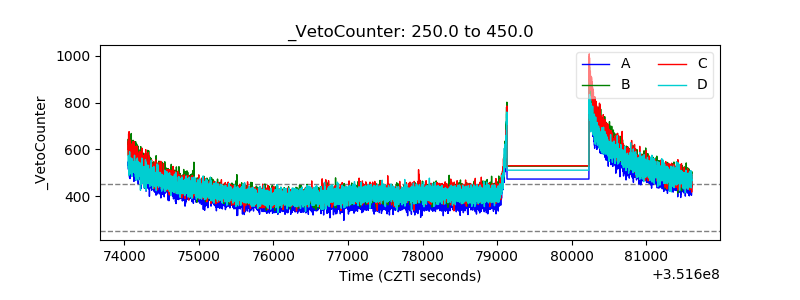 |