| Param | Original file | Final file |
|---|---|---|
| Filename | modeM0/AS1A10_102T02_9000004200_29223cztM0_level2.evt | modeM0/AS1A10_102T02_9000004200_29223cztM0_level2_quad_clean.evt |
| Size (bytes) | 496,889,280 | 108,195,840 |
| Size | 473.9 MB | 103.2 MB |
| Events in quadrant A | 3,070,484 | 736,553 |
| Events in quadrant B | 4,009,107 | 731,730 |
| Events in quadrant C | 3,181,447 | 701,970 |
| Events in quadrant D | 4,373,847 | 680,872 |
| Mode SS | |||
|---|---|---|---|
| Quadrant | BADHDUFLAG | Total packets | Discarded packets |
| A | 0 | 124 | 0 |
| B | 0 | 124 | 0 |
| C | 0 | 124 | 0 |
| D | 0 | 124 | 0 |
| Mode M0 | |||
|---|---|---|---|
| Quadrant | BADHDUFLAG | Total packets | Discarded packets |
| A | 0 | 12814 | 1 |
| B | 0 | 15755 | 1 |
| C | 0 | 12951 | 1 |
| D | 0 | 16937 | 1 |
| Mode M9 | |||
|---|---|---|---|
| Quadrant | BADHDUFLAG | Total packets | Discarded packets |
| A | 0 | 12 | 0 |
| B | 0 | 12 | 0 |
| C | 0 | 12 | 0 |
| D | 0 | 12 | 0 |
| Quadrant | Total seconds | Saturated seconds | Saturation percentage |
|---|---|---|---|
| A | 6096 | 51 | 0.836614% |
| B | 6097 | 226 | 3.706741% |
| C | 6097 | 89 | 1.459734% |
| D | 6097 | 242 | 3.969165% |
Noise dominated data is calculated using 1-second bins in cleaned event files. If a bin has >2000 counts, and if more than 50% of those come from <1% of pixels, then it is considered to be noise-dominated and hence unusable.
| Quadrant | # 1 sec bins | Bins with >0 counts | Bins with >2000 counts | High rate bins dominated by noise | Noise dominated (total time) | Noise dominated (detector-on time) | Marked lightcurve |
|---|---|---|---|---|---|---|---|
| A | 7291 | 6097 | 0 | 0 | 0.00% | 0.00% | 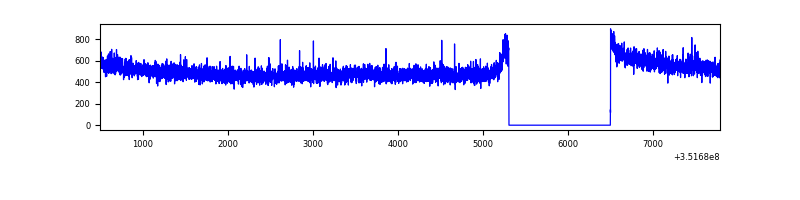 |
| B | 7292 | 6098 | 104 | 104 | 1.43% | 1.71% | 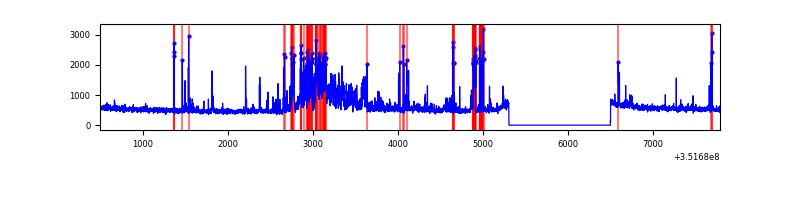 |
| C | 7292 | 6098 | 0 | 0 | 0.00% | 0.00% | 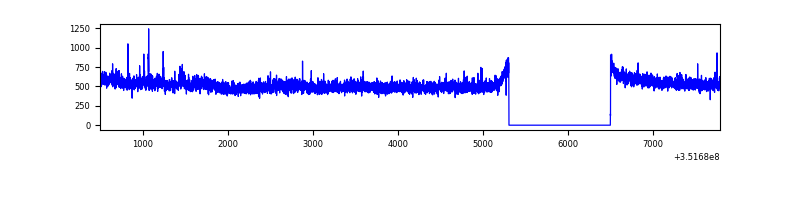 |
| D | 7292 | 6098 | 207 | 207 | 2.84% | 3.39% | 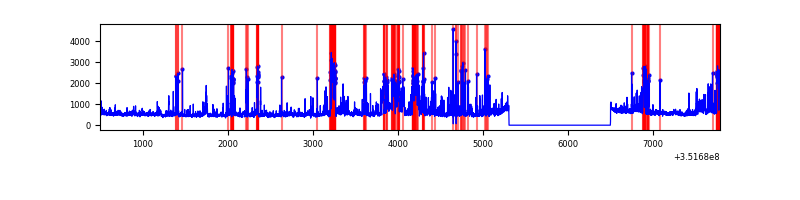 |
Top three noisy pixels from each quadrant. If the there are fewer than three noisy pixels in the level2.evt file, extra rows are filled as -1
| Pixel properties | Quadrant properties | ||||||
|---|---|---|---|---|---|---|---|
| Quadrant | DetID | PixID | Counts | Sigma | Mean | Median | Sigma |
| A | 13 | 254 | 11001 | 65.11 | 794 | 781 | 157.0 |
| A | 0 | 13 | 8588 | 49.73 | 794 | 781 | 157.0 |
| A | 3 | 137 | 7260 | 41.27 | 794 | 781 | 157.0 |
| B | 10 | 245 | 631841 | 4388.84 | 765 | 746 | 143.8 |
| B | 0 | 229 | 274905 | 1906.59 | 765 | 746 | 143.8 |
| B | 0 | 183 | 70240 | 483.28 | 765 | 746 | 143.8 |
| C | 3 | 233 | 132813 | 778.32 | 744 | 748 | 169.7 |
| C | 14 | 238 | 127517 | 747.11 | 744 | 748 | 169.7 |
| C | 2 | 114 | 14276 | 79.73 | 744 | 748 | 169.7 |
| D | 1 | 52 | 1151428 | 6545.55 | 753 | 737 | 175.8 |
| D | 8 | 195 | 123779 | 699.91 | 753 | 737 | 175.8 |
| D | 2 | 250 | 73361 | 413.11 | 753 | 737 | 175.8 |
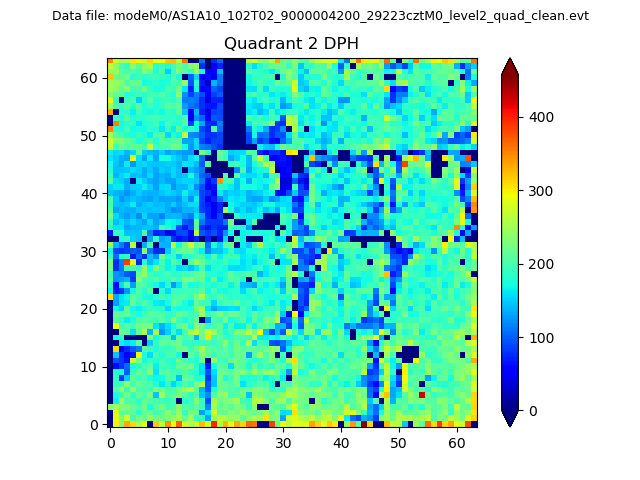
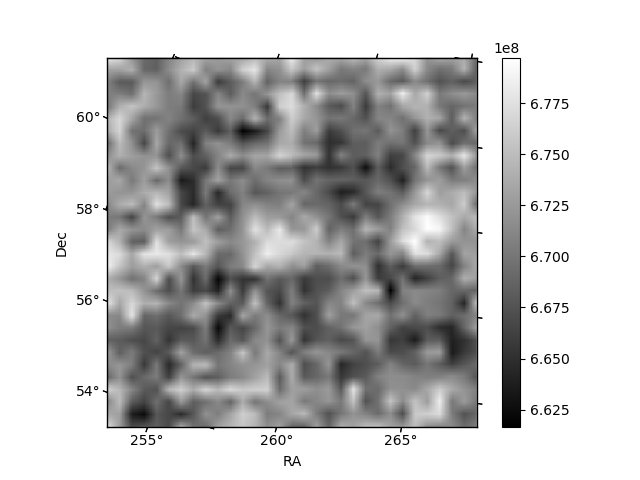
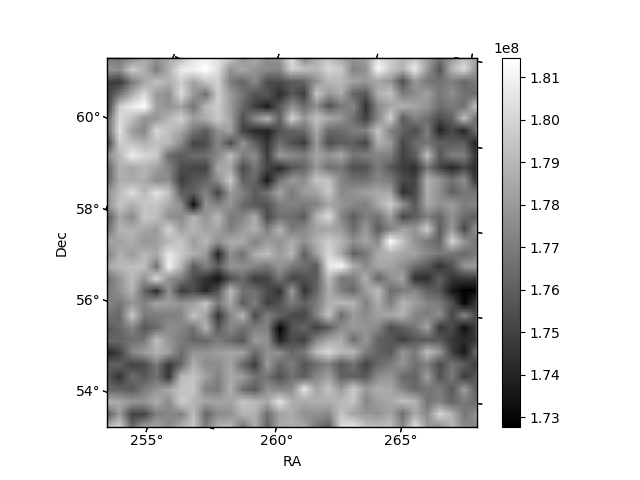
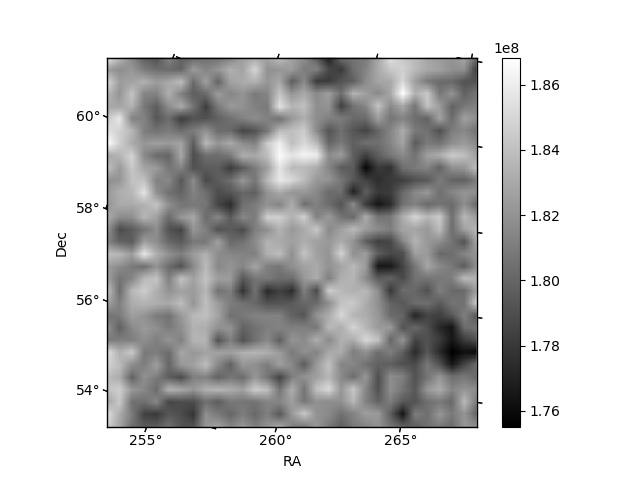
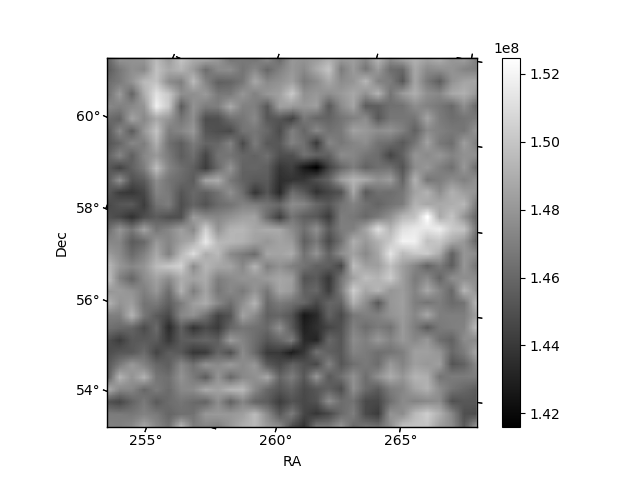
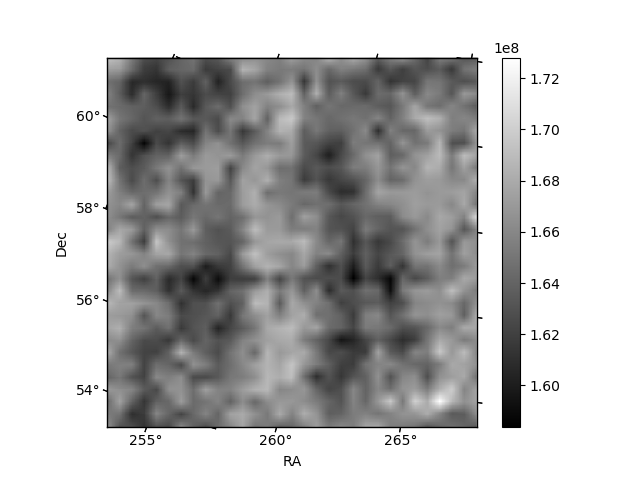
Histogram calculated using DETX and DETY for each event in the final _common_clean file
| Quadrant A | 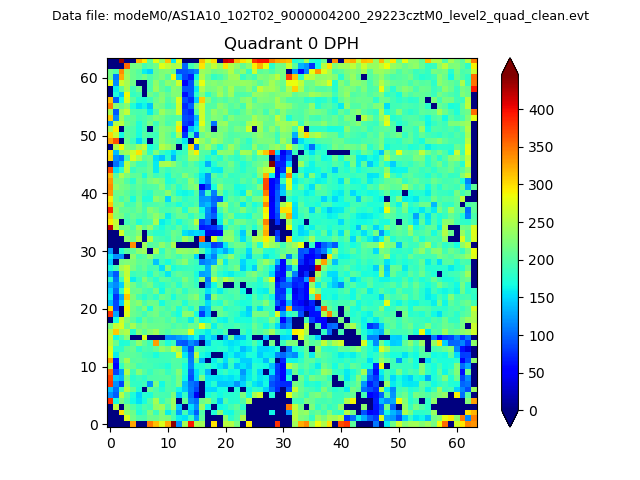 |
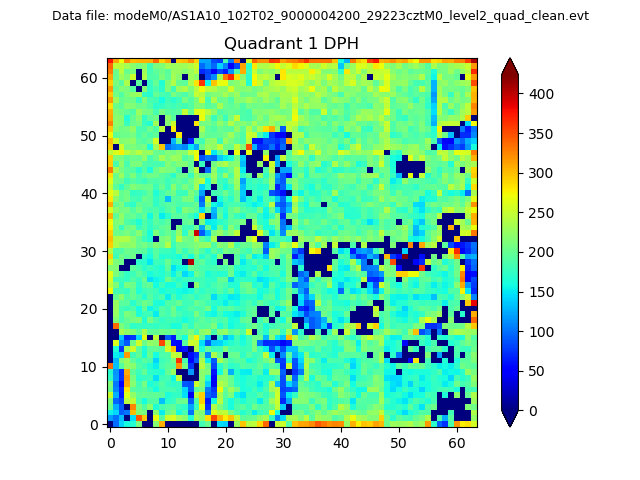 |
Quadrant B |
|---|---|---|---|
| Quadrant D | 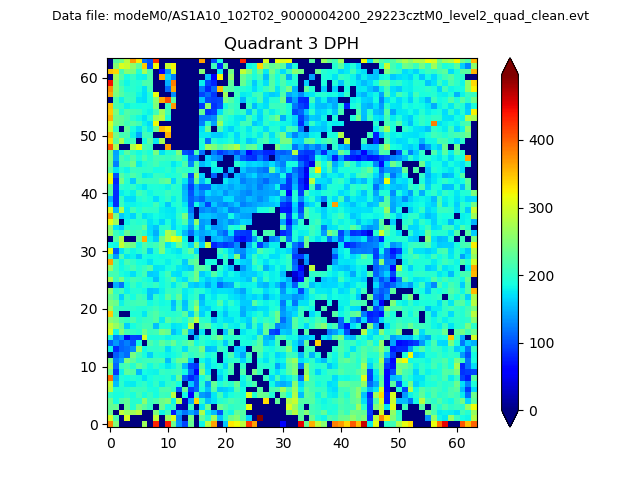 |
 |
Quadrant C |
| Plot type | Count rate plots | Images |
|---|---|---|
| Comparison with Poisson distribution Blue bars denote a histogram of data divided into 1 sec bins. Red curve is a Poisson curve with rate = median count rate of data. |
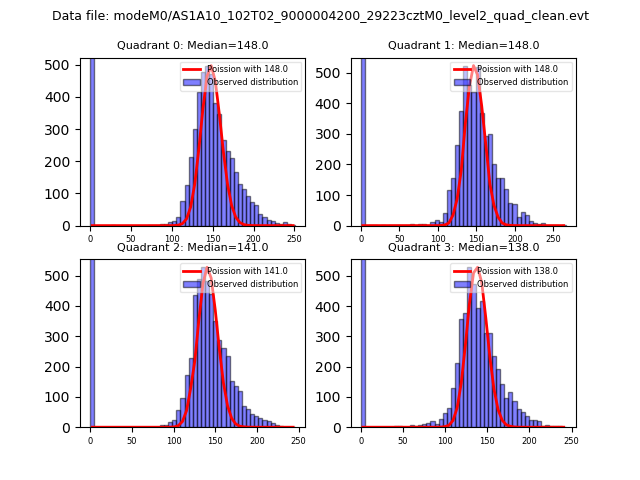 |
 |
| Quadrant-wise count rates Data is divided into 100 sec bins |
 |
|
| Module-wise count rates for Quadrant A Data is divided into 100 sec bins |
 |
 |
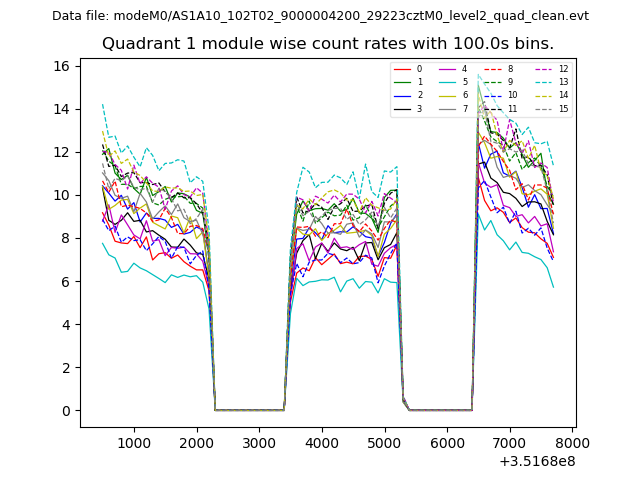
| Module-wise count rates for Quadrant B Data is divided into 100 sec bins |
 |
 |
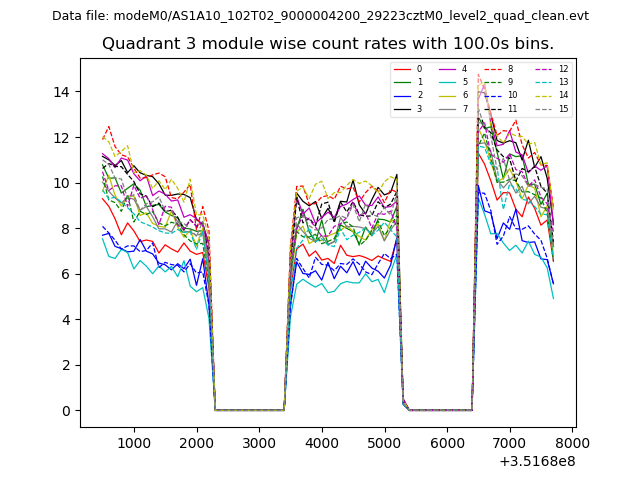
| Module-wise count rates for Quadrant C Data is divided into 100 sec bins |
 |
 |
| Module-wise count rates for Quadrant D Data is divided into 100 sec bins |
 |
 |
| Parameter | Plot |
|---|---|
| CZT HV Monitor |  |
| D_VDD | 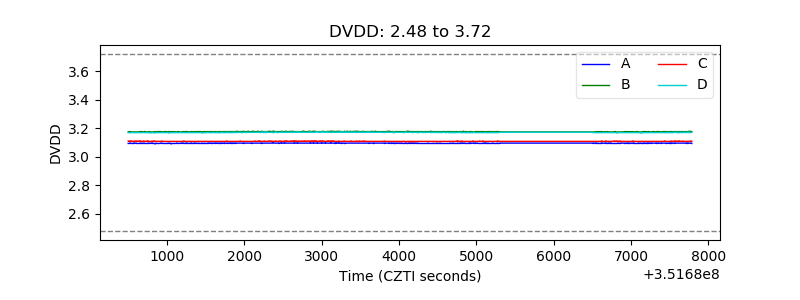 |
| Temperature 1 | 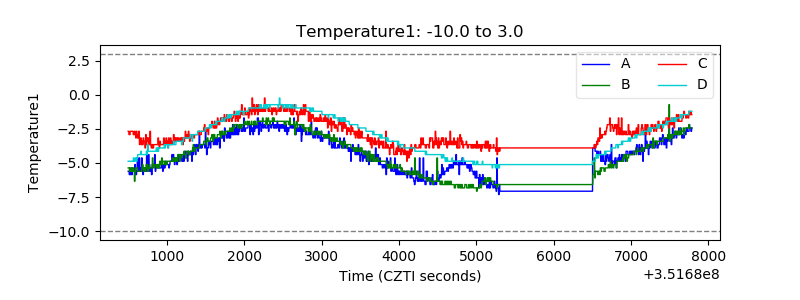 |
| Veto HV Monitor |  |
| Veto LLD | 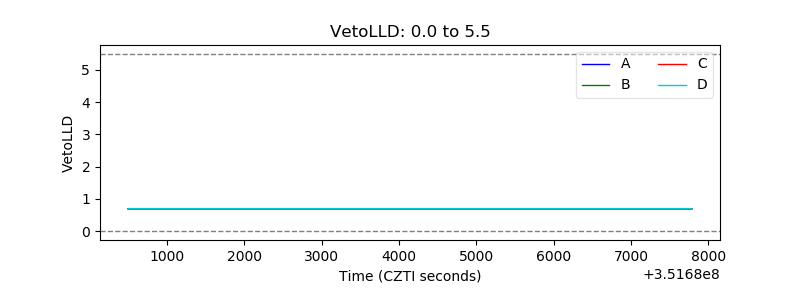 |
| Alpha Counter | 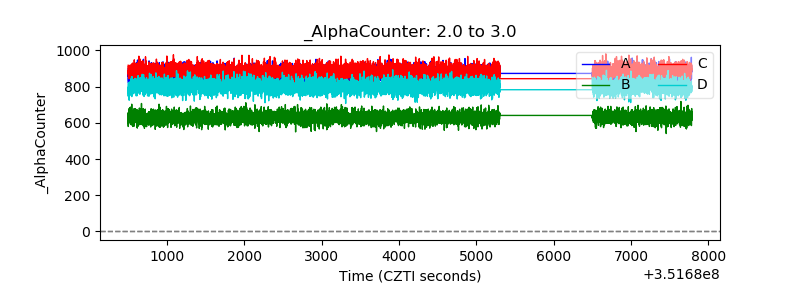 |
| _CPM_Rate | 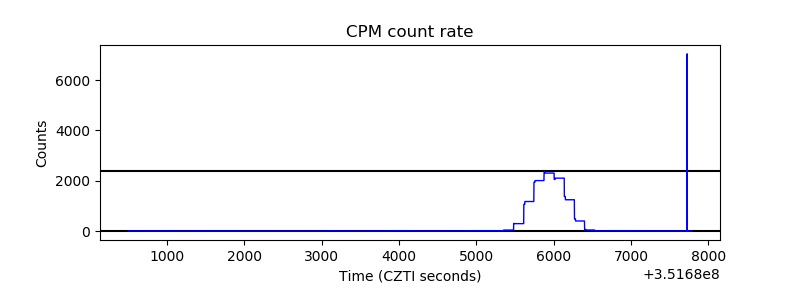 |
| CZT Counter | 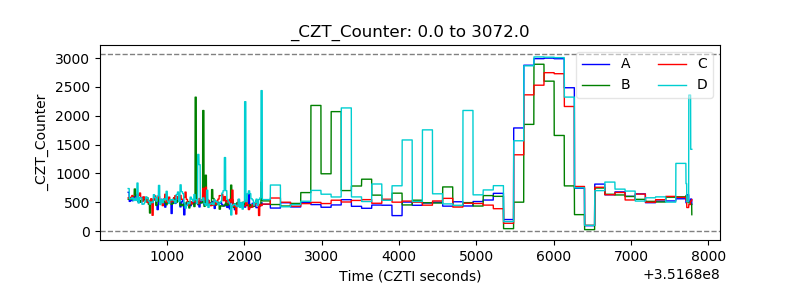 |
| +2.5 Volts monitor |  |
| +5 Volts monitor |  |
| _ROLL_ROT | 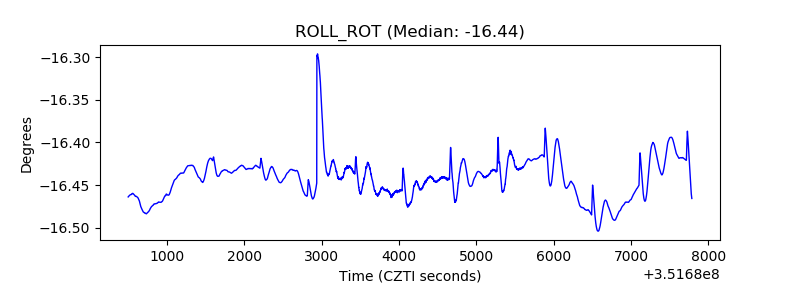 |
| _Roll_DEC | 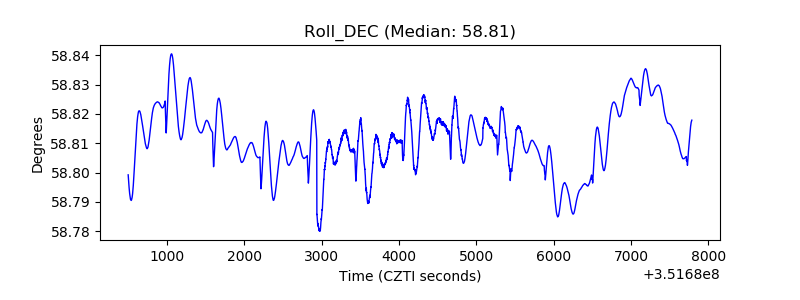 |
| _Roll_RA | 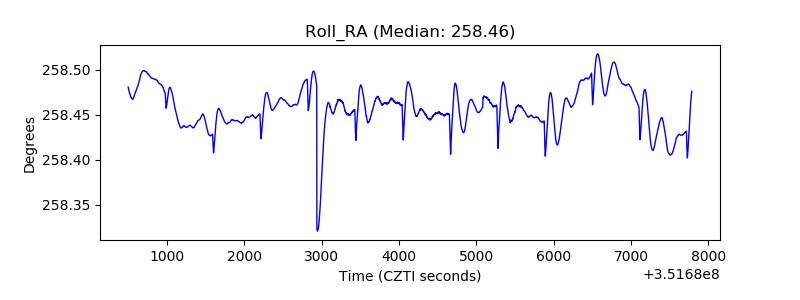 |
| Veto Counter | 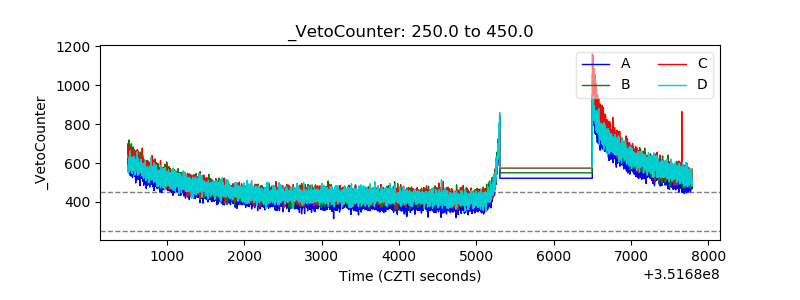 |