| Param | Original file | Final file |
|---|---|---|
| Filename | modeM0/AS1A10_102T02_9000004200_29224cztM0_level2.evt | modeM0/AS1A10_102T02_9000004200_29224cztM0_level2_quad_clean.evt |
| Size (bytes) | 540,696,960 | 101,701,440 |
| Size | 515.6 MB | 97.0 MB |
| Events in quadrant A | 2,973,555 | 700,951 |
| Events in quadrant B | 3,568,679 | 695,860 |
| Events in quadrant C | 4,139,683 | 655,522 |
| Events in quadrant D | 5,305,752 | 627,477 |
| Mode SS | |||
|---|---|---|---|
| Quadrant | BADHDUFLAG | Total packets | Discarded packets |
| A | 0 | 116 | 0 |
| B | 0 | 116 | 0 |
| C | 0 | 116 | 0 |
| D | 0 | 116 | 0 |
| Mode M0 | |||
|---|---|---|---|
| Quadrant | BADHDUFLAG | Total packets | Discarded packets |
| A | 0 | 12280 | 1 |
| B | 0 | 14263 | 1 |
| C | 0 | 15861 | 1 |
| D | 0 | 19753 | 1 |
| Mode M9 | |||
|---|---|---|---|
| Quadrant | BADHDUFLAG | Total packets | Discarded packets |
| A | 0 | 13 | 0 |
| B | 0 | 13 | 0 |
| C | 0 | 13 | 0 |
| D | 0 | 13 | 0 |
| Quadrant | Total seconds | Saturated seconds | Saturation percentage |
|---|---|---|---|
| A | 5723 | 46 | 0.803774% |
| B | 5724 | 105 | 1.834382% |
| C | 5724 | 302 | 5.276031% |
| D | 5724 | 552 | 9.643606% |
Noise dominated data is calculated using 1-second bins in cleaned event files. If a bin has >2000 counts, and if more than 50% of those come from <1% of pixels, then it is considered to be noise-dominated and hence unusable.
| Quadrant | # 1 sec bins | Bins with >0 counts | Bins with >2000 counts | High rate bins dominated by noise | Noise dominated (total time) | Noise dominated (detector-on time) | Marked lightcurve |
|---|---|---|---|---|---|---|---|
| A | 7018 | 5724 | 0 | 0 | 0.00% | 0.00% |  |
| B | 7019 | 5725 | 36 | 36 | 0.51% | 0.63% |  |
| C | 7019 | 5725 | 100 | 100 | 1.42% | 1.75% |  |
| D | 7019 | 5725 | 446 | 446 | 6.35% | 7.79% |  |
Top three noisy pixels from each quadrant. If the there are fewer than three noisy pixels in the level2.evt file, extra rows are filled as -1
| Pixel properties | Quadrant properties | ||||||
|---|---|---|---|---|---|---|---|
| Quadrant | DetID | PixID | Counts | Sigma | Mean | Median | Sigma |
| A | 0 | 13 | 16196 | 101.96 | 766 | 751 | 151.5 |
| A | 13 | 254 | 10841 | 66.61 | 766 | 751 | 151.5 |
| A | 3 | 137 | 6592 | 38.56 | 766 | 751 | 151.5 |
| B | 10 | 245 | 468072 | 3445.86 | 741 | 723 | 135.6 |
| B | 0 | 229 | 109798 | 804.23 | 741 | 723 | 135.6 |
| B | 10 | 246 | 46380 | 336.63 | 741 | 723 | 135.6 |
| C | 3 | 233 | 1208596 | 7377.93 | 716 | 721 | 163.7 |
| C | 14 | 238 | 120425 | 731.17 | 716 | 721 | 163.7 |
| C | 2 | 114 | 13547 | 78.34 | 716 | 721 | 163.7 |
| D | 1 | 52 | 2154382 | 12697.49 | 716 | 698 | 169.6 |
| D | 8 | 195 | 169276 | 993.89 | 716 | 698 | 169.6 |
| D | 13 | 104 | 63459 | 370.02 | 716 | 698 | 169.6 |
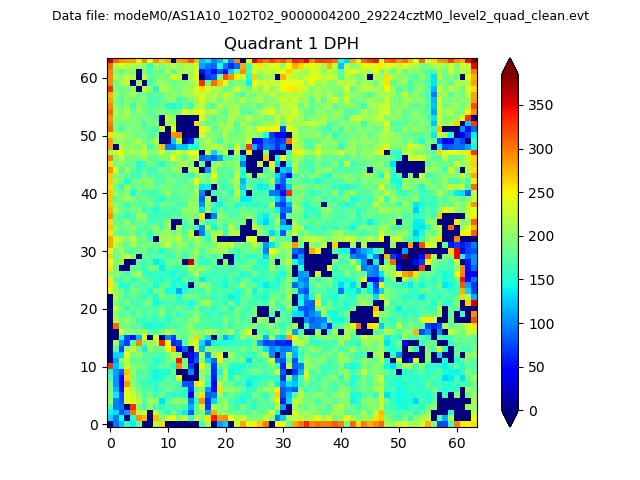
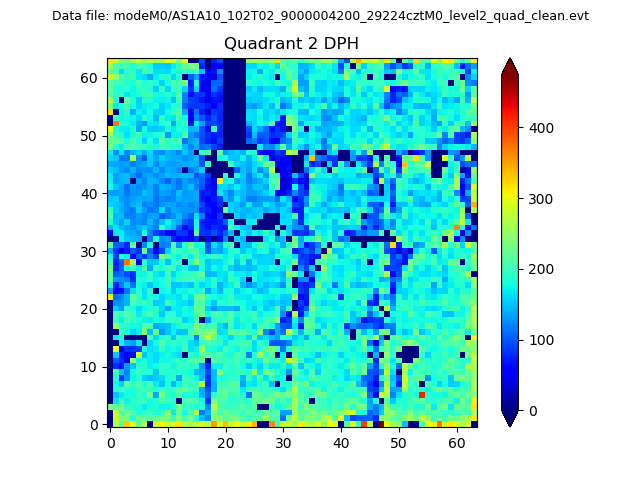
Histogram calculated using DETX and DETY for each event in the final _common_clean file
| Quadrant A |  |
 |
Quadrant B |
|---|---|---|---|
| Quadrant D | 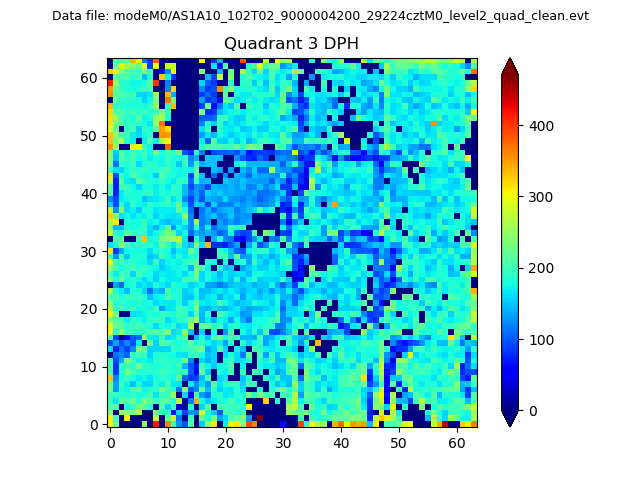 |
 |
Quadrant C |
| Plot type | Count rate plots | Images |
|---|---|---|
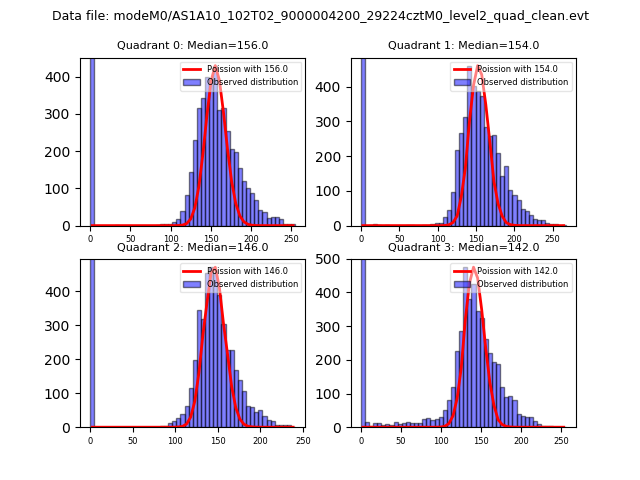
| Comparison with Poisson distribution Blue bars denote a histogram of data divided into 1 sec bins. Red curve is a Poisson curve with rate = median count rate of data. |
 |
 |
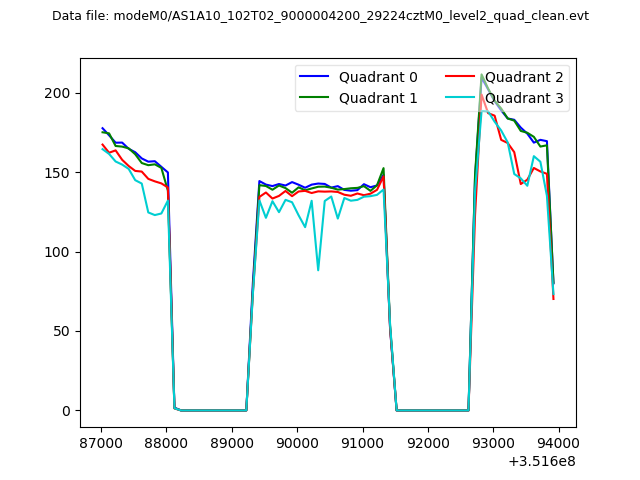
| Quadrant-wise count rates Data is divided into 100 sec bins |
 |
|
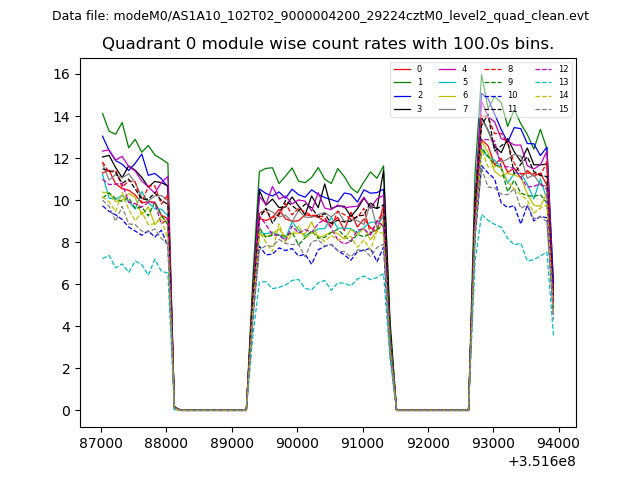
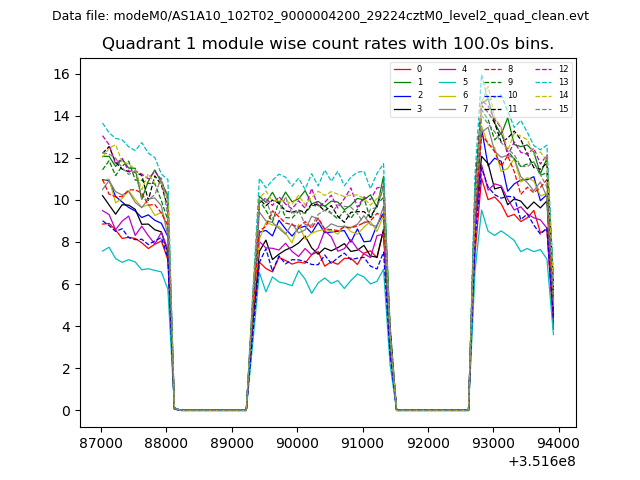
| Module-wise count rates for Quadrant A Data is divided into 100 sec bins |
 |
 |
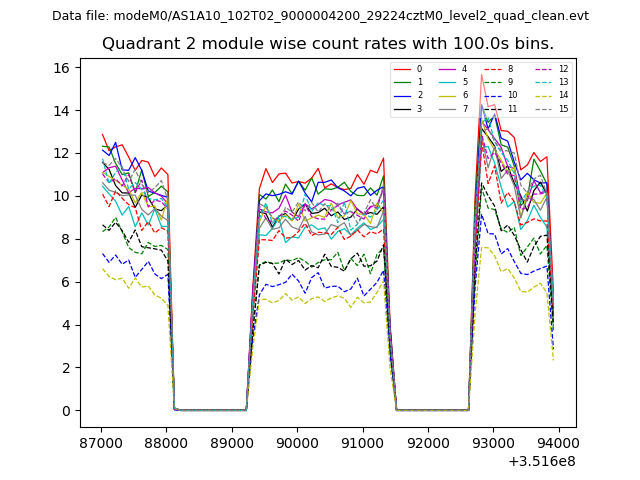
| Module-wise count rates for Quadrant B Data is divided into 100 sec bins |
 |
 |
| Module-wise count rates for Quadrant C Data is divided into 100 sec bins |
 |
 |
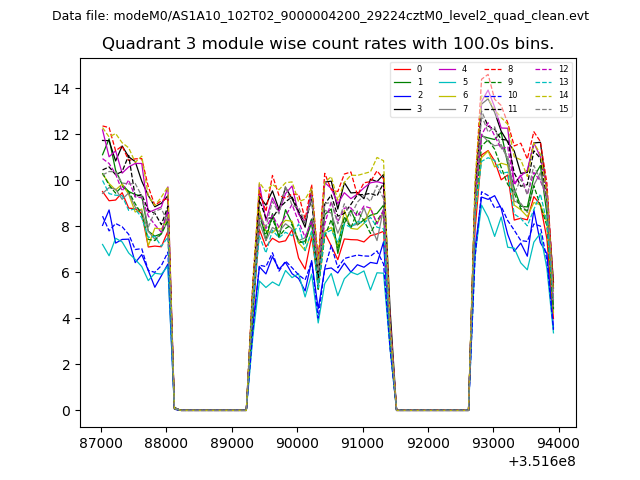
| Module-wise count rates for Quadrant D Data is divided into 100 sec bins |
 |
 |
| Parameter | Plot |
|---|---|
| CZT HV Monitor | 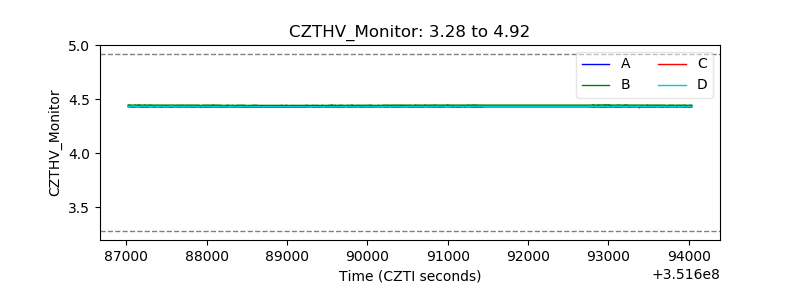 |
| D_VDD | 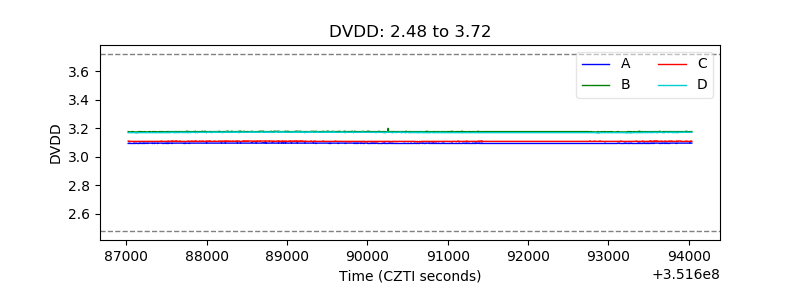 |
| Temperature 1 | 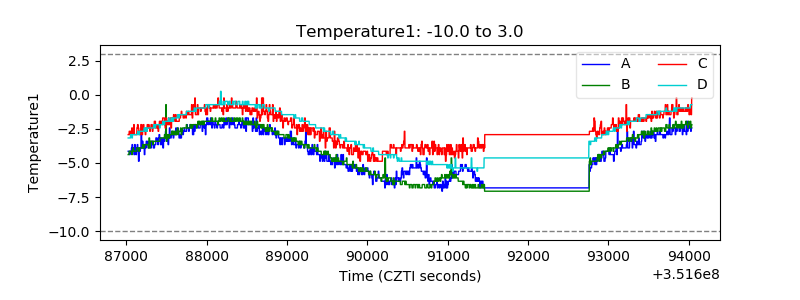 |
| Veto HV Monitor | 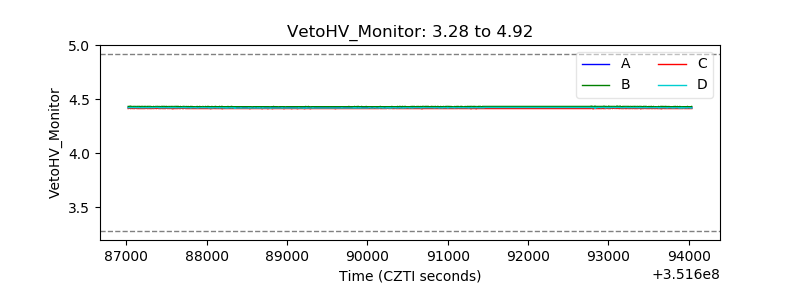 |
| Veto LLD | 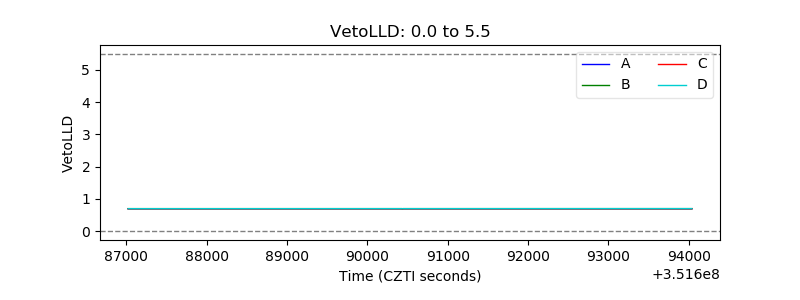 |
| Alpha Counter | 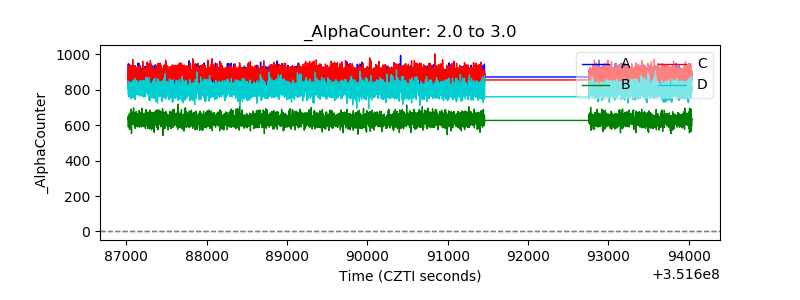 |
| _CPM_Rate | 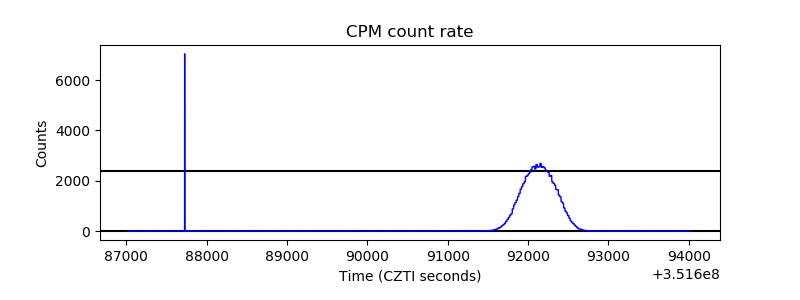 |
| CZT Counter | 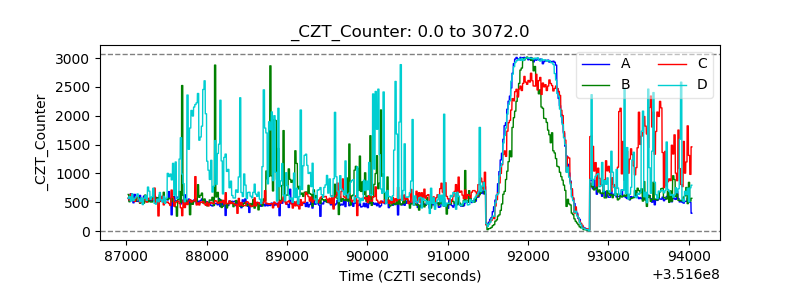 |
| +2.5 Volts monitor |  |
| +5 Volts monitor | 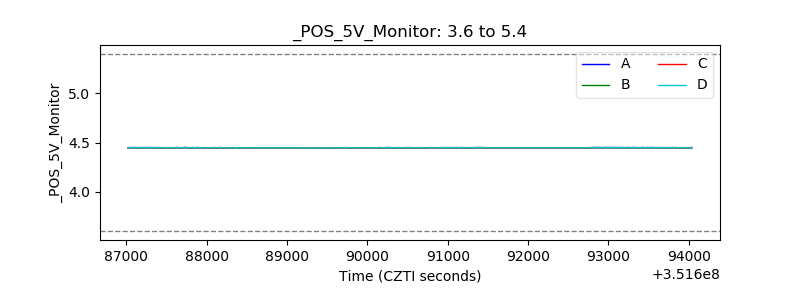 |
| _ROLL_ROT | 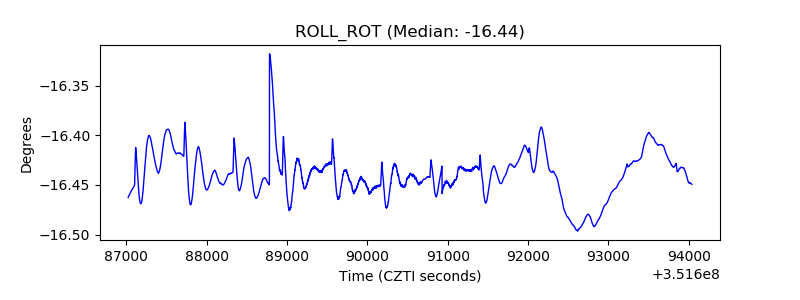 |
| _Roll_DEC | 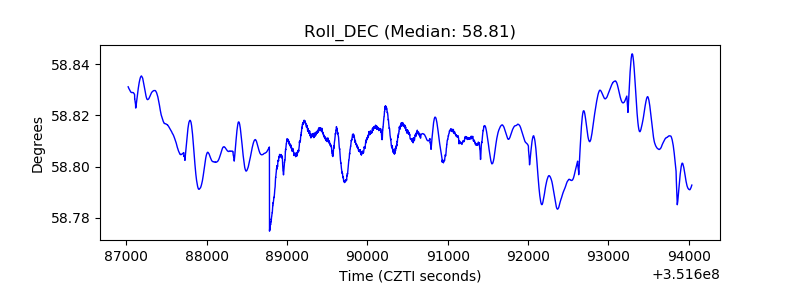 |
| _Roll_RA | 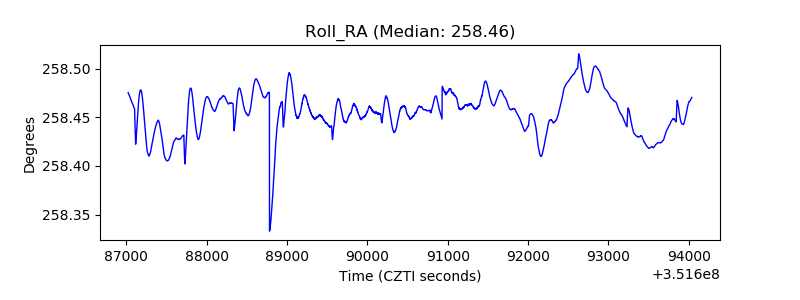 |
| Veto Counter | 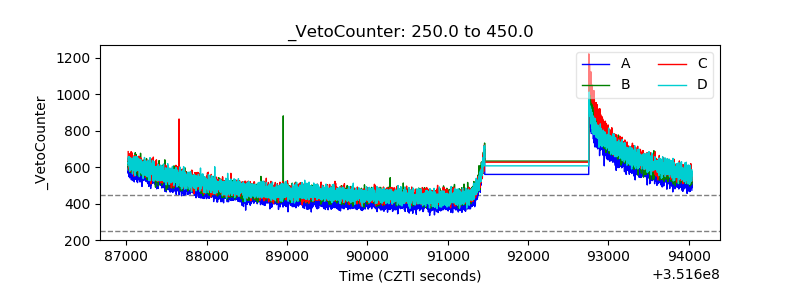 |