| Param | Original file | Final file |
|---|---|---|
| Filename | modeM0/AS1A10_102T02_9000004200_29225cztM0_level2.evt | modeM0/AS1A10_102T02_9000004200_29225cztM0_level2_quad_clean.evt |
| Size (bytes) | 1,872,011,520 | 336,755,520 |
| Size | 1.7 GB | 321.2 MB |
| Events in quadrant A | 10,751,695 | 2,262,449 |
| Events in quadrant B | 12,638,840 | 2,262,284 |
| Events in quadrant C | 16,045,607 | 2,131,608 |
| Events in quadrant D | 15,846,055 | 2,099,602 |
| Mode SS | |||
|---|---|---|---|
| Quadrant | BADHDUFLAG | Total packets | Discarded packets |
| A | 0 | 428 | 0 |
| B | 0 | 428 | 0 |
| C | 0 | 428 | 0 |
| D | 0 | 428 | 0 |
| Mode M0 | |||
|---|---|---|---|
| Quadrant | BADHDUFLAG | Total packets | Discarded packets |
| A | 0 | 44923 | 4 |
| B | 0 | 50857 | 4 |
| C | 0 | 60978 | 4 |
| D | 0 | 61285 | 4 |
| Mode M9 | |||
|---|---|---|---|
| Quadrant | BADHDUFLAG | Total packets | Discarded packets |
| A | 0 | 49 | 0 |
| B | 0 | 49 | 0 |
| C | 0 | 49 | 0 |
| D | 0 | 49 | 0 |
| Quadrant | Total seconds | Saturated seconds | Saturation percentage |
|---|---|---|---|
| A | 20967 | 282 | 1.344971% |
| B | 20968 | 524 | 2.499046% |
| C | 20968 | 1534 | 7.315910% |
| D | 20968 | 1066 | 5.083937% |
Noise dominated data is calculated using 1-second bins in cleaned event files. If a bin has >2000 counts, and if more than 50% of those come from <1% of pixels, then it is considered to be noise-dominated and hence unusable.
| Quadrant | # 1 sec bins | Bins with >0 counts | Bins with >2000 counts | High rate bins dominated by noise | Noise dominated (total time) | Noise dominated (detector-on time) | Marked lightcurve |
|---|---|---|---|---|---|---|---|
| A | 25867 | 20971 | 83 | 83 | 0.32% | 0.40% | 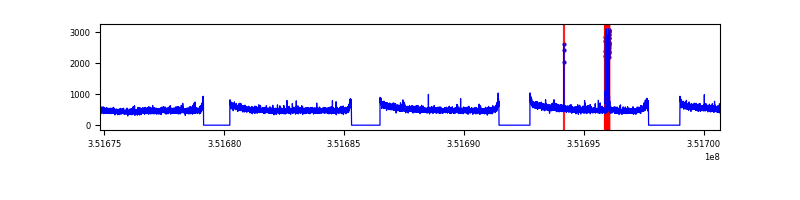 |
| B | 25868 | 20972 | 184 | 184 | 0.71% | 0.88% | 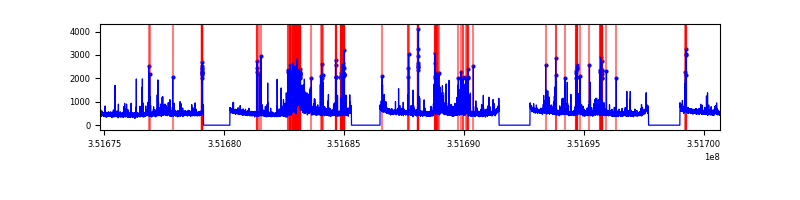 |
| C | 25868 | 20972 | 598 | 598 | 2.31% | 2.85% | 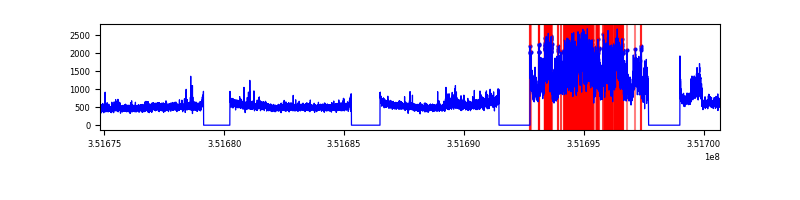 |
| D | 25868 | 20972 | 805 | 805 | 3.11% | 3.84% | 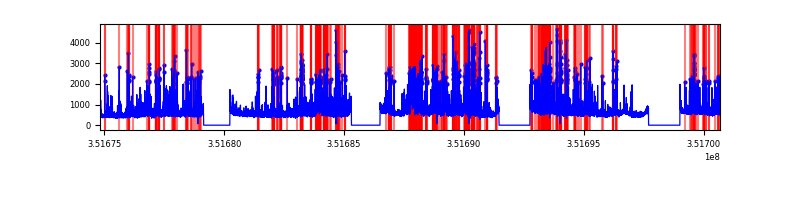 |
Top three noisy pixels from each quadrant. If the there are fewer than three noisy pixels in the level2.evt file, extra rows are filled as -1
| Pixel properties | Quadrant properties | ||||||
|---|---|---|---|---|---|---|---|
| Quadrant | DetID | PixID | Counts | Sigma | Mean | Median | Sigma |
| A | 15 | 174 | 234260 | 435.29 | 2718 | 2670 | 532.0 |
| A | 13 | 254 | 39305 | 68.86 | 2718 | 2670 | 532.0 |
| A | 0 | 13 | 34688 | 60.18 | 2718 | 2670 | 532.0 |
| B | 10 | 245 | 1275286 | 2623.96 | 2645 | 2580 | 485.0 |
| B | 0 | 229 | 611392 | 1255.2 | 2645 | 2580 | 485.0 |
| B | 0 | 183 | 239806 | 489.09 | 2645 | 2580 | 485.0 |
| C | 3 | 233 | 5594971 | 9684.76 | 2545 | 2561 | 577.4 |
| C | 14 | 238 | 444242 | 764.89 | 2545 | 2561 | 577.4 |
| C | 2 | 114 | 49205 | 80.78 | 2545 | 2561 | 577.4 |
| D | 1 | 52 | 4339722 | 7234.15 | 2589 | 2528 | 599.5 |
| D | 8 | 195 | 585531 | 972.41 | 2589 | 2528 | 599.5 |
| D | 13 | 153 | 216829 | 357.44 | 2589 | 2528 | 599.5 |
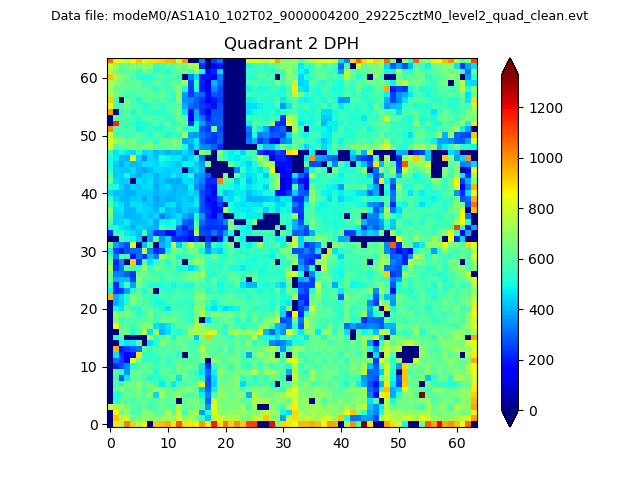
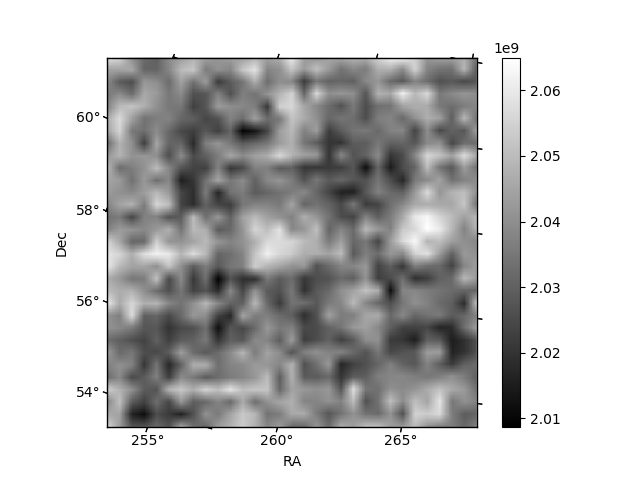
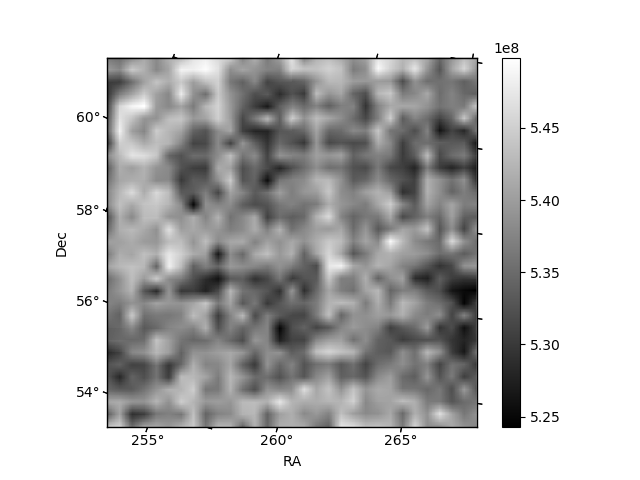
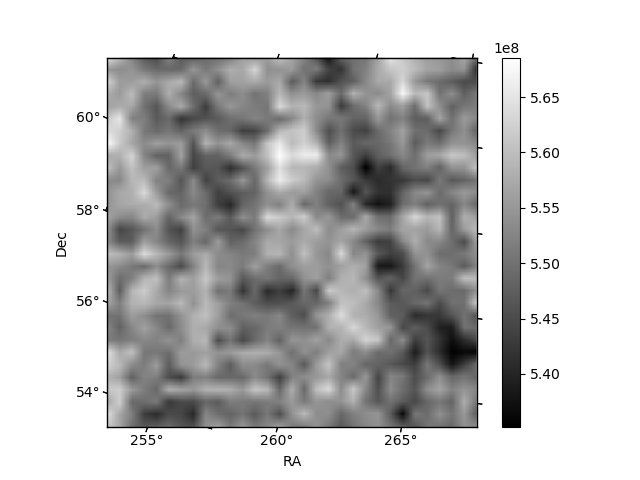
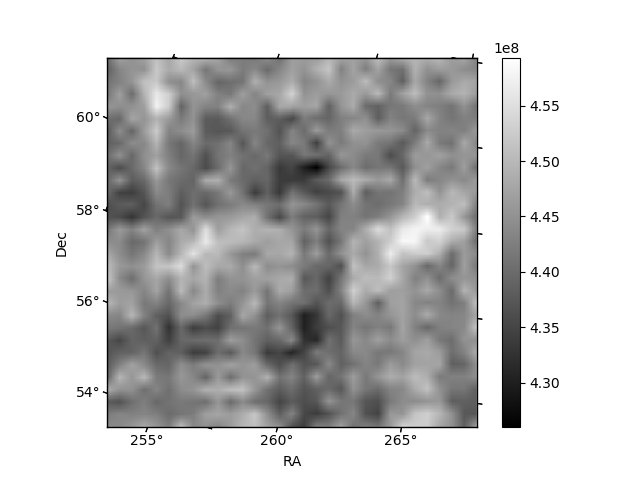
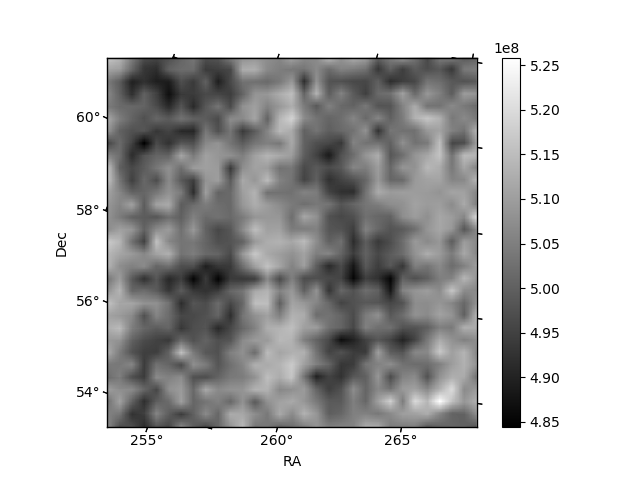
Histogram calculated using DETX and DETY for each event in the final _common_clean file
| Quadrant A | 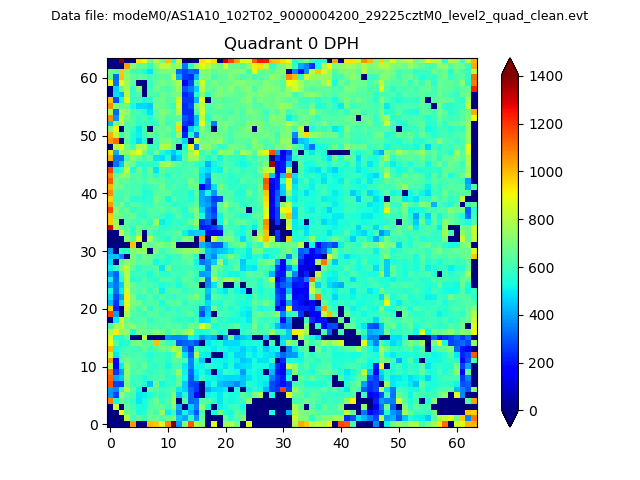 |
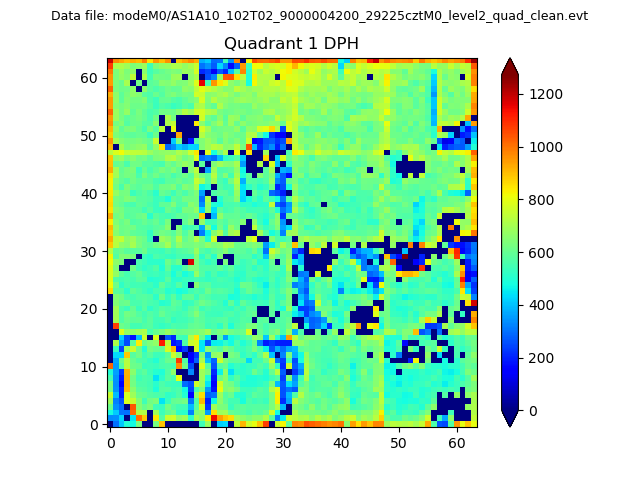 |
Quadrant B |
|---|---|---|---|
| Quadrant D | 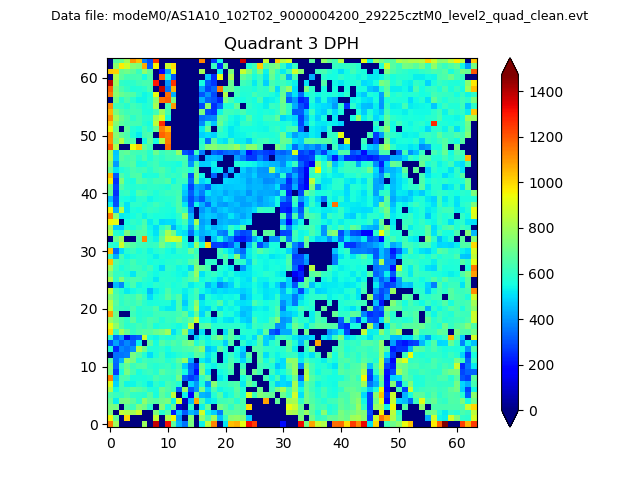 |
 |
Quadrant C |
| Plot type | Count rate plots | Images |
|---|---|---|
| Comparison with Poisson distribution Blue bars denote a histogram of data divided into 1 sec bins. Red curve is a Poisson curve with rate = median count rate of data. |
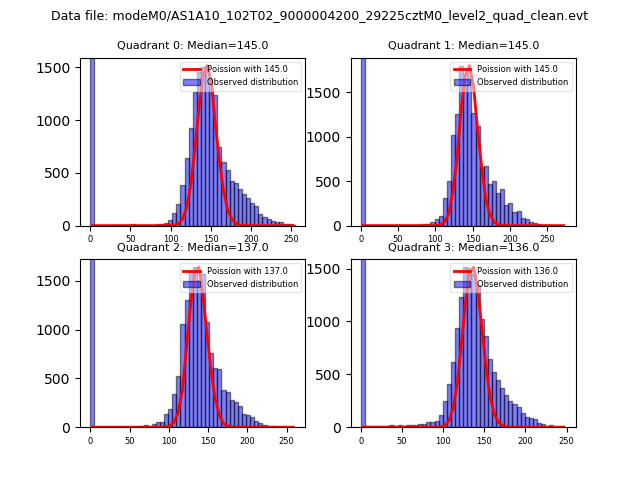 |
 |
| Quadrant-wise count rates Data is divided into 100 sec bins |
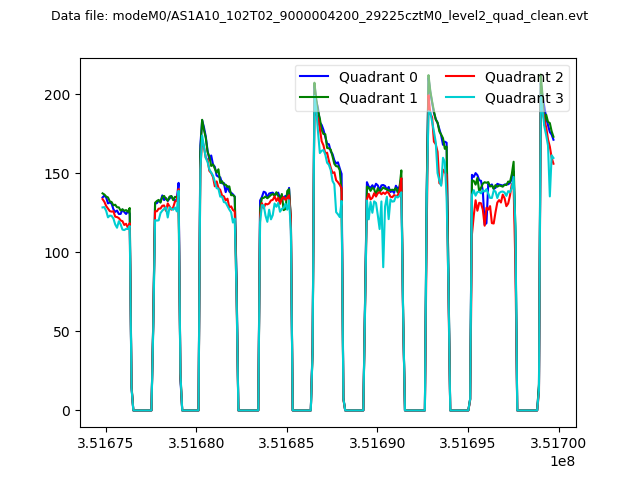 |
|
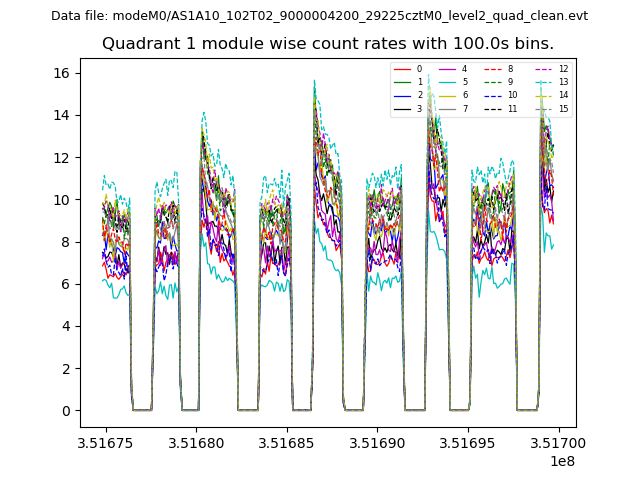
| Module-wise count rates for Quadrant A Data is divided into 100 sec bins |
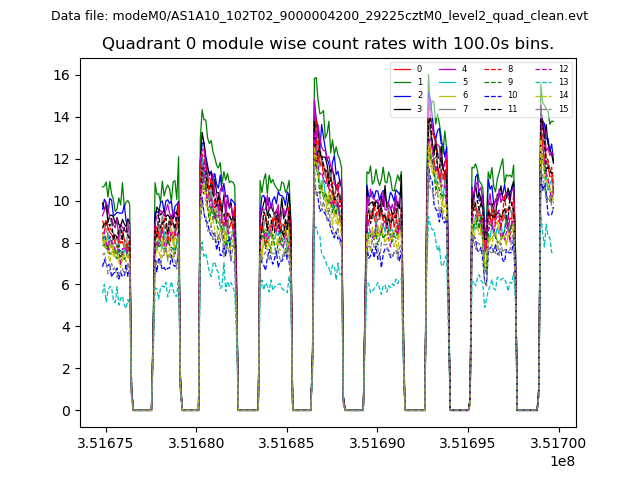 |
 |
| Module-wise count rates for Quadrant B Data is divided into 100 sec bins |
 |
 |
| Module-wise count rates for Quadrant C Data is divided into 100 sec bins |
 |
 |
| Module-wise count rates for Quadrant D Data is divided into 100 sec bins |
 |
 |
| Parameter | Plot |
|---|---|
| CZT HV Monitor |  |
| D_VDD | 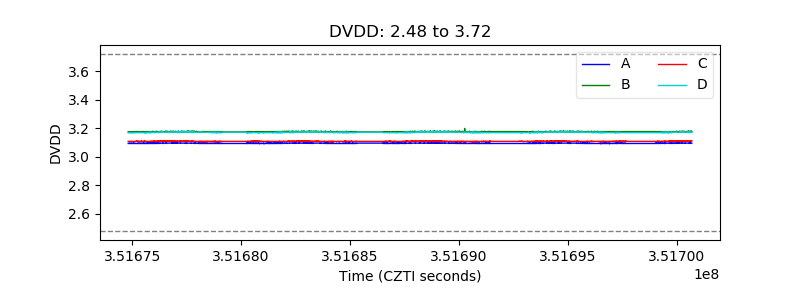 |
| Temperature 1 | 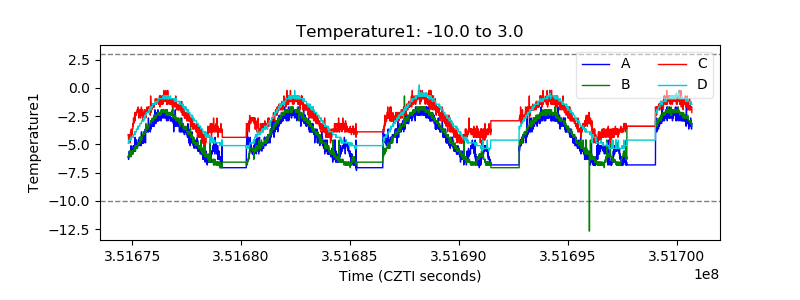 |
| Veto HV Monitor | 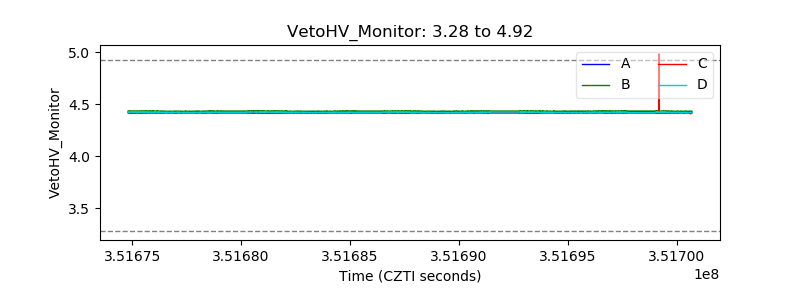 |
| Veto LLD | 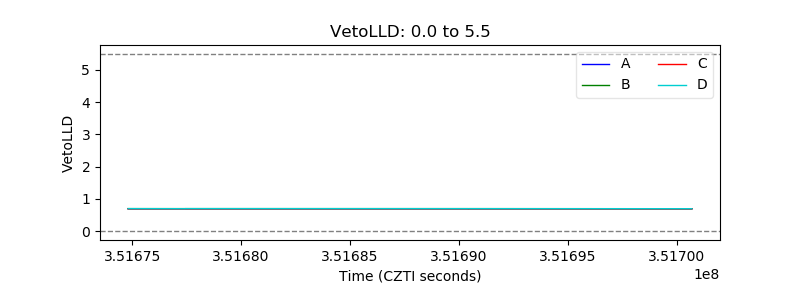 |
| Alpha Counter | 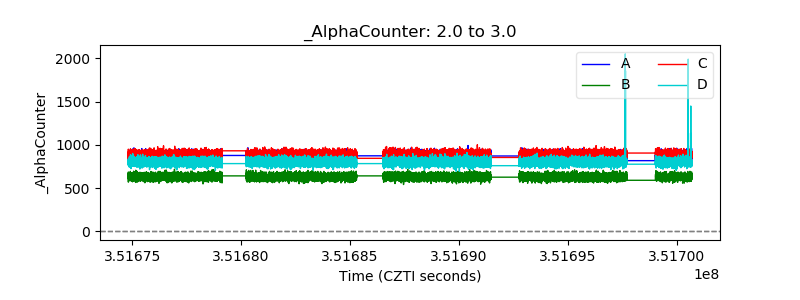 |
| _CPM_Rate | 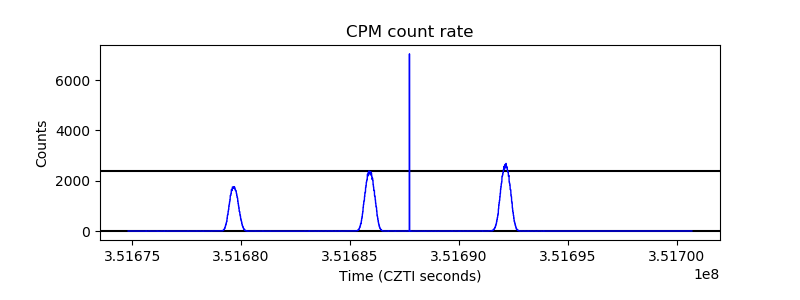 |
| CZT Counter | 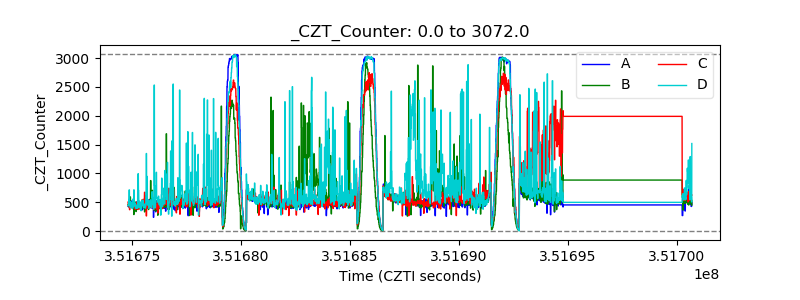 |
| +2.5 Volts monitor |  |
| +5 Volts monitor |  |
| _ROLL_ROT | 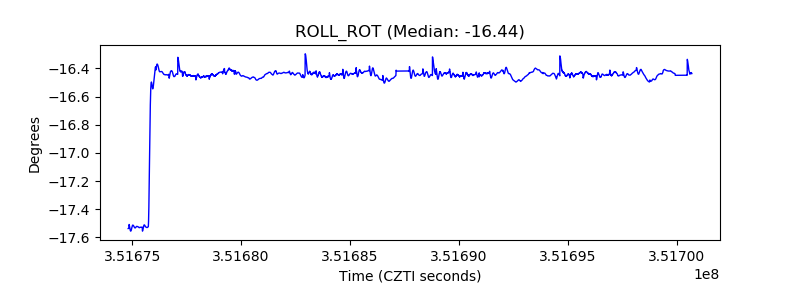 |
| _Roll_DEC | 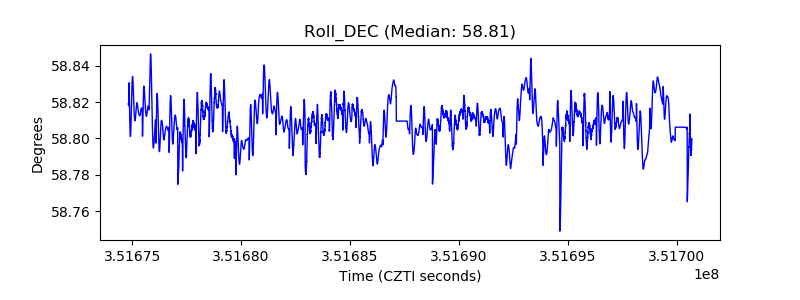 |
| _Roll_RA | 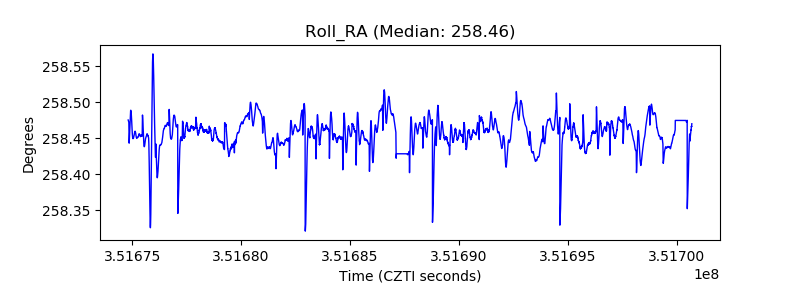 |
| Veto Counter | 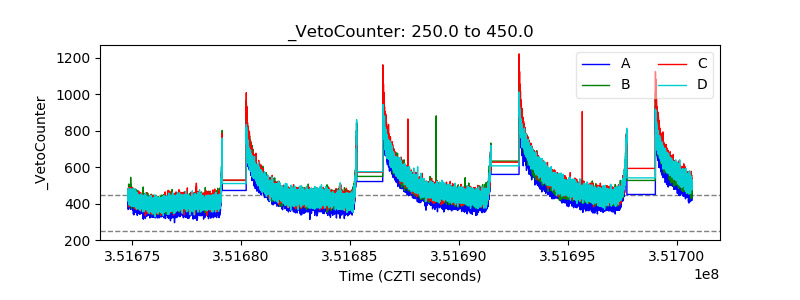 |