| Param | Original file | Final file |
|---|---|---|
| Filename | modeM0/AS1A10_102T02_9000004200_29227cztM0_level2.evt | modeM0/AS1A10_102T02_9000004200_29227cztM0_level2_quad_clean.evt |
| Size (bytes) | 557,769,600 | 80,631,360 |
| Size | 531.9 MB | 76.9 MB |
| Events in quadrant A | 3,038,498 | 512,495 |
| Events in quadrant B | 3,590,963 | 512,730 |
| Events in quadrant C | 5,758,407 | 494,207 |
| Events in quadrant D | 4,089,587 | 494,543 |
| Mode SS | |||
|---|---|---|---|
| Quadrant | BADHDUFLAG | Total packets | Discarded packets |
| A | 0 | 124 | 0 |
| B | 0 | 124 | 0 |
| C | 0 | 124 | 0 |
| D | 0 | 124 | 0 |
| Mode M0 | |||
|---|---|---|---|
| Quadrant | BADHDUFLAG | Total packets | Discarded packets |
| A | 0 | 12785 | 1 |
| B | 0 | 14700 | 1 |
| C | 0 | 21556 | 1 |
| D | 0 | 16241 | 2 |
| Mode M9 | |||
|---|---|---|---|
| Quadrant | BADHDUFLAG | Total packets | Discarded packets |
| A | 0 | 11 | 0 |
| B | 0 | 11 | 0 |
| C | 0 | 11 | 0 |
| D | 0 | 11 | 0 |
| Quadrant | Total seconds | Saturated seconds | Saturation percentage |
|---|---|---|---|
| A | 6125 | 62 | 1.012245% |
| B | 6126 | 123 | 2.007835% |
| C | 6126 | 491 | 8.015018% |
| D | 6125 | 269 | 4.391837% |
Noise dominated data is calculated using 1-second bins in cleaned event files. If a bin has >2000 counts, and if more than 50% of those come from <1% of pixels, then it is considered to be noise-dominated and hence unusable.
| Quadrant | # 1 sec bins | Bins with >0 counts | Bins with >2000 counts | High rate bins dominated by noise | Noise dominated (total time) | Noise dominated (detector-on time) | Marked lightcurve |
|---|---|---|---|---|---|---|---|
| A | 7225 | 6126 | 0 | 0 | 0.00% | 0.00% | 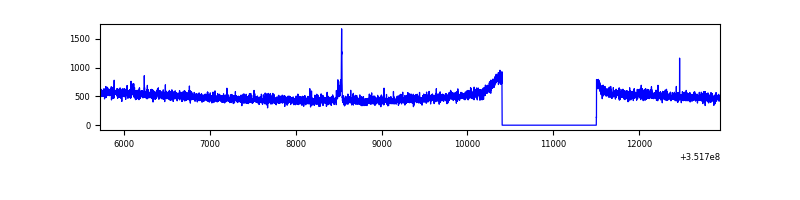 |
| B | 7226 | 6127 | 23 | 23 | 0.32% | 0.38% | 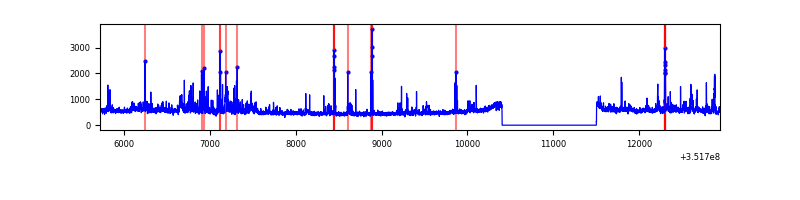 |
| C | 7226 | 6127 | 33 | 33 | 0.46% | 0.54% |  |
| D | 7225 | 6126 | 102 | 102 | 1.41% | 1.67% | 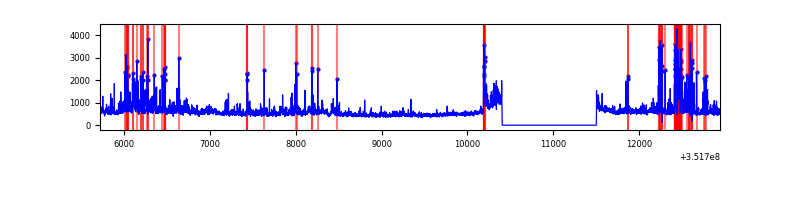 |
Top three noisy pixels from each quadrant. If the there are fewer than three noisy pixels in the level2.evt file, extra rows are filled as -1
| Pixel properties | Quadrant properties | ||||||
|---|---|---|---|---|---|---|---|
| Quadrant | DetID | PixID | Counts | Sigma | Mean | Median | Sigma |
| A | 15 | 174 | 22272 | 139.37 | 777 | 763 | 154.3 |
| A | 0 | 13 | 16855 | 104.27 | 777 | 763 | 154.3 |
| A | 13 | 254 | 12188 | 74.03 | 777 | 763 | 154.3 |
| B | 10 | 245 | 198000 | 1377.07 | 765 | 747 | 143.2 |
| B | 0 | 229 | 178730 | 1242.54 | 765 | 747 | 143.2 |
| B | 0 | 183 | 108523 | 752.41 | 765 | 747 | 143.2 |
| C | 3 | 233 | 2748388 | 16286.74 | 736 | 742 | 168.7 |
| C | 14 | 238 | 120692 | 711.01 | 736 | 742 | 168.7 |
| C | 2 | 114 | 15031 | 84.7 | 736 | 742 | 168.7 |
| D | 1 | 52 | 743413 | 4218.89 | 747 | 727 | 176.0 |
| D | 8 | 195 | 265814 | 1505.85 | 747 | 727 | 176.0 |
| D | 13 | 104 | 94643 | 533.5 | 747 | 727 | 176.0 |
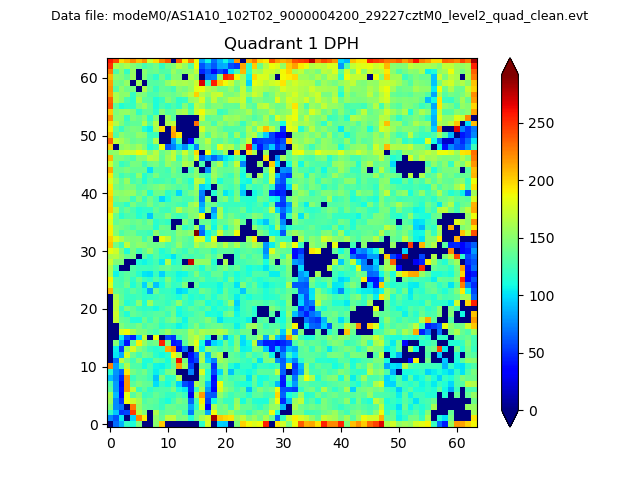
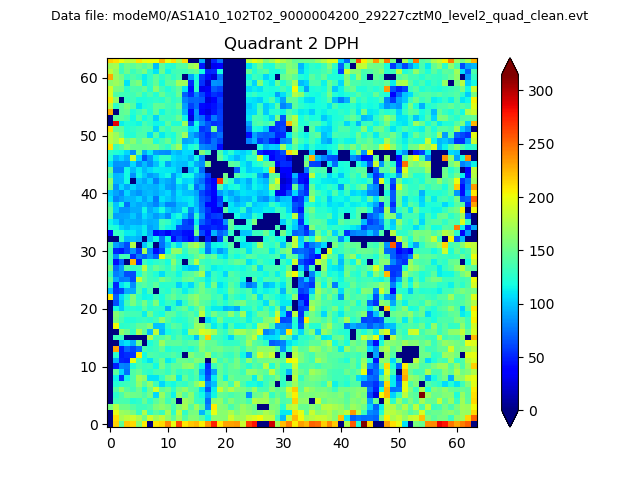
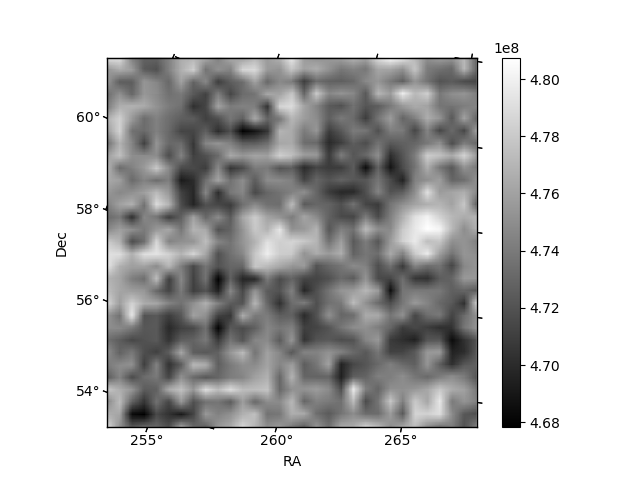
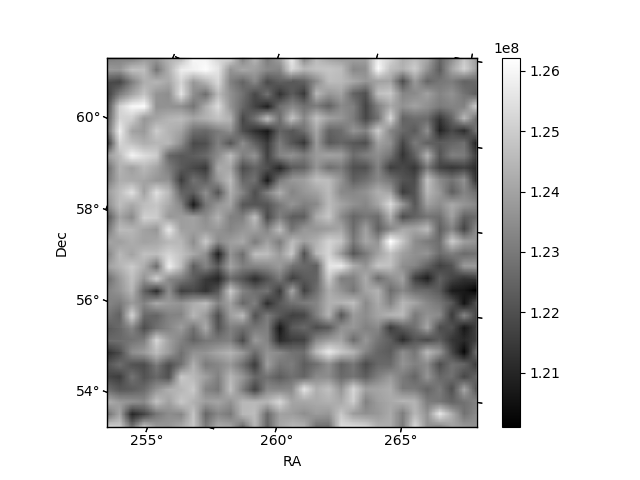
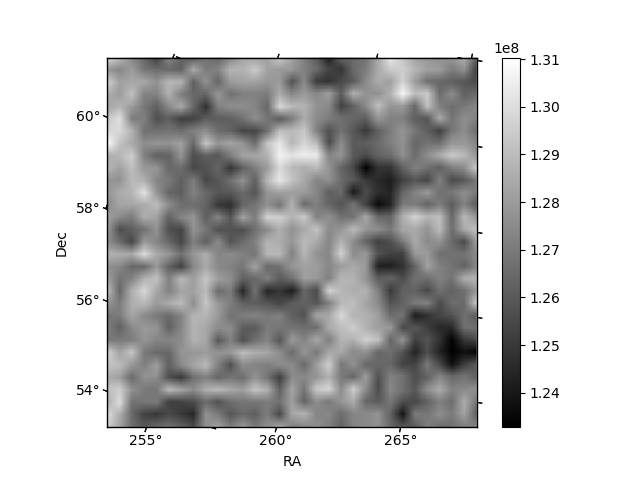
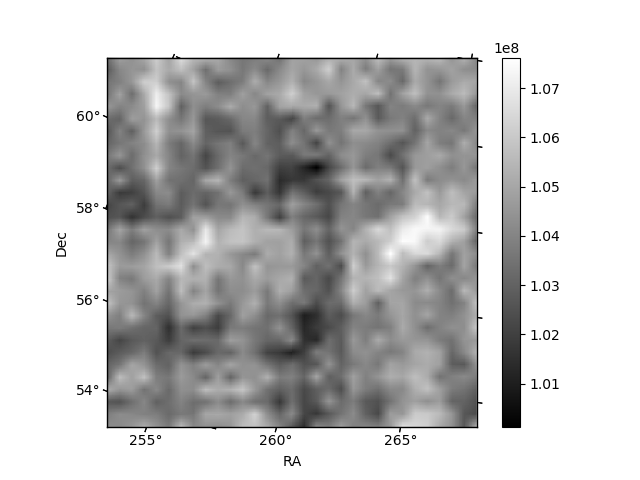
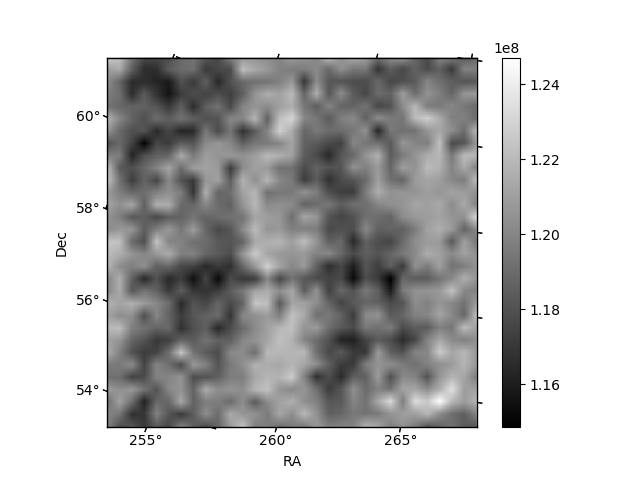
Histogram calculated using DETX and DETY for each event in the final _common_clean file
| Quadrant A | 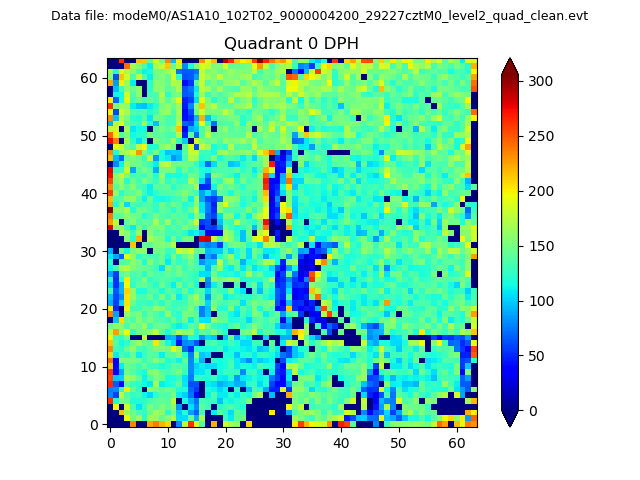 |
 |
Quadrant B |
|---|---|---|---|
| Quadrant D | 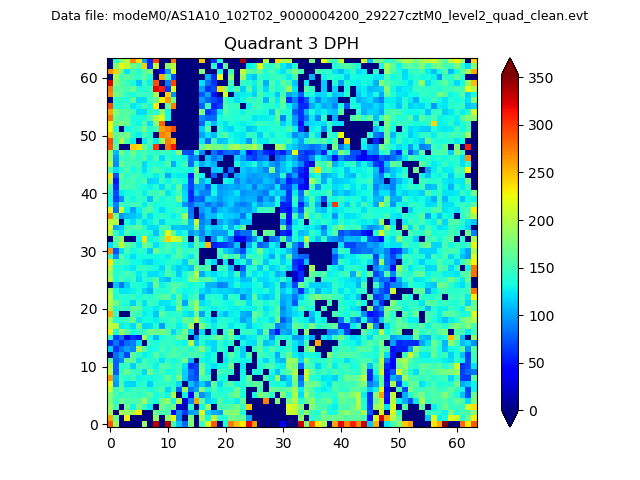 |
 |
Quadrant C |
| Plot type | Count rate plots | Images |
|---|---|---|
| Comparison with Poisson distribution Blue bars denote a histogram of data divided into 1 sec bins. Red curve is a Poisson curve with rate = median count rate of data. |
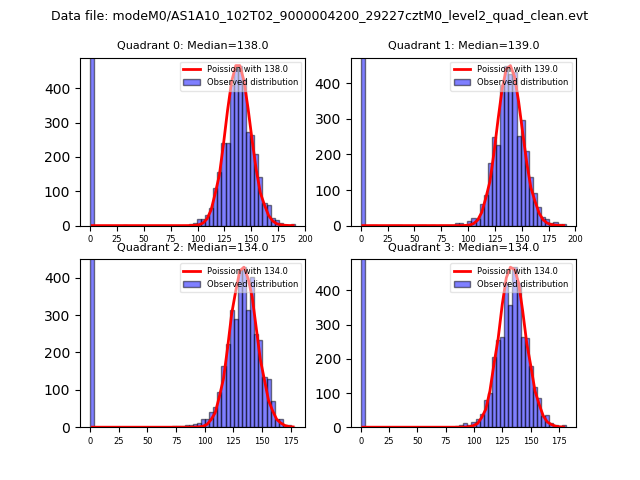 |
 |
| Quadrant-wise count rates Data is divided into 100 sec bins |
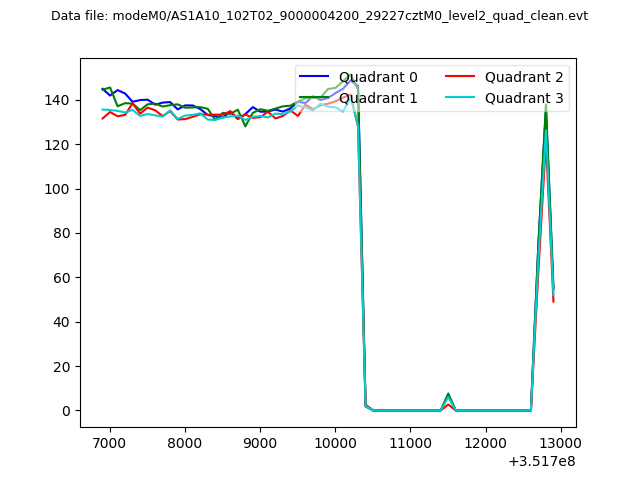 |
|
| Module-wise count rates for Quadrant A Data is divided into 100 sec bins |
 |
 |
| Module-wise count rates for Quadrant B Data is divided into 100 sec bins |
 |
 |
| Module-wise count rates for Quadrant C Data is divided into 100 sec bins |
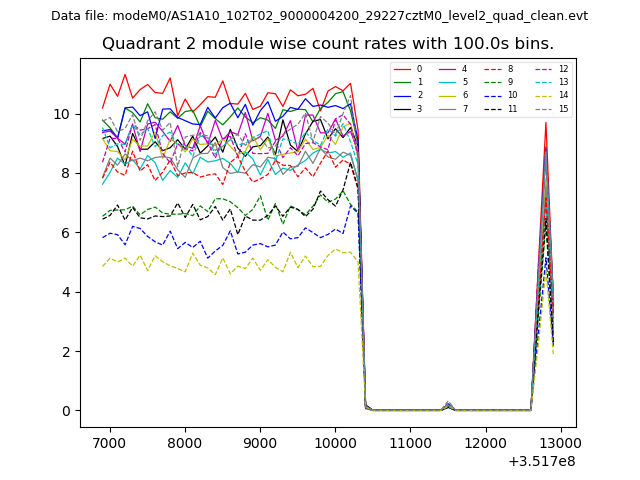 |
 |
| Module-wise count rates for Quadrant D Data is divided into 100 sec bins |
 |
 |
| Parameter | Plot |
|---|---|
| CZT HV Monitor | 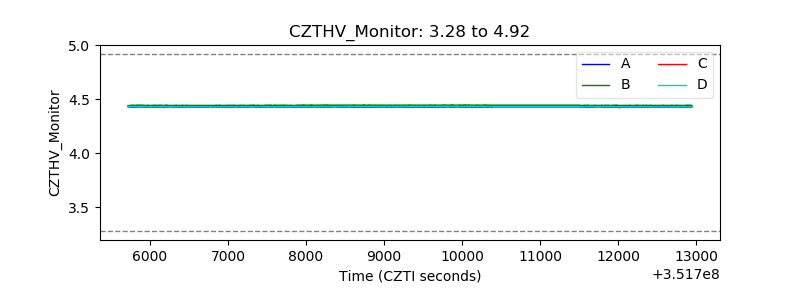 |
| D_VDD | 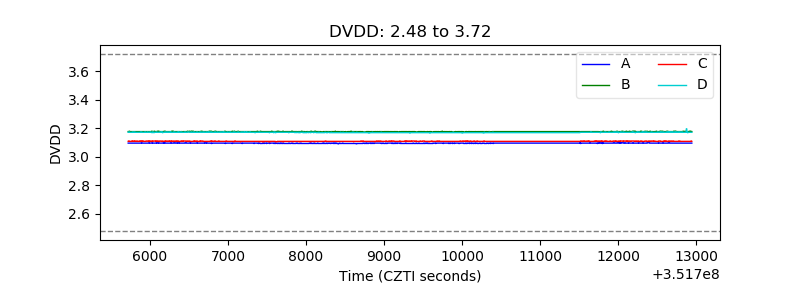 |
| Temperature 1 | 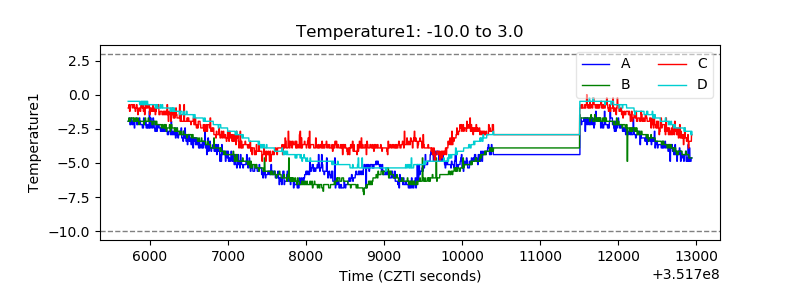 |
| Veto HV Monitor |  |
| Veto LLD | 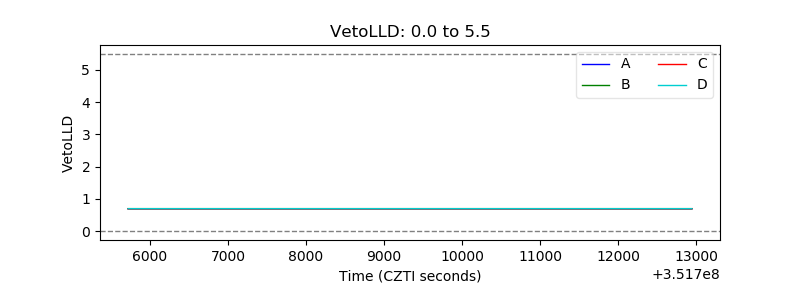 |
| Alpha Counter | 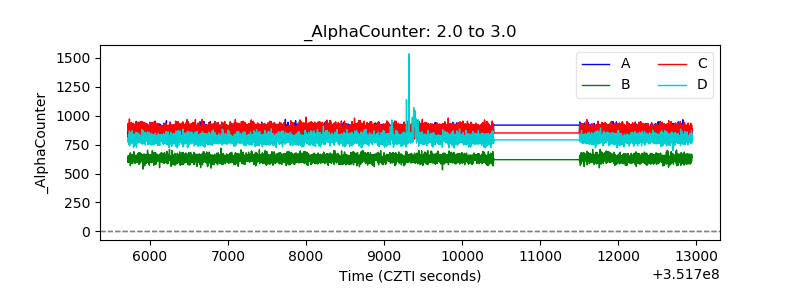 |
| _CPM_Rate | 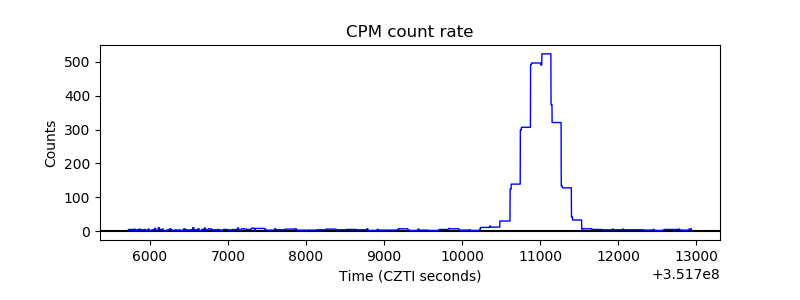 |
| CZT Counter | 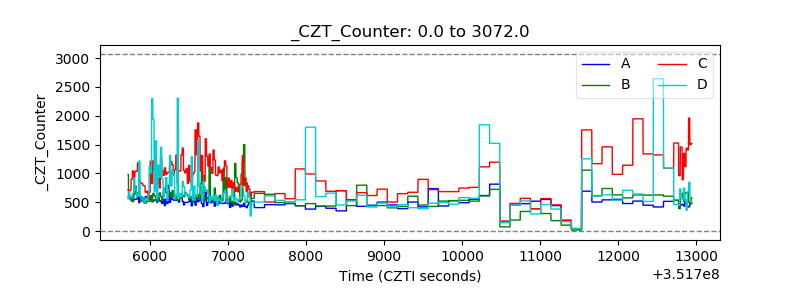 |
| +2.5 Volts monitor | 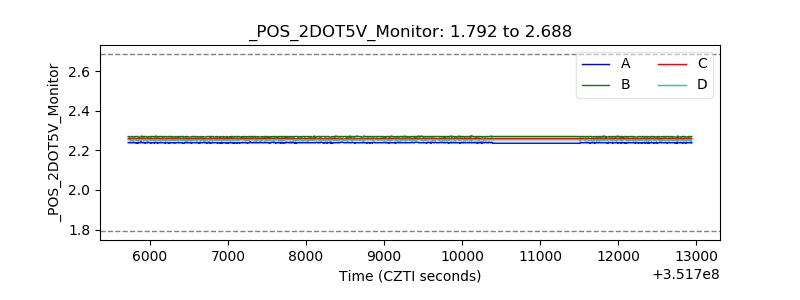 |
| +5 Volts monitor |  |
| _ROLL_ROT |  |
| _Roll_DEC | 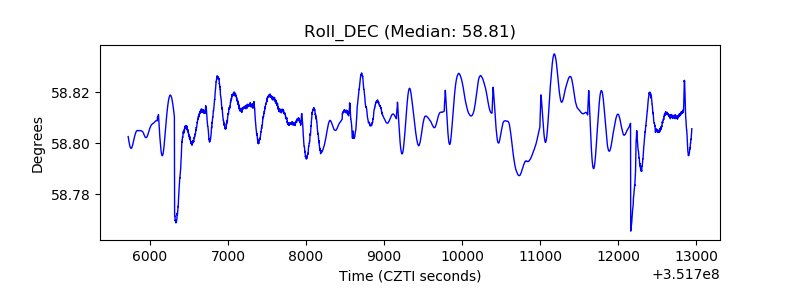 |
| _Roll_RA | 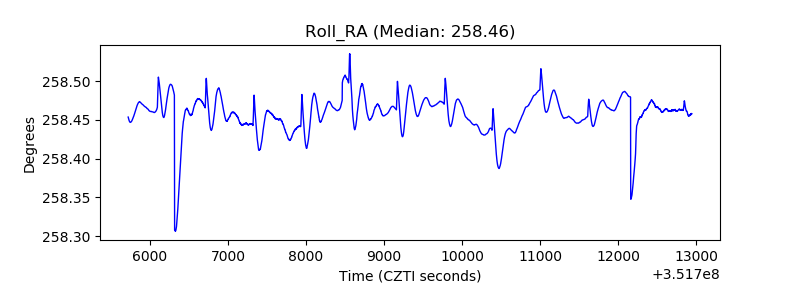 |
| Veto Counter |  |