| Param | Original file | Final file |
|---|---|---|
| Filename | modeM0/AS1A10_102T02_9000004200_29228cztM0_level2.evt | modeM0/AS1A10_102T02_9000004200_29228cztM0_level2_quad_clean.evt |
| Size (bytes) | 220,596,480 | 18,789,120 |
| Size | 210.4 MB | 17.9 MB |
| Events in quadrant A | 1,019,494 | 110,628 |
| Events in quadrant B | 1,284,587 | 108,896 |
| Events in quadrant C | 2,535,990 | 101,329 |
| Events in quadrant D | 1,698,794 | 97,742 |
| Mode SS | |||
|---|---|---|---|
| Quadrant | BADHDUFLAG | Total packets | Discarded packets |
| A | 0 | 42 | 0 |
| B | 0 | 42 | 0 |
| C | 0 | 42 | 0 |
| D | 0 | 42 | 0 |
| Mode M0 | |||
|---|---|---|---|
| Quadrant | BADHDUFLAG | Total packets | Discarded packets |
| A | 0 | 4248 | 1 |
| B | 0 | 5208 | 1 |
| C | 0 | 9002 | 1 |
| D | 0 | 6428 | 1 |
| Quadrant | Total seconds | Saturated seconds | Saturation percentage |
|---|---|---|---|
| A | 2059 | 3 | 0.145702% |
| B | 2060 | 45 | 2.184466% |
| C | 2060 | 318 | 15.436893% |
| D | 2060 | 219 | 10.631068% |
Noise dominated data is calculated using 1-second bins in cleaned event files. If a bin has >2000 counts, and if more than 50% of those come from <1% of pixels, then it is considered to be noise-dominated and hence unusable.
| Quadrant | # 1 sec bins | Bins with >0 counts | Bins with >2000 counts | High rate bins dominated by noise | Noise dominated (total time) | Noise dominated (detector-on time) | Marked lightcurve |
|---|---|---|---|---|---|---|---|
| A | 2059 | 2059 | 0 | 0 | 0.00% | 0.00% | 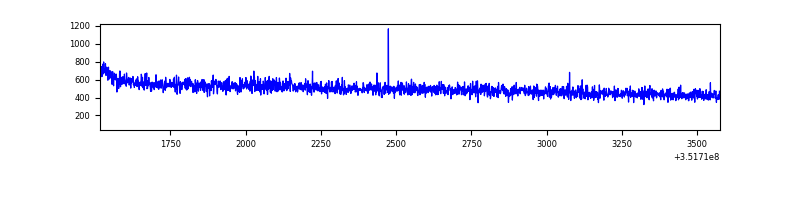 |
| B | 2060 | 2060 | 18 | 18 | 0.87% | 0.87% | 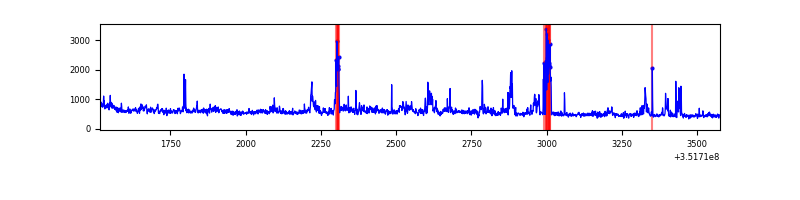 |
| C | 2060 | 2060 | 40 | 40 | 1.94% | 1.94% | 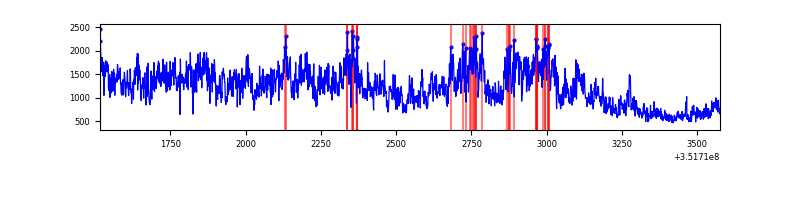 |
| D | 2060 | 2060 | 121 | 121 | 5.87% | 5.87% | 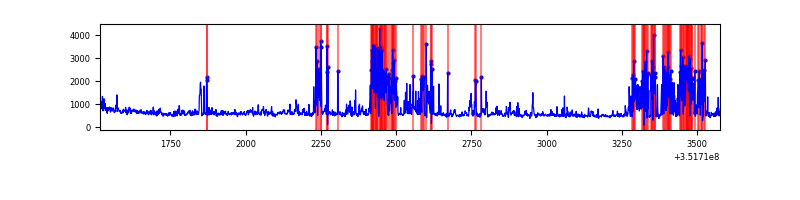 |
Top three noisy pixels from each quadrant. If the there are fewer than three noisy pixels in the level2.evt file, extra rows are filled as -1
| Pixel properties | Quadrant properties | ||||||
|---|---|---|---|---|---|---|---|
| Quadrant | DetID | PixID | Counts | Sigma | Mean | Median | Sigma |
| A | 13 | 254 | 4560 | 80.43 | 262 | 258 | 53.5 |
| A | 0 | 13 | 3756 | 65.4 | 262 | 258 | 53.5 |
| A | 3 | 137 | 2460 | 41.17 | 262 | 258 | 53.5 |
| B | 0 | 229 | 109930 | 2173.47 | 257 | 250 | 50.5 |
| B | 0 | 189 | 91676 | 1811.74 | 257 | 250 | 50.5 |
| B | 0 | 183 | 38000 | 748.07 | 257 | 250 | 50.5 |
| C | 3 | 233 | 1526168 | 26060.69 | 246 | 248 | 58.6 |
| C | 14 | 238 | 40255 | 683.27 | 246 | 248 | 58.6 |
| C | 2 | 114 | 5235 | 85.17 | 246 | 248 | 58.6 |
| D | 1 | 52 | 540341 | 9022.23 | 246 | 239 | 59.9 |
| D | 8 | 195 | 115042 | 1917.75 | 246 | 239 | 59.9 |
| D | 12 | 233 | 33316 | 552.54 | 246 | 239 | 59.9 |
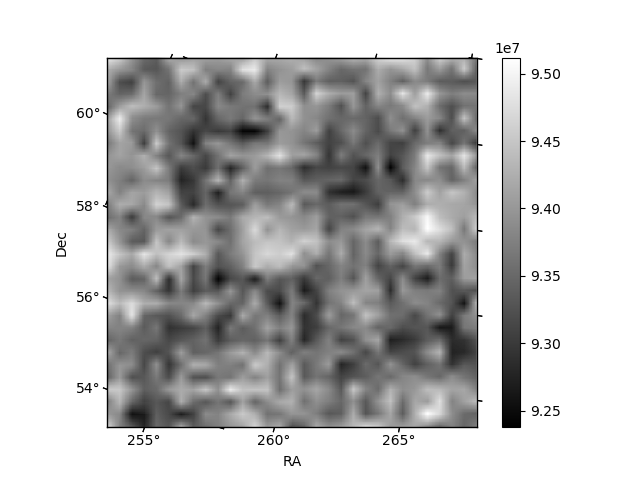
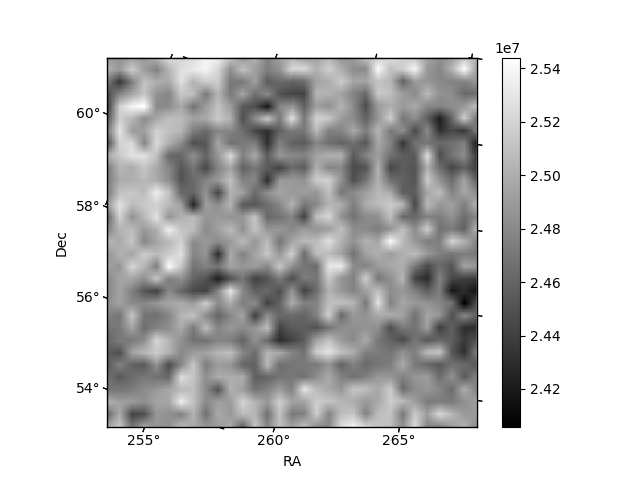
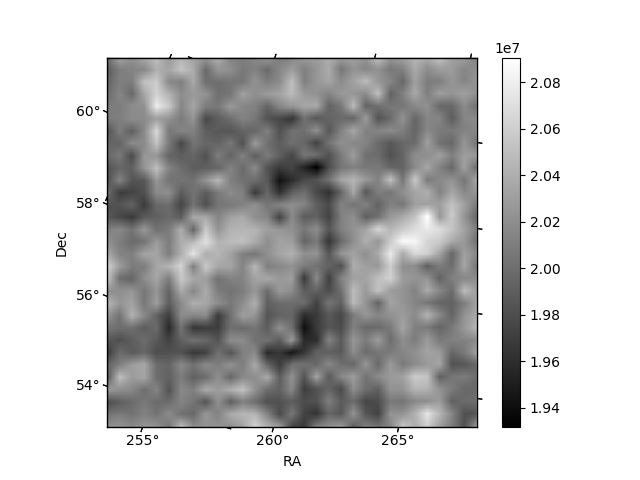
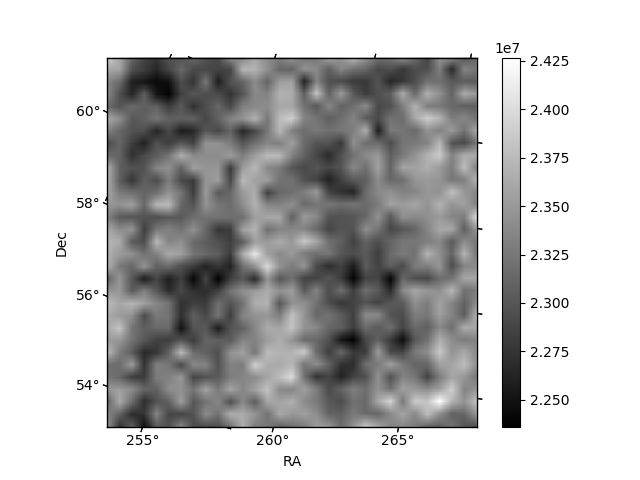
Histogram calculated using DETX and DETY for each event in the final _common_clean file
| Quadrant A |  |
 |
Quadrant B |
|---|---|---|---|
| Quadrant D |  |
 |
Quadrant C |
| Plot type | Count rate plots | Images |
|---|---|---|
| Comparison with Poisson distribution Blue bars denote a histogram of data divided into 1 sec bins. Red curve is a Poisson curve with rate = median count rate of data. |
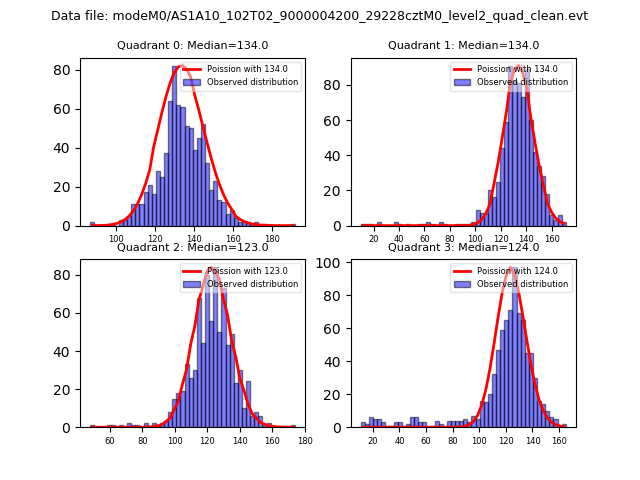 |
 |
| Quadrant-wise count rates Data is divided into 100 sec bins |
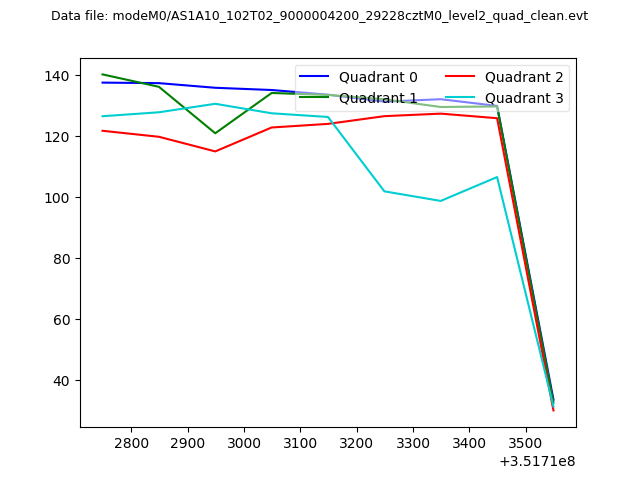 |
|
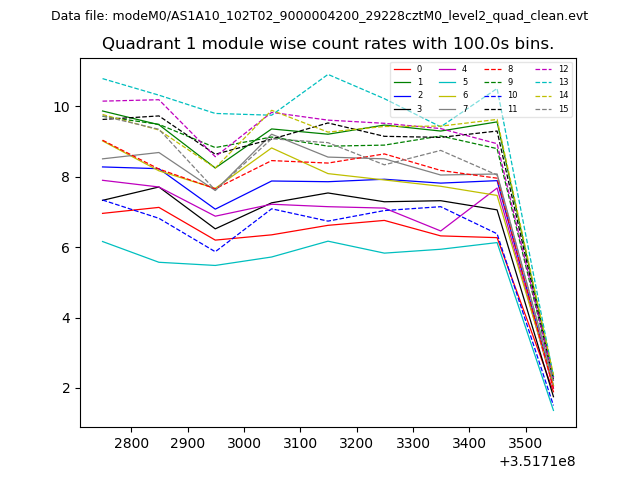
| Module-wise count rates for Quadrant A Data is divided into 100 sec bins |
 |
 |
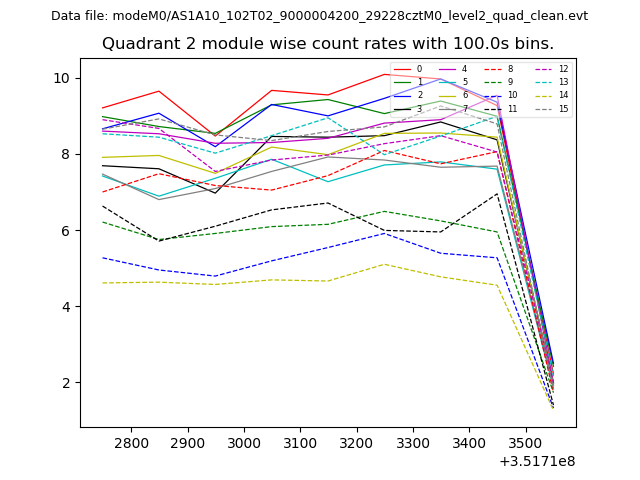
| Module-wise count rates for Quadrant B Data is divided into 100 sec bins |
 |
 |
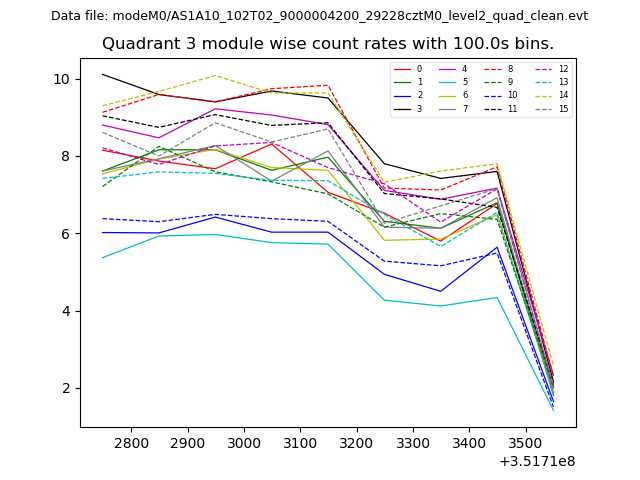
| Module-wise count rates for Quadrant C Data is divided into 100 sec bins |
 |
 |
| Module-wise count rates for Quadrant D Data is divided into 100 sec bins |
 |
 |
| Parameter | Plot |
|---|---|
| CZT HV Monitor | 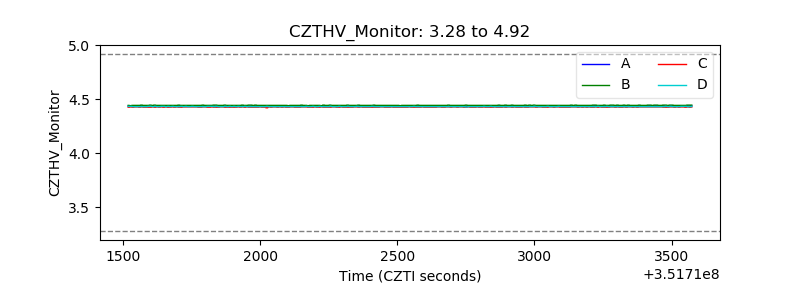 |
| D_VDD | 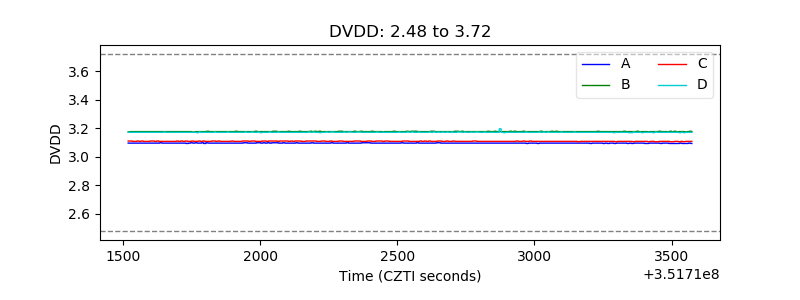 |
| Temperature 1 | 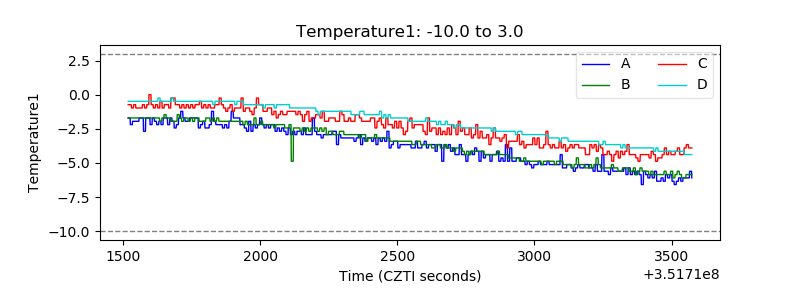 |
| Veto HV Monitor |  |
| Veto LLD | 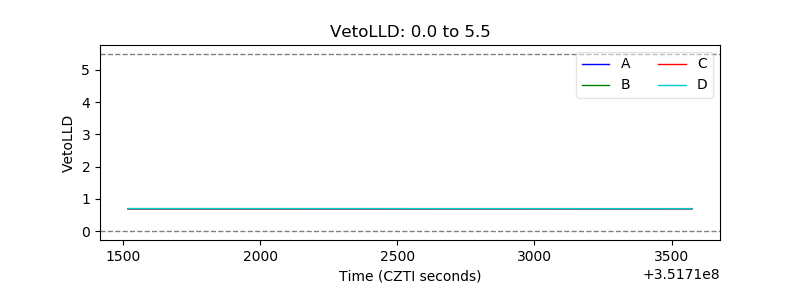 |
| Alpha Counter | 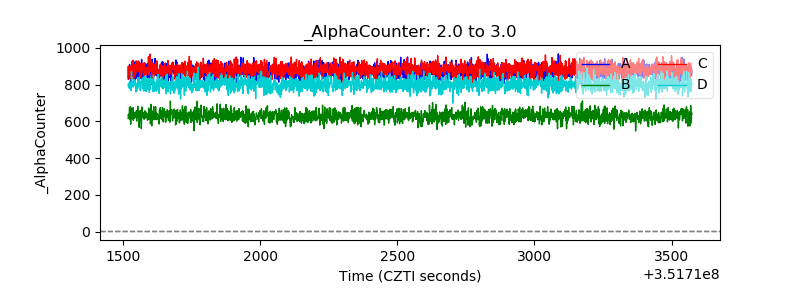 |
| _CPM_Rate | 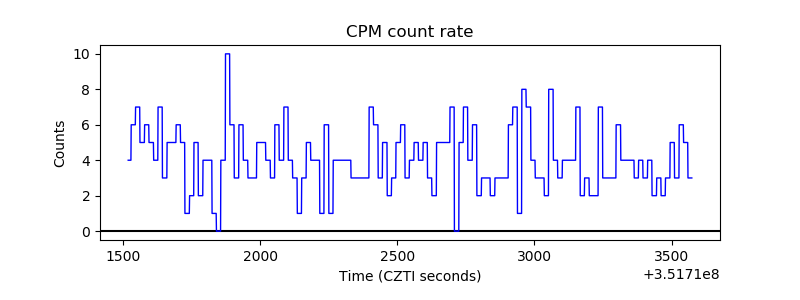 |
| CZT Counter | 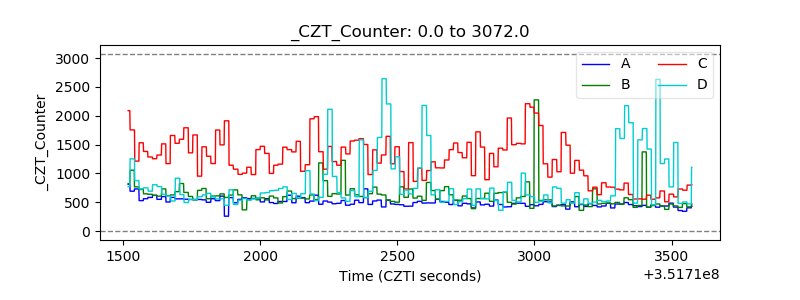 |
| +2.5 Volts monitor |  |
| +5 Volts monitor | 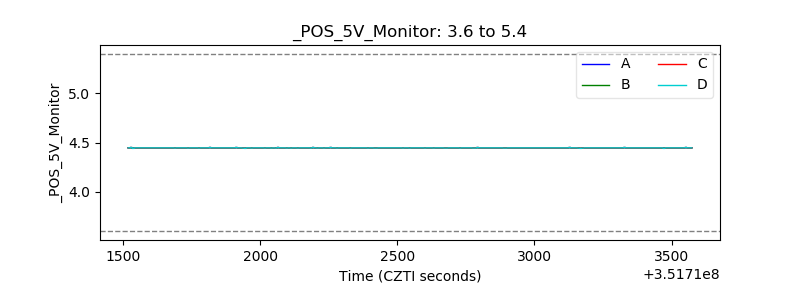 |
| _ROLL_ROT | 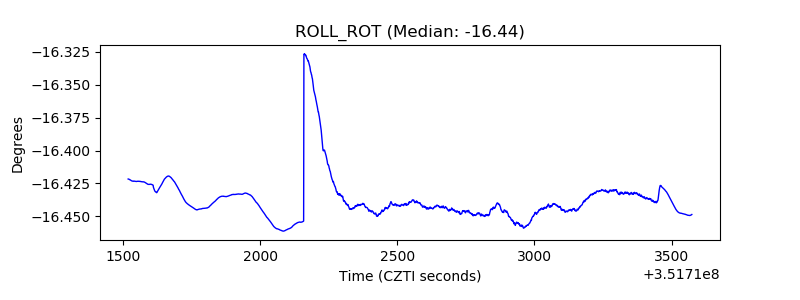 |
| _Roll_DEC |  |
| _Roll_RA | 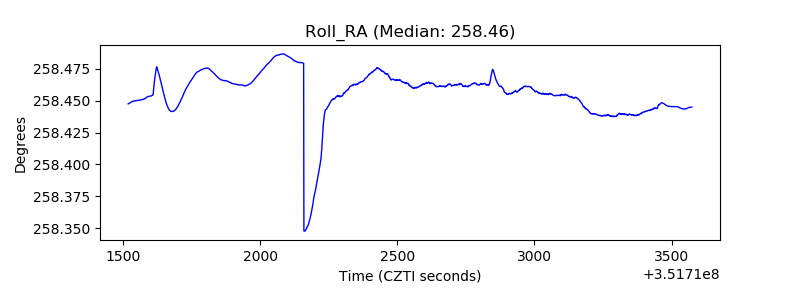 |
| Veto Counter | 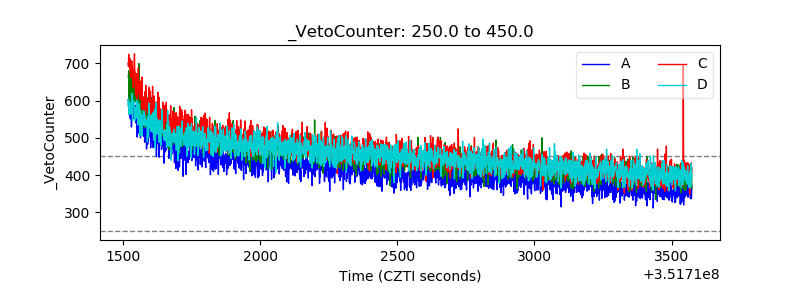 |