| Param | Original file | Final file |
|---|---|---|
| Filename | modeM0/AS1A10_115T03_9000004202cztM0_level2.fits | modeM0/AS1A10_115T03_9000004202cztM0_level2_quad_clean.evt |
| Size (bytes) | 298,368,000 | 296,838,720 |
| Size | 284.5 MB | 283.1 MB |
| Events in quadrant A | 1,840,998 | 1,797,061 |
| Events in quadrant B | 1,748,924 | 1,777,770 |
| Events in quadrant C | 1,724,420 | 1,672,954 |
| Events in quadrant D | 1,544,962 | 1,566,315 |
| Mode M9 | |||
|---|---|---|---|
| Quadrant | BADHDUFLAG | Total packets | Discarded packets |
| A | 0 | 21 | 0 |
| B | 0 | 21 | 0 |
| C | 0 | 21 | 0 |
| D | 0 | 21 | 0 |
| Mode SS | |||
|---|---|---|---|
| Quadrant | BADHDUFLAG | Total packets | Discarded packets |
| A | 0 | 644 | 0 |
| B | 0 | 644 | 0 |
| C | 0 | 644 | 0 |
| D | 0 | 644 | 0 |
| Mode M0 | |||
|---|---|---|---|
| Quadrant | BADHDUFLAG | Total packets | Discarded packets |
| A | 0 | 65490 | 0 |
| B | 0 | 75534 | 0 |
| C | 0 | 103985 | 0 |
| D | 0 | 90358 | 0 |
| Quadrant | Total seconds | Saturated seconds | Saturation percentage |
|---|---|---|---|
| A | 31648 | 224 | 0.707786% |
| B | 31648 | 891 | 2.815344% |
| C | 31648 | 2685 | 8.483948% |
| D | 31648 | 2022 | 6.389029% |
Noise dominated data is calculated using 1-second bins in cleaned event files. If a bin has >2000 counts, and if more than 50% of those come from <1% of pixels, then it is considered to be noise-dominated and hence unusable.
| Quadrant | # 1 sec bins | Bins with >0 counts | Bins with >2000 counts | High rate bins dominated by noise | Noise dominated (total time) | Noise dominated (detector-on time) | Marked lightcurve |
|---|---|---|---|---|---|---|---|
| A | 33798 | 31648 | 0 | 0 | 0.00% | 0.00% |  |
| B | 33798 | 31645 | 0 | 0 | 0.00% | 0.00% |  |
| C | 33798 | 31648 | 0 | 0 | 0.00% | 0.00% |  |
| D | 33798 | 31629 | 0 | 0 | 0.00% | 0.00% |  |
Top three noisy pixels from each quadrant. If the there are fewer than three noisy pixels in the level2.evt file, extra rows are filled as -1
| Pixel properties | Quadrant properties | ||||||
|---|---|---|---|---|---|---|---|
| Quadrant | DetID | PixID | Counts | Sigma | Mean | Median | Sigma |
| A | 0 | 29 | 1564 | 9.1 | 480 | 449 | 122.6 |
| A | 7 | 110 | 1433 | 8.03 | 480 | 449 | 122.6 |
| A | 9 | 19 | 1429 | 8.0 | 480 | 449 | 122.6 |
| B | 2 | 9 | 1471 | 11.3 | 460 | 437 | 91.5 |
| B | 2 | 8 | 1148 | 7.77 | 460 | 437 | 91.5 |
| B | 14 | 254 | 1128 | 7.55 | 460 | 437 | 91.5 |
| C | 12 | 241 | 1258 | 7.09 | 455 | 425 | 117.5 |
| C | 3 | 126 | 1194 | 6.54 | 455 | 425 | 117.5 |
| C | 9 | 233 | 1168 | 6.32 | 455 | 425 | 117.5 |
| D | 4 | 246 | 1194 | 6.7 | 440 | 401 | 118.3 |
| D | 15 | 46 | 1145 | 6.29 | 440 | 401 | 118.3 |
| D | 3 | 14 | 1135 | 6.21 | 440 | 401 | 118.3 |
Histogram calculated using DETX and DETY for each event in the final _common_clean file
| Quadrant A |  |
 |
Quadrant B |
|---|---|---|---|
| Quadrant D | 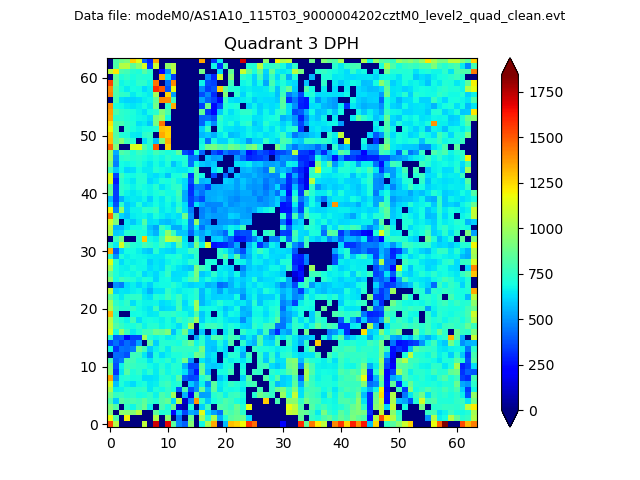 |
 |
Quadrant C |
| Plot type | Count rate plots | Images |
|---|---|---|
| Comparison with Poisson distribution Blue bars denote a histogram of data divided into 1 sec bins. Red curve is a Poisson curve with rate = median count rate of data. |
 |
 |
| Quadrant-wise count rates Data is divided into 100 sec bins |
 |
|
| Module-wise count rates for Quadrant A Data is divided into 100 sec bins |
 |
 |
| Module-wise count rates for Quadrant B Data is divided into 100 sec bins |
 |
 |
| Module-wise count rates for Quadrant C Data is divided into 100 sec bins |
 |
 |
| Module-wise count rates for Quadrant D Data is divided into 100 sec bins |
 |
 |
| Parameter | Plot |
|---|---|
| CZT HV Monitor |  |
| D_VDD |  |
| Temperature 1 |  |
| Veto HV Monitor |  |
| Veto LLD |  |
| Alpha Counter |  |
| _CPM_Rate |  |
| CZT Counter |  |
| +2.5 Volts monitor |  |
| +5 Volts monitor |  |
| _ROLL_ROT |  |
| _Roll_DEC |  |
| _Roll_RA |  |
| Veto Counter |  |