| Param | Original file | Final file |
|---|---|---|
| Filename | modeM0/AS1A10_115T03_9000004202_29228cztM0_level2.evt | modeM0/AS1A10_115T03_9000004202_29228cztM0_level2_quad_clean.evt |
| Size (bytes) | 429,814,080 | 61,050,240 |
| Size | 409.9 MB | 58.2 MB |
| Events in quadrant A | 2,067,816 | 400,396 |
| Events in quadrant B | 2,316,668 | 401,994 |
| Events in quadrant C | 5,403,382 | 367,850 |
| Events in quadrant D | 2,937,814 | 376,137 |
| Mode M9 | |||
|---|---|---|---|
| Quadrant | BADHDUFLAG | Total packets | Discarded packets |
| A | 0 | 7 | 0 |
| B | 0 | 7 | 0 |
| C | 0 | 7 | 0 |
| D | 0 | 7 | 0 |
| Mode SS | |||
|---|---|---|---|
| Quadrant | BADHDUFLAG | Total packets | Discarded packets |
| A | 0 | 88 | 0 |
| B | 0 | 88 | 0 |
| C | 0 | 88 | 0 |
| D | 0 | 88 | 0 |
| Mode M0 | |||
|---|---|---|---|
| Quadrant | BADHDUFLAG | Total packets | Discarded packets |
| A | 0 | 8885 | 1 |
| B | 0 | 9637 | 1 |
| C | 0 | 19120 | 1 |
| D | 0 | 11563 | 1 |
| Quadrant | Total seconds | Saturated seconds | Saturation percentage |
|---|---|---|---|
| A | 4290 | 36 | 0.839161% |
| B | 4290 | 94 | 2.191142% |
| C | 4290 | 732 | 17.062937% |
| D | 4290 | 181 | 4.219114% |
Noise dominated data is calculated using 1-second bins in cleaned event files. If a bin has >2000 counts, and if more than 50% of those come from <1% of pixels, then it is considered to be noise-dominated and hence unusable.
| Quadrant | # 1 sec bins | Bins with >0 counts | Bins with >2000 counts | High rate bins dominated by noise | Noise dominated (total time) | Noise dominated (detector-on time) | Marked lightcurve |
|---|---|---|---|---|---|---|---|
| A | 5015 | 4291 | 0 | 0 | 0.00% | 0.00% |  |
| B | 5015 | 4291 | 12 | 12 | 0.24% | 0.28% |  |
| C | 5015 | 4291 | 241 | 241 | 4.81% | 5.62% |  |
| D | 5015 | 4291 | 83 | 83 | 1.66% | 1.93% |  |
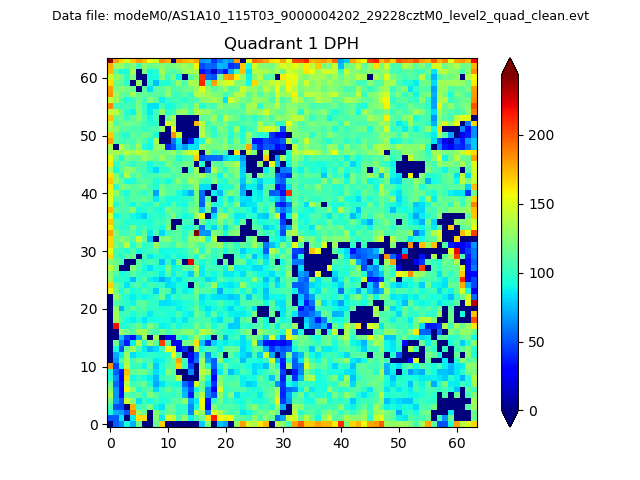
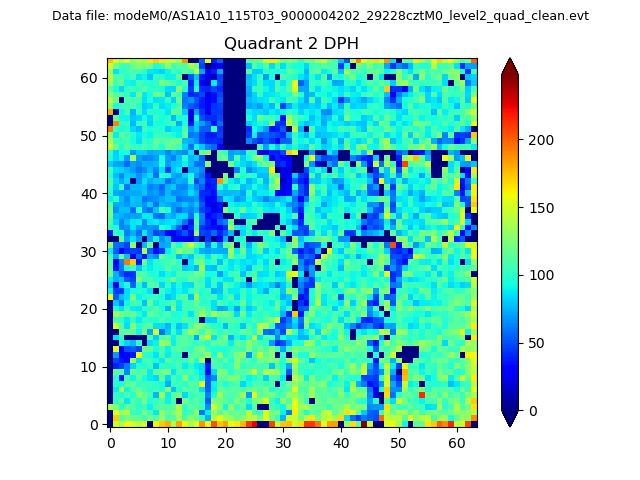
Top three noisy pixels from each quadrant. If the there are fewer than three noisy pixels in the level2.evt file, extra rows are filled as -1
| Pixel properties | Quadrant properties | ||||||
|---|---|---|---|---|---|---|---|
| Quadrant | DetID | PixID | Counts | Sigma | Mean | Median | Sigma |
| A | 13 | 254 | 8334 | 72.34 | 535 | 524 | 108.0 |
| A | 3 | 137 | 5419 | 45.34 | 535 | 524 | 108.0 |
| A | 0 | 226 | 4516 | 36.97 | 535 | 524 | 108.0 |
| B | 0 | 229 | 107426 | 1042.84 | 528 | 515 | 102.5 |
| B | 10 | 245 | 89616 | 869.11 | 528 | 515 | 102.5 |
| B | 0 | 183 | 34496 | 331.46 | 528 | 515 | 102.5 |
| C | 3 | 233 | 3400109 | 29562.57 | 491 | 494 | 115.0 |
| C | 14 | 238 | 78153 | 675.31 | 491 | 494 | 115.0 |
| C | 2 | 114 | 9848 | 81.34 | 491 | 494 | 115.0 |
| D | 1 | 52 | 691240 | 5681.49 | 511 | 497 | 121.6 |
| D | 8 | 195 | 101125 | 827.68 | 511 | 497 | 121.6 |
| D | 13 | 153 | 78748 | 643.63 | 511 | 497 | 121.6 |
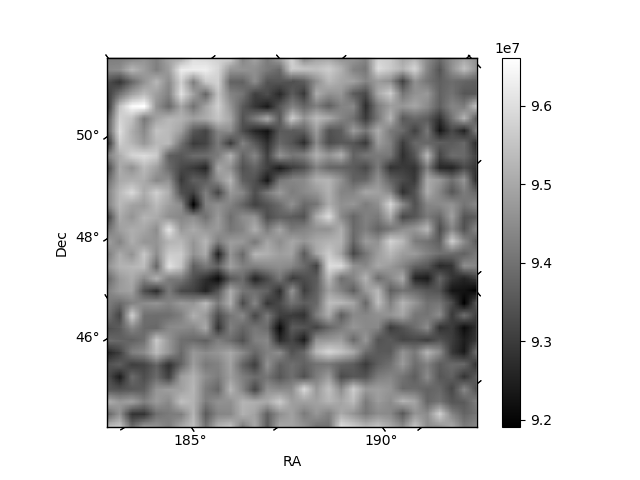
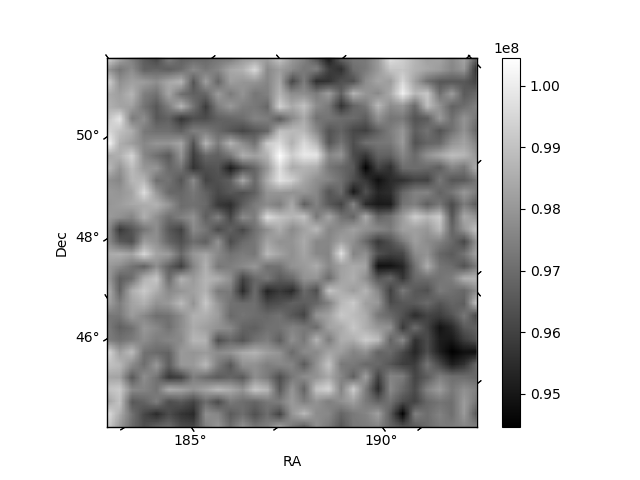
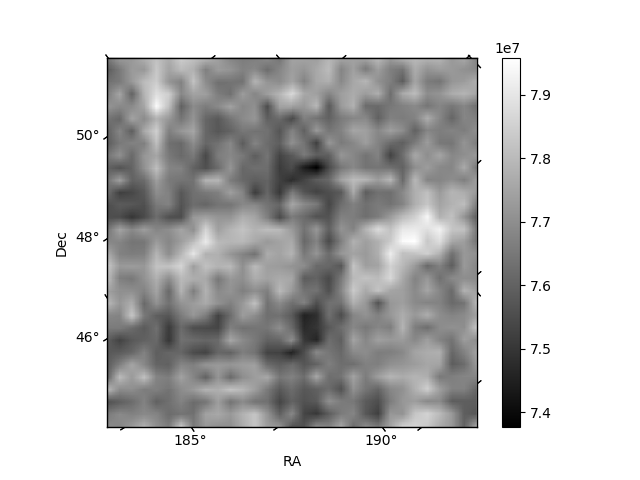
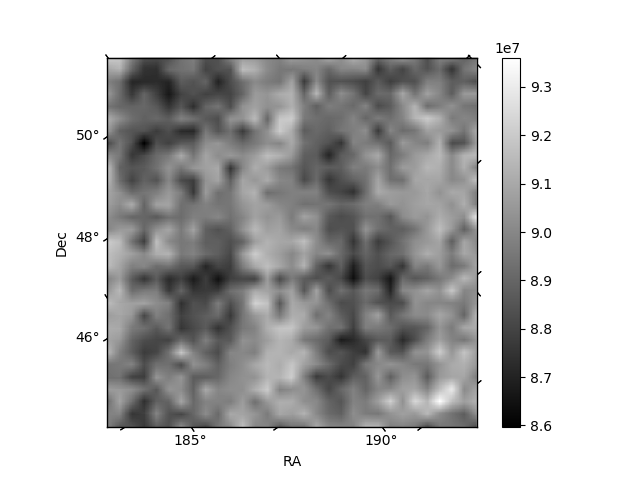
Histogram calculated using DETX and DETY for each event in the final _common_clean file
| Quadrant A | 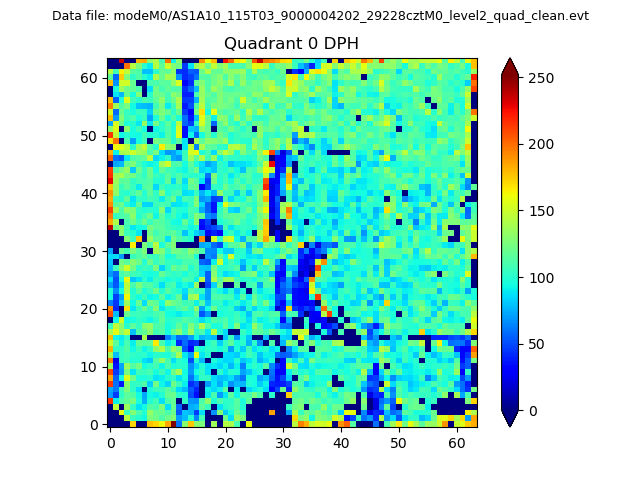 |
 |
Quadrant B |
|---|---|---|---|
| Quadrant D | 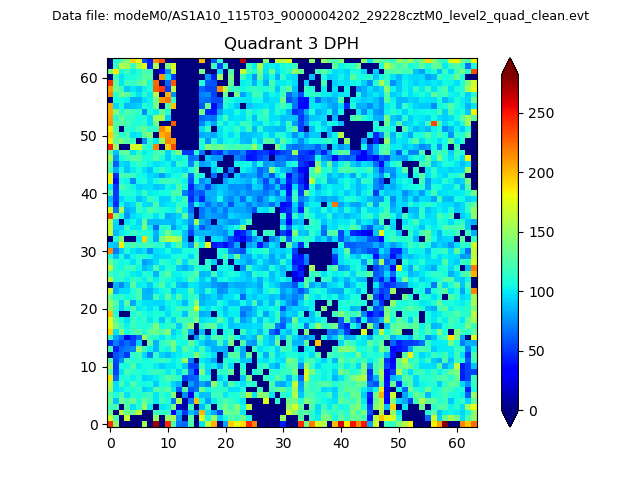 |
 |
Quadrant C |
| Plot type | Count rate plots | Images |
|---|---|---|
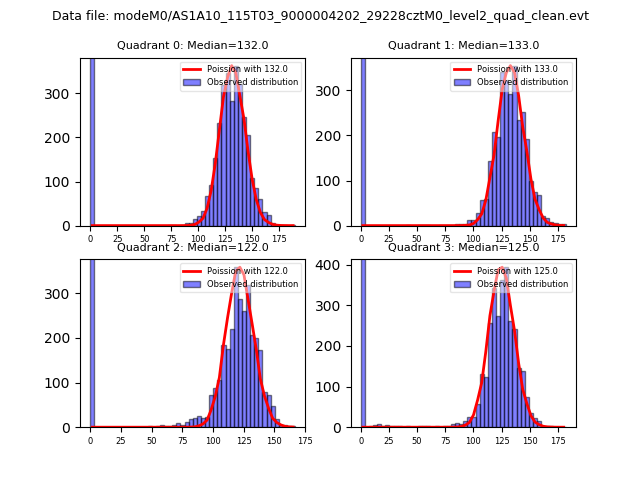
| Comparison with Poisson distribution Blue bars denote a histogram of data divided into 1 sec bins. Red curve is a Poisson curve with rate = median count rate of data. |
 |
 |
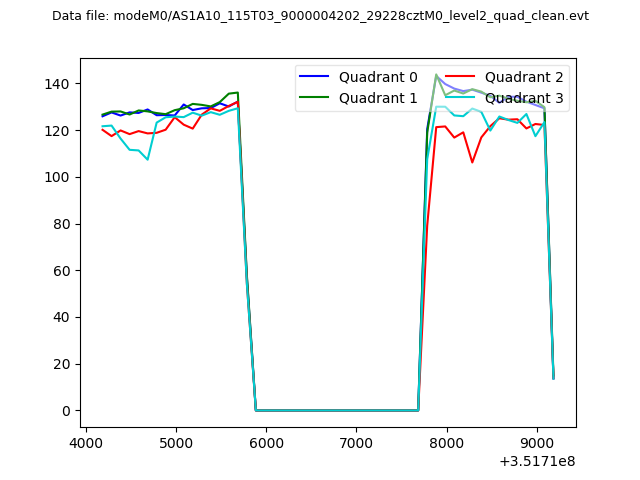
| Quadrant-wise count rates Data is divided into 100 sec bins |
 |
|
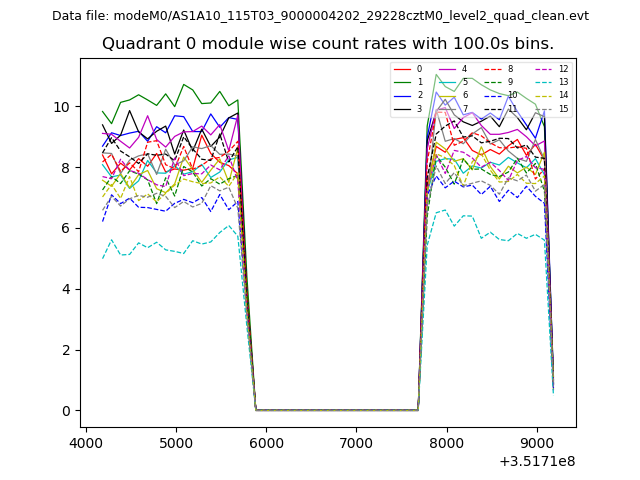
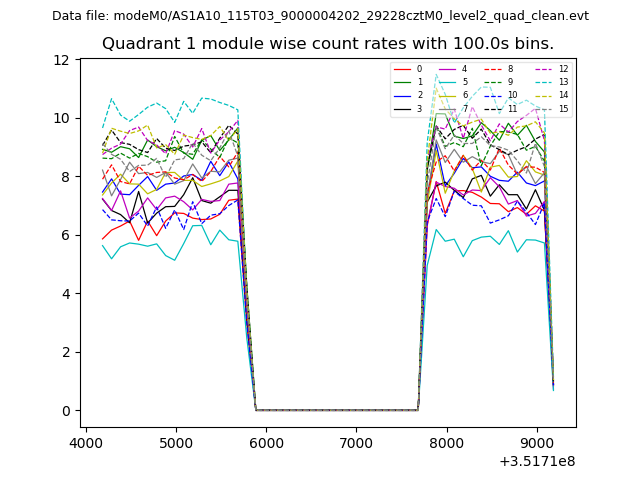
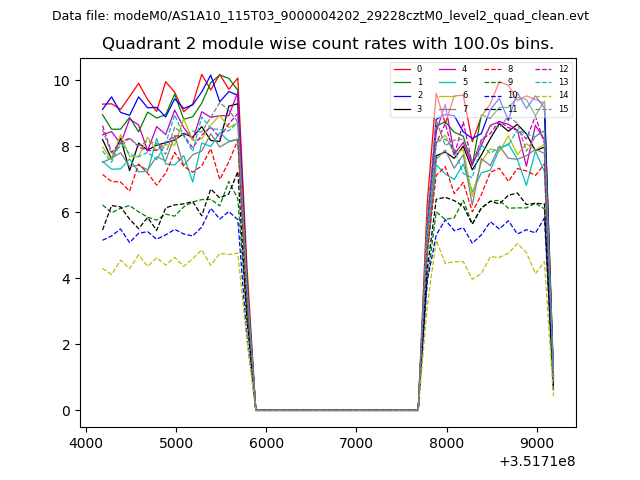
| Module-wise count rates for Quadrant A Data is divided into 100 sec bins |
 |
 |
| Module-wise count rates for Quadrant B Data is divided into 100 sec bins |
 |
 |
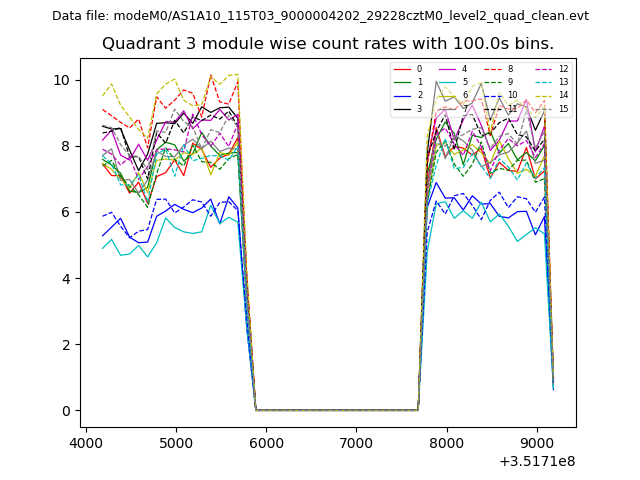
| Module-wise count rates for Quadrant C Data is divided into 100 sec bins |
 |
 |
| Module-wise count rates for Quadrant D Data is divided into 100 sec bins |
 |
 |
| Parameter | Plot |
|---|---|
| CZT HV Monitor | 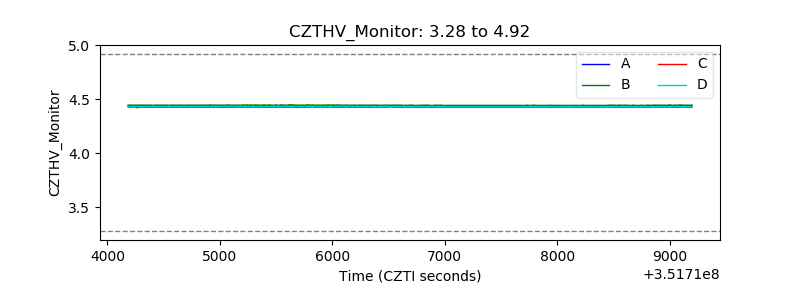 |
| D_VDD | 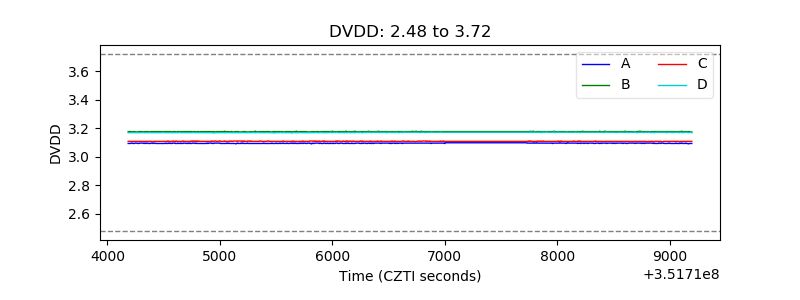 |
| Temperature 1 | 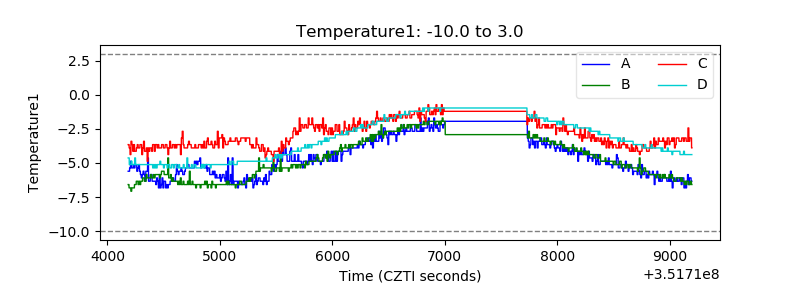 |
| Veto HV Monitor | 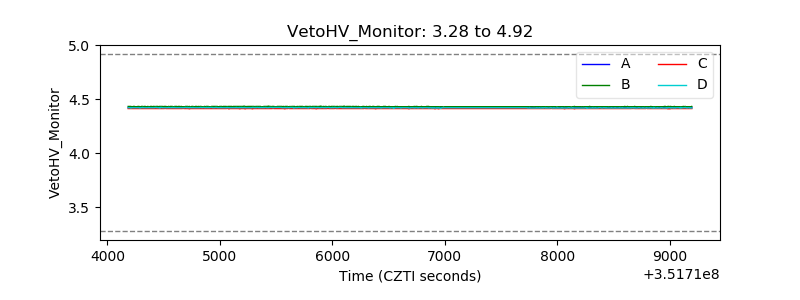 |
| Veto LLD | 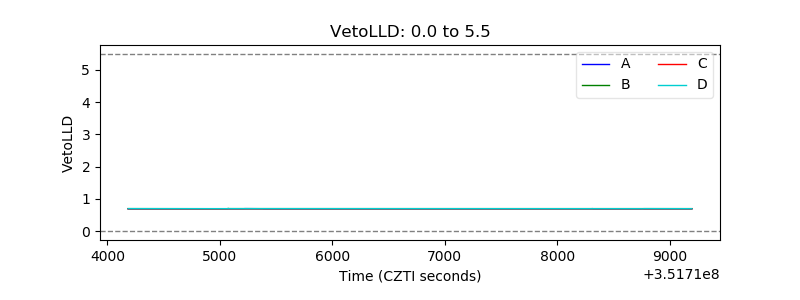 |
| Alpha Counter | 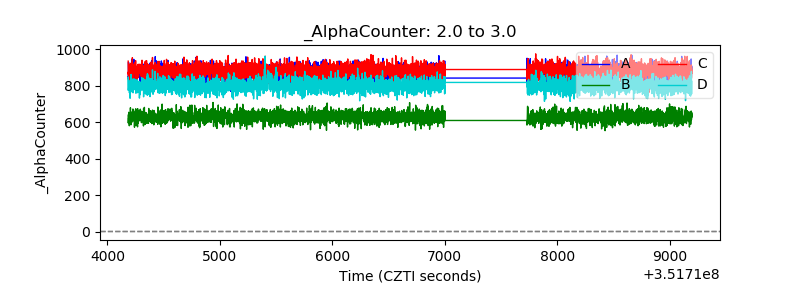 |
| _CPM_Rate | 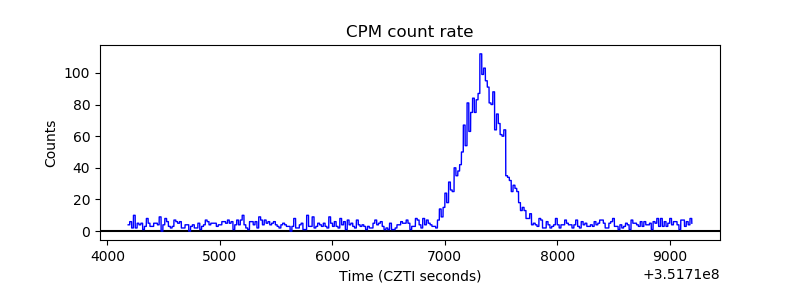 |
| CZT Counter | 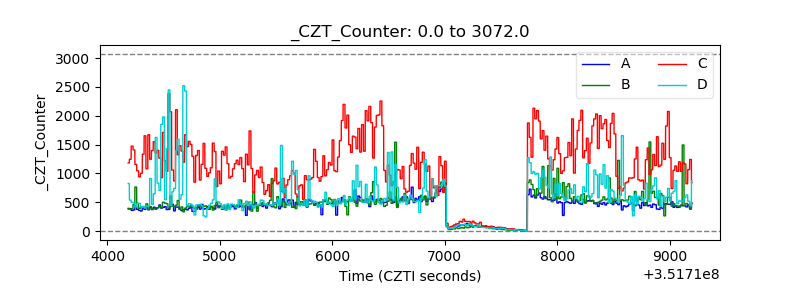 |
| +2.5 Volts monitor | 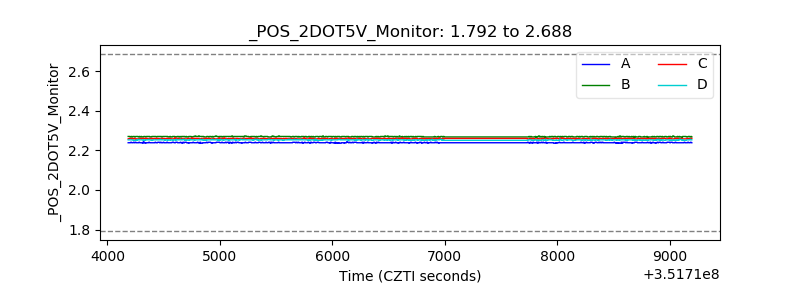 |
| +5 Volts monitor | 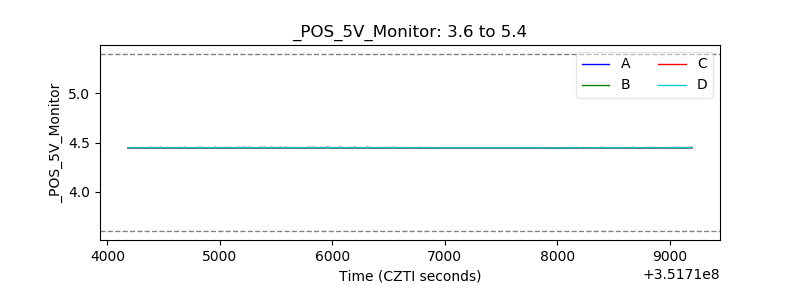 |
| _ROLL_ROT | 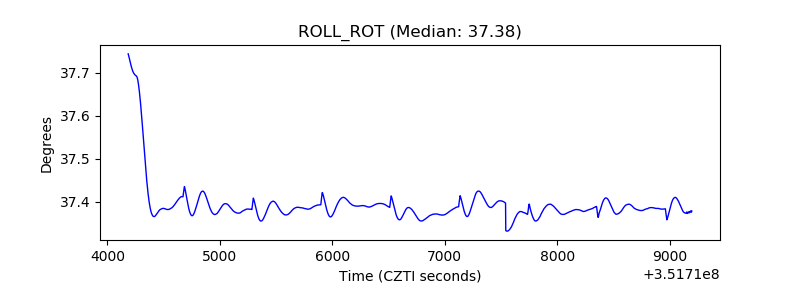 |
| _Roll_DEC | 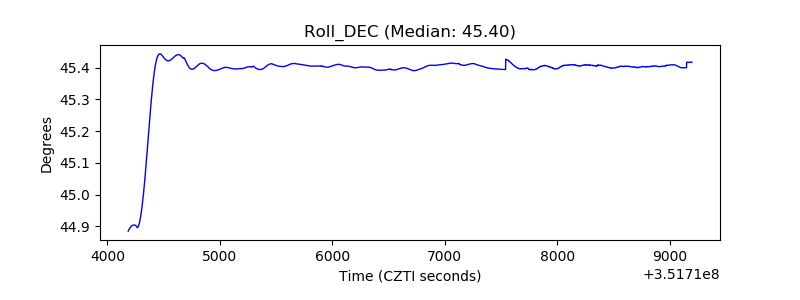 |
| _Roll_RA | 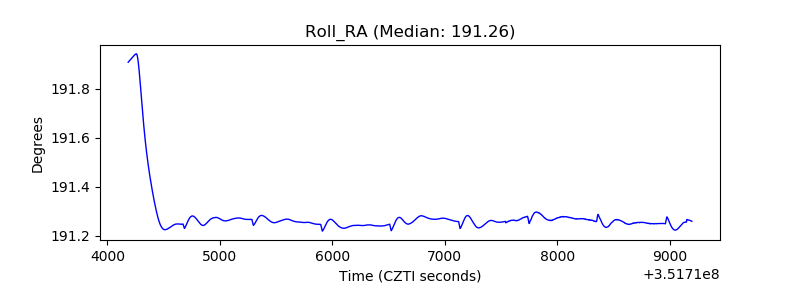 |
| Veto Counter | 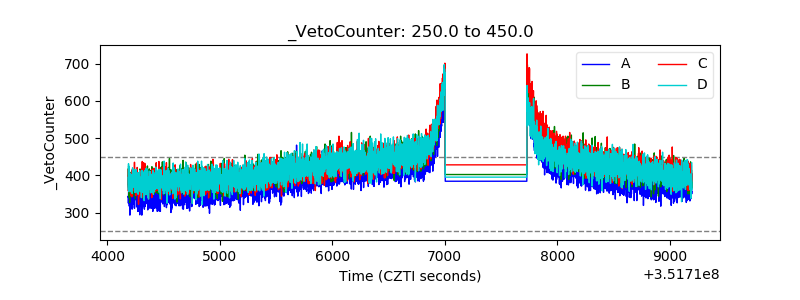 |