| Param | Original file | Final file |
|---|---|---|
| Filename | modeM0/AS1A10_115T03_9000004202_29229cztM0_level2.evt | modeM0/AS1A10_115T03_9000004202_29229cztM0_level2_quad_clean.evt |
| Size (bytes) | 825,007,680 | 106,908,480 |
| Size | 786.8 MB | 102.0 MB |
| Events in quadrant A | 3,805,771 | 698,895 |
| Events in quadrant B | 4,956,072 | 699,467 |
| Events in quadrant C | 9,167,537 | 643,785 |
| Events in quadrant D | 6,526,316 | 649,184 |
| Mode M9 | |||
|---|---|---|---|
| Quadrant | BADHDUFLAG | Total packets | Discarded packets |
| A | 0 | 10 | 0 |
| B | 0 | 10 | 0 |
| C | 0 | 10 | 0 |
| D | 0 | 10 | 0 |
| Mode SS | |||
|---|---|---|---|
| Quadrant | BADHDUFLAG | Total packets | Discarded packets |
| A | 0 | 162 | 0 |
| B | 0 | 162 | 0 |
| C | 0 | 162 | 0 |
| D | 0 | 162 | 0 |
| Mode M0 | |||
|---|---|---|---|
| Quadrant | BADHDUFLAG | Total packets | Discarded packets |
| A | 0 | 16560 | 2 |
| B | 0 | 20063 | 2 |
| C | 0 | 32847 | 4 |
| D | 0 | 24785 | 2 |
| Quadrant | Total seconds | Saturated seconds | Saturation percentage |
|---|---|---|---|
| A | 7850 | 85 | 1.082803% |
| B | 7850 | 323 | 4.114650% |
| C | 7849 | 1262 | 16.078481% |
| D | 7849 | 856 | 10.905848% |
Noise dominated data is calculated using 1-second bins in cleaned event files. If a bin has >2000 counts, and if more than 50% of those come from <1% of pixels, then it is considered to be noise-dominated and hence unusable.
| Quadrant | # 1 sec bins | Bins with >0 counts | Bins with >2000 counts | High rate bins dominated by noise | Noise dominated (total time) | Noise dominated (detector-on time) | Marked lightcurve |
|---|---|---|---|---|---|---|---|
| A | 8895 | 7852 | 1 | 1 | 0.01% | 0.01% | 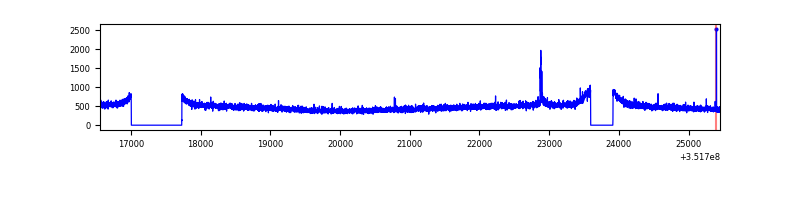 |
| B | 8895 | 7852 | 52 | 52 | 0.58% | 0.66% | 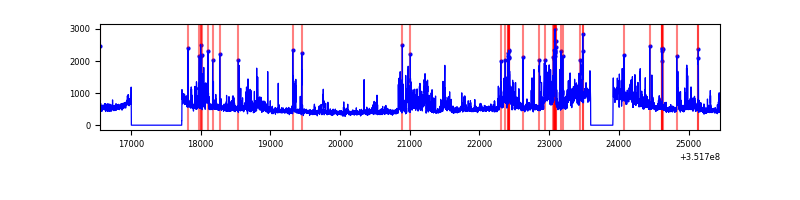 |
| C | 8894 | 7851 | 242 | 242 | 2.72% | 3.08% | 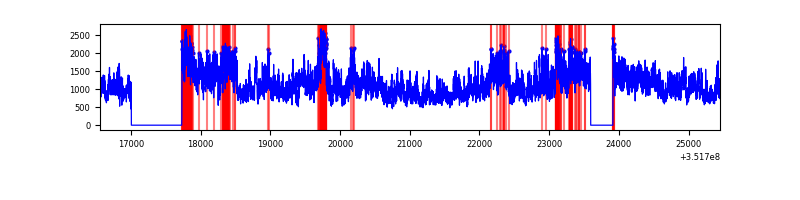 |
| D | 8894 | 7850 | 439 | 439 | 4.94% | 5.59% | 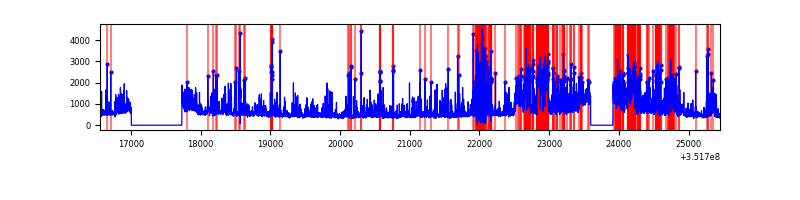 |
Top three noisy pixels from each quadrant. If the there are fewer than three noisy pixels in the level2.evt file, extra rows are filled as -1
| Pixel properties | Quadrant properties | ||||||
|---|---|---|---|---|---|---|---|
| Quadrant | DetID | PixID | Counts | Sigma | Mean | Median | Sigma |
| A | 15 | 174 | 30433 | 149.98 | 974 | 954 | 196.5 |
| A | 0 | 13 | 15377 | 73.38 | 974 | 954 | 196.5 |
| A | 13 | 254 | 14973 | 71.33 | 974 | 954 | 196.5 |
| B | 10 | 245 | 858488 | 4642.54 | 962 | 937 | 184.7 |
| B | 0 | 229 | 140585 | 756.01 | 962 | 937 | 184.7 |
| B | 0 | 183 | 99941 | 535.98 | 962 | 937 | 184.7 |
| C | 3 | 233 | 5492057 | 25792.77 | 902 | 905 | 212.9 |
| C | 14 | 238 | 143754 | 670.98 | 902 | 905 | 212.9 |
| C | 2 | 114 | 18250 | 81.47 | 902 | 905 | 212.9 |
| D | 1 | 52 | 2081457 | 9594.74 | 912 | 887 | 216.8 |
| D | 12 | 233 | 442548 | 2036.76 | 912 | 887 | 216.8 |
| D | 8 | 195 | 206372 | 947.61 | 912 | 887 | 216.8 |
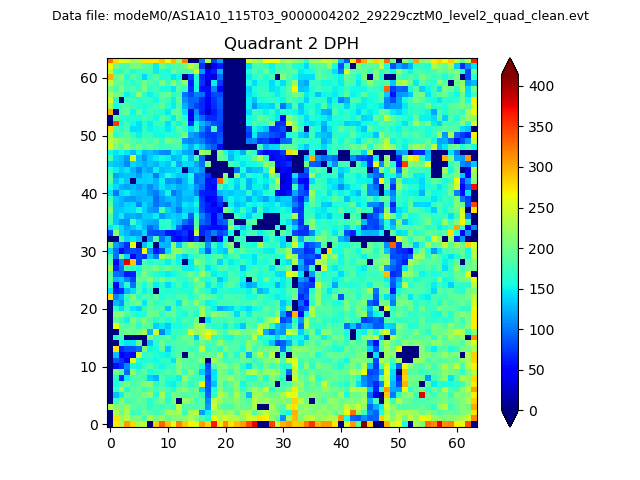
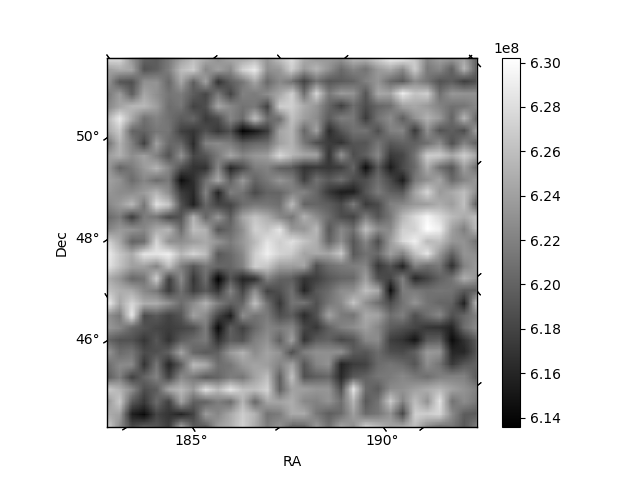
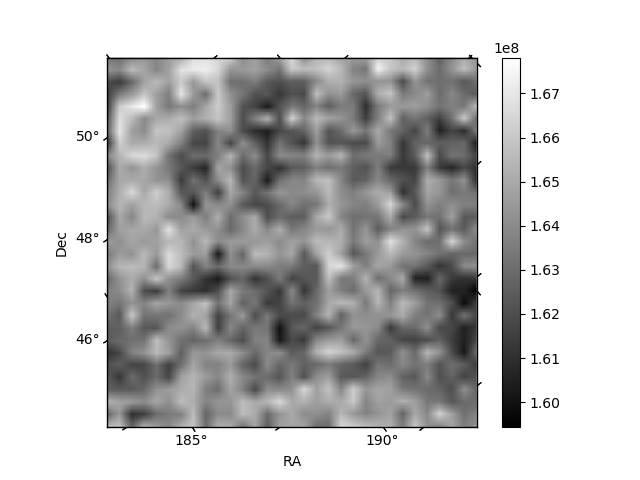
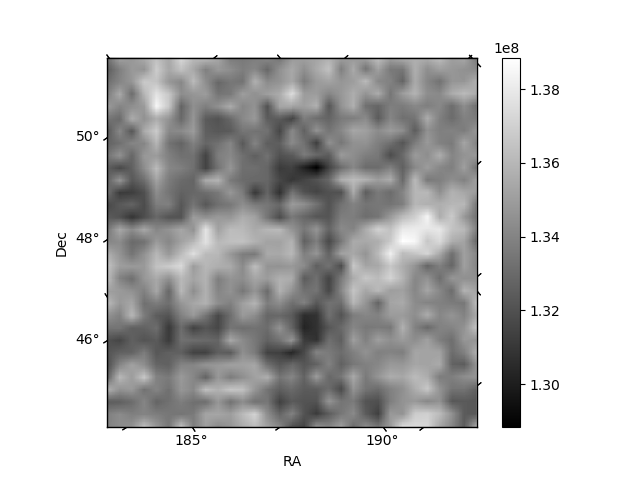
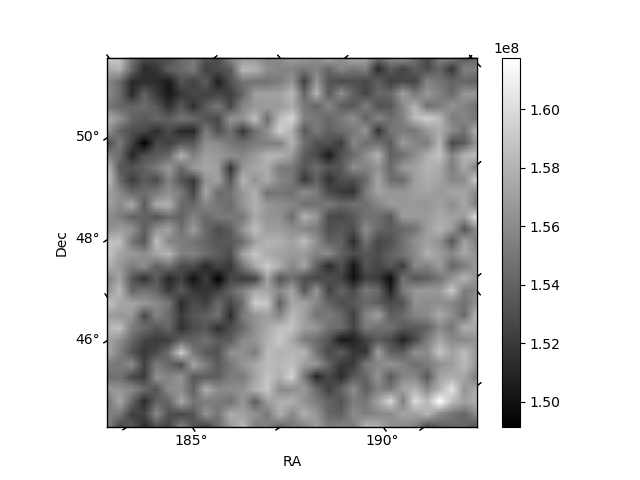
Histogram calculated using DETX and DETY for each event in the final _common_clean file
| Quadrant A | 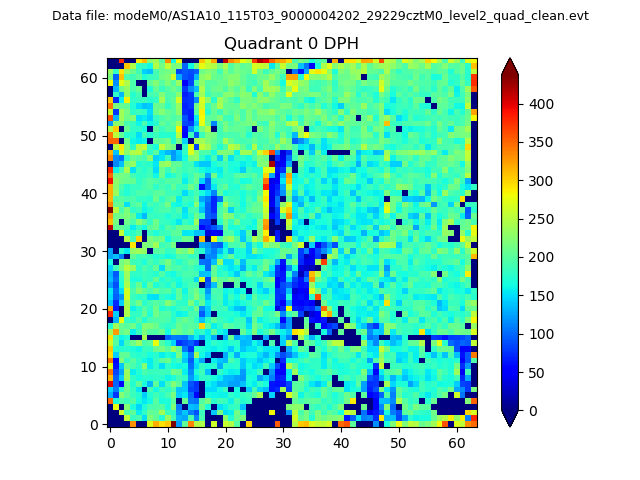 |
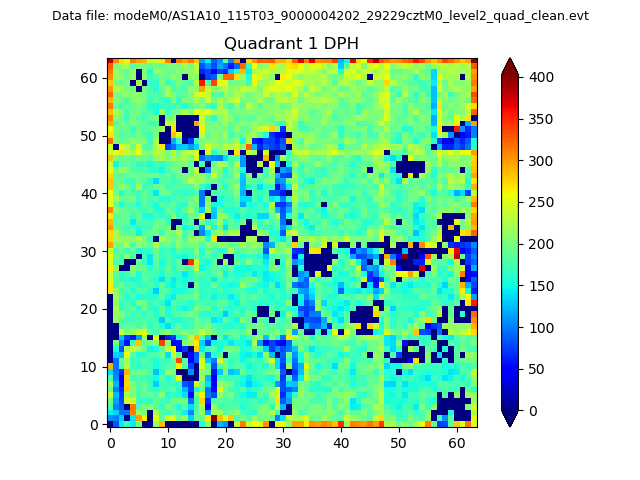 |
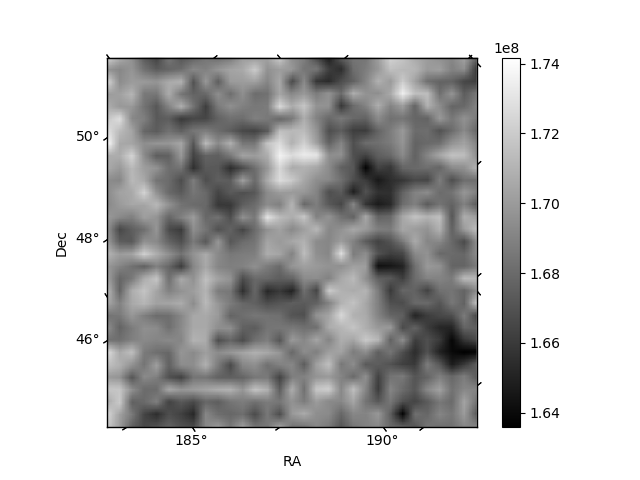
Quadrant B |
|---|---|---|---|
| Quadrant D | 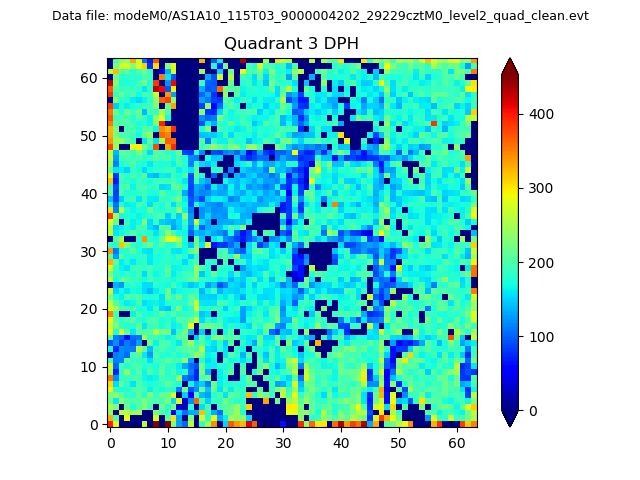 |
 |
Quadrant C |
| Plot type | Count rate plots | Images |
|---|---|---|
| Comparison with Poisson distribution Blue bars denote a histogram of data divided into 1 sec bins. Red curve is a Poisson curve with rate = median count rate of data. |
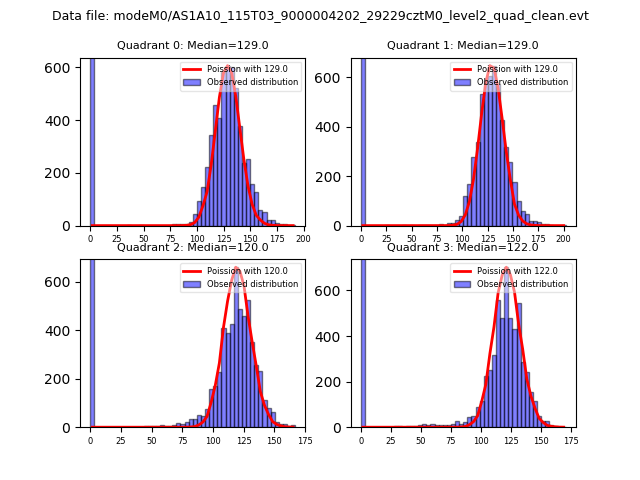 |
 |
| Quadrant-wise count rates Data is divided into 100 sec bins |
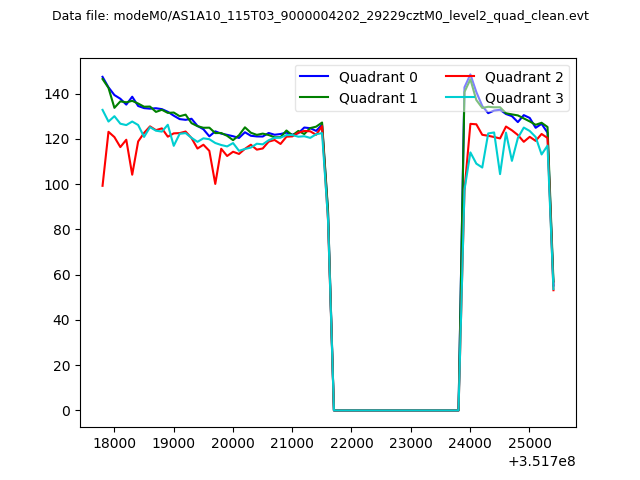 |
|
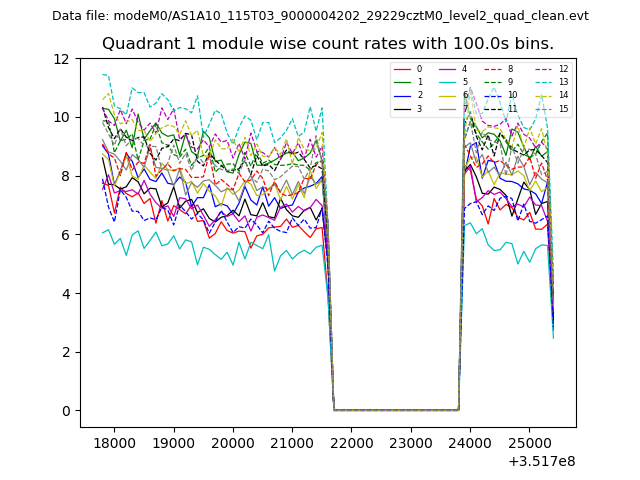
| Module-wise count rates for Quadrant A Data is divided into 100 sec bins |
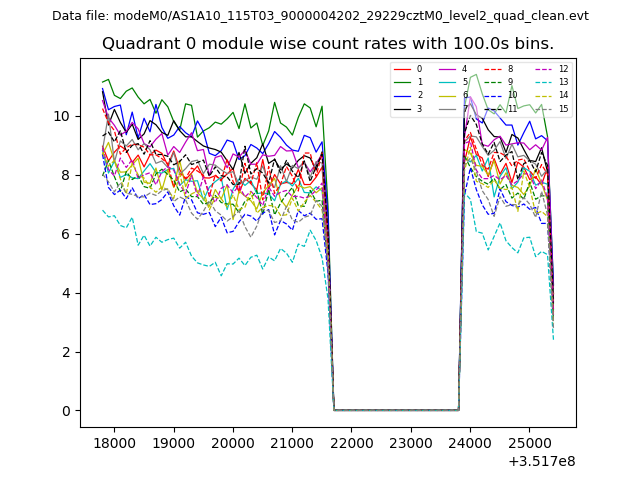 |
 |
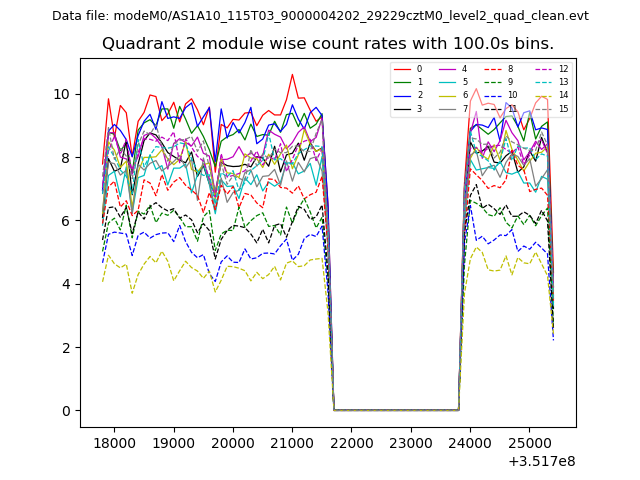
| Module-wise count rates for Quadrant B Data is divided into 100 sec bins |
 |
 |
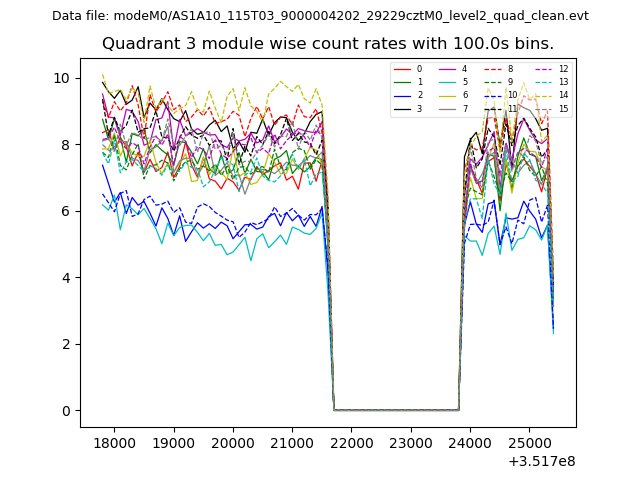
| Module-wise count rates for Quadrant C Data is divided into 100 sec bins |
 |
 |
| Module-wise count rates for Quadrant D Data is divided into 100 sec bins |
 |
 |
| Parameter | Plot |
|---|---|
| CZT HV Monitor | 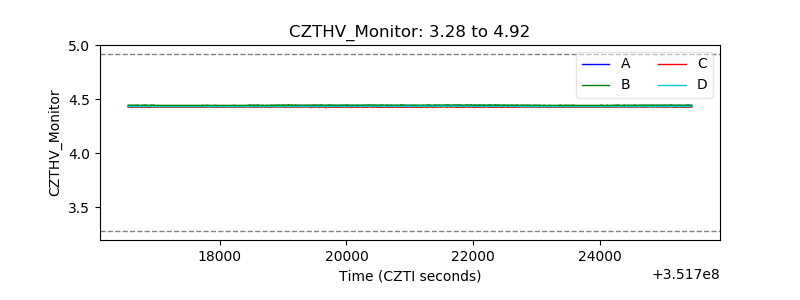 |
| D_VDD | 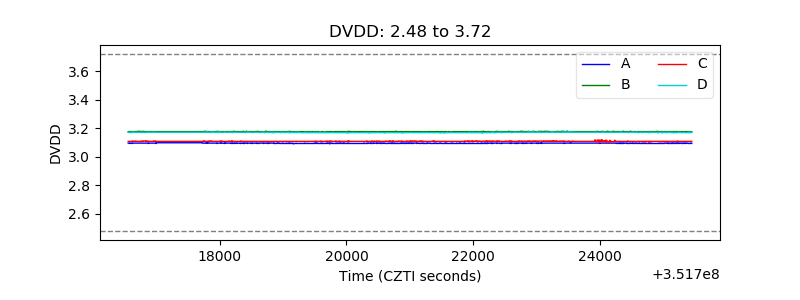 |
| Temperature 1 | 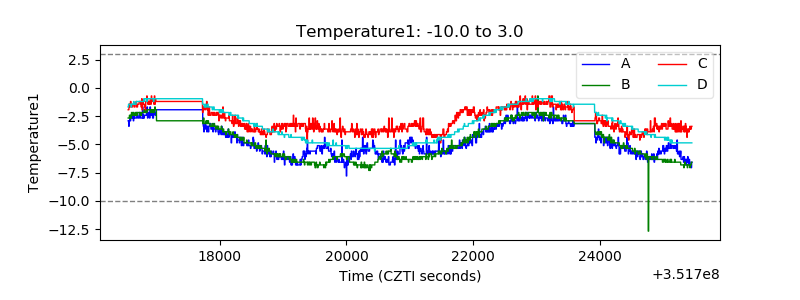 |
| Veto HV Monitor | 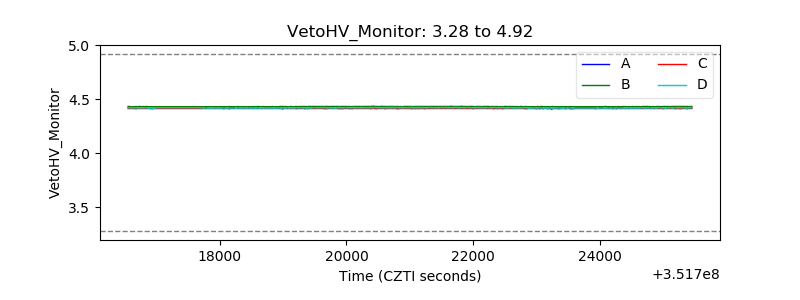 |
| Veto LLD | 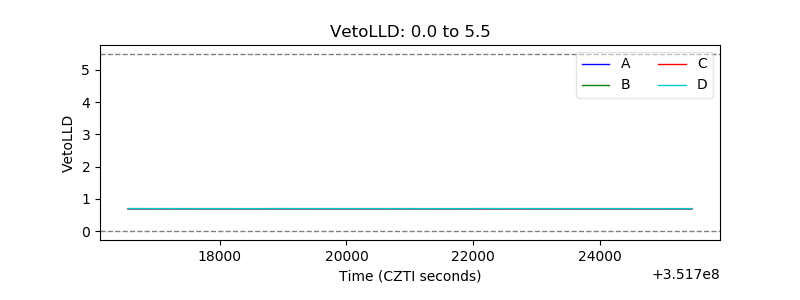 |
| Alpha Counter | 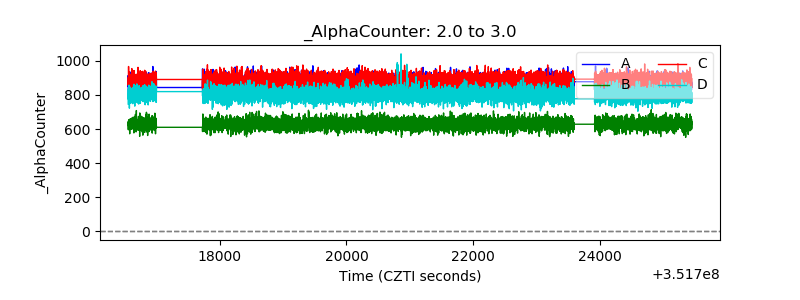 |
| _CPM_Rate |  |
| CZT Counter | 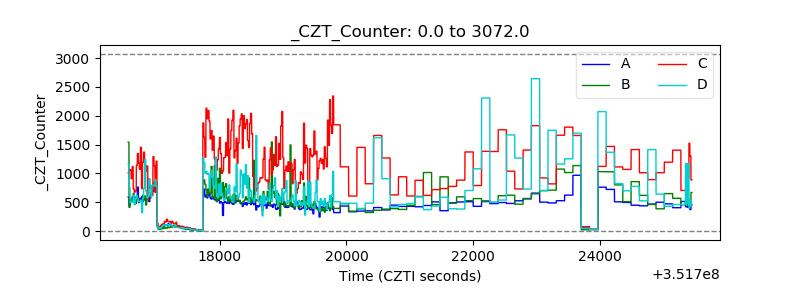 |
| +2.5 Volts monitor |  |
| +5 Volts monitor |  |
| _ROLL_ROT | 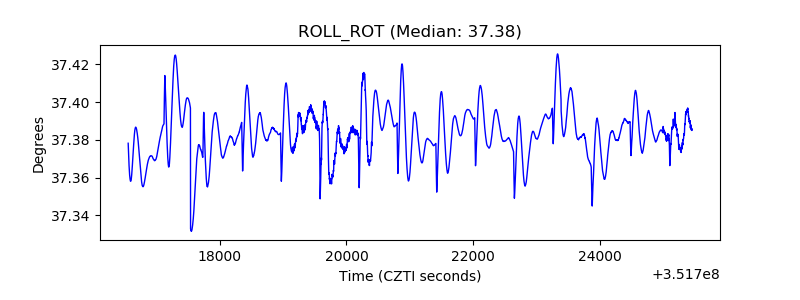 |
| _Roll_DEC | 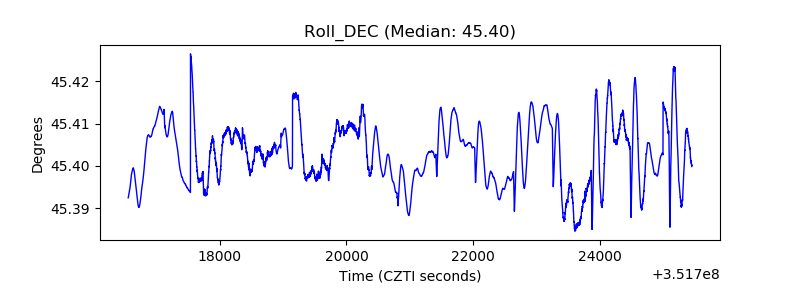 |
| _Roll_RA | 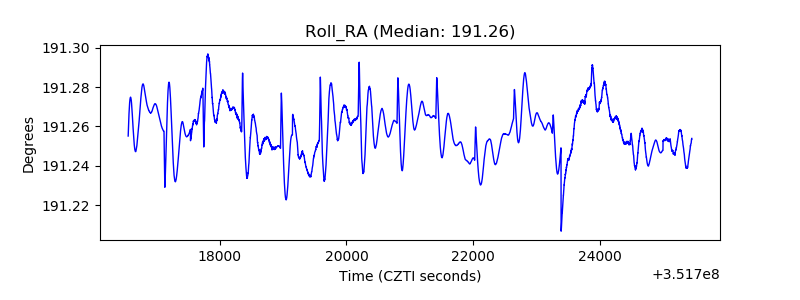 |
| Veto Counter | 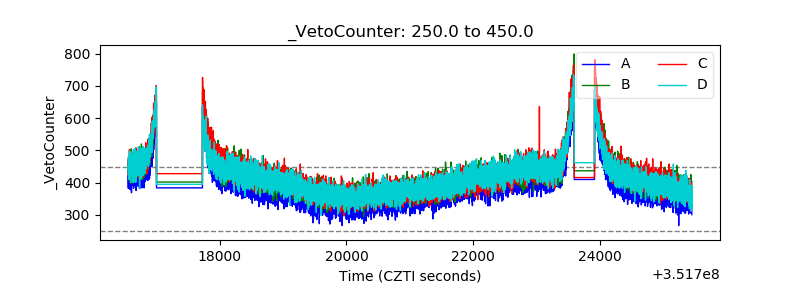 |