| Param | Original file | Final file |
|---|---|---|
| Filename | modeM0/AS1T03_272T01_9000004204cztM0_level2.fits | modeM0/AS1T03_272T01_9000004204cztM0_level2_quad_clean.evt |
| Size (bytes) | 720,627,840 | 599,906,880 |
| Size | 687.2 MB | 572.1 MB |
| Events in quadrant A | 4,760,312 | 3,798,530 |
| Events in quadrant B | 4,444,594 | 3,760,200 |
| Events in quadrant C | 4,017,602 | 2,765,103 |
| Events in quadrant D | 3,464,068 | 2,722,105 |
| Mode M9 | |||
|---|---|---|---|
| Quadrant | BADHDUFLAG | Total packets | Discarded packets |
| A | 0 | 121 | 0 |
| B | 0 | 121 | 0 |
| C | 0 | 121 | 0 |
| D | 0 | 121 | 0 |
| Mode SS | |||
|---|---|---|---|
| Quadrant | BADHDUFLAG | Total packets | Discarded packets |
| A | 0 | 1520 | 0 |
| B | 0 | 1520 | 0 |
| C | 0 | 1520 | 0 |
| D | 0 | 1520 | 0 |
| Mode M0 | |||
|---|---|---|---|
| Quadrant | BADHDUFLAG | Total packets | Discarded packets |
| A | 0 | 155590 | 0 |
| B | 0 | 179500 | 0 |
| C | 0 | 340786 | 0 |
| D | 0 | 324655 | 0 |
| Quadrant | Total seconds | Saturated seconds | Saturation percentage |
|---|---|---|---|
| A | 74656 | 767 | 1.027379% |
| B | 74656 | 2093 | 2.803526% |
| C | 74656 | 21258 | 28.474604% |
| D | 74656 | 19525 | 26.153290% |
Noise dominated data is calculated using 1-second bins in cleaned event files. If a bin has >2000 counts, and if more than 50% of those come from <1% of pixels, then it is considered to be noise-dominated and hence unusable.
| Quadrant | # 1 sec bins | Bins with >0 counts | Bins with >2000 counts | High rate bins dominated by noise | Noise dominated (total time) | Noise dominated (detector-on time) | Marked lightcurve |
|---|---|---|---|---|---|---|---|
| A | 89267 | 74658 | 0 | 0 | 0.00% | 0.00% | 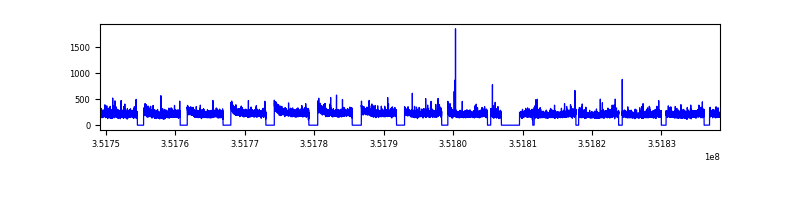 |
| B | 89267 | 74651 | 0 | 0 | 0.00% | 0.00% | 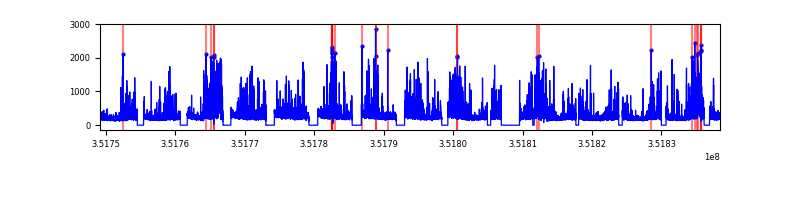 |
| C | 89267 | 74604 | 0 | 0 | 0.00% | 0.00% | 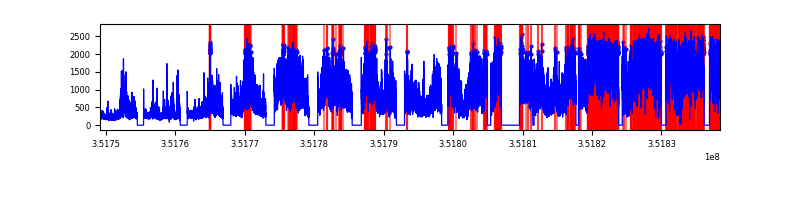 |
| D | 89267 | 74115 | 0 | 0 | 0.00% | 0.00% | 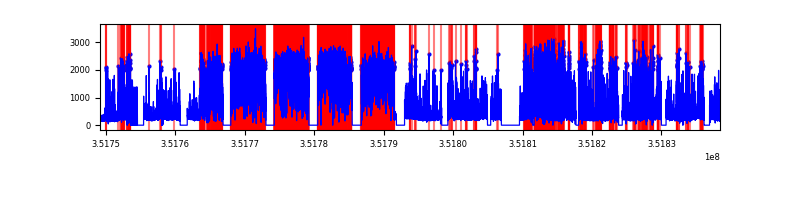 |
Top three noisy pixels from each quadrant. If the there are fewer than three noisy pixels in the level2.evt file, extra rows are filled as -1
| Pixel properties | Quadrant properties | ||||||
|---|---|---|---|---|---|---|---|
| Quadrant | DetID | PixID | Counts | Sigma | Mean | Median | Sigma |
| A | 0 | 29 | 3917 | 9.01 | 1243 | 1170 | 304.8 |
| A | 7 | 110 | 3722 | 8.37 | 1243 | 1170 | 304.8 |
| A | 9 | 19 | 3476 | 7.56 | 1243 | 1170 | 304.8 |
| B | 2 | 9 | 3578 | 10.68 | 1180 | 1132 | 229.1 |
| B | 2 | 8 | 2981 | 8.07 | 1180 | 1132 | 229.1 |
| B | 3 | 17 | 2949 | 7.93 | 1180 | 1132 | 229.1 |
| C | 1 | 81 | 3133 | 7.93 | 1062 | 998 | 269.1 |
| C | 1 | 80 | 3102 | 7.82 | 1062 | 998 | 269.1 |
| C | 12 | 241 | 2808 | 6.73 | 1062 | 998 | 269.1 |
| D | 15 | 46 | 2570 | 6.37 | 990 | 906 | 261.3 |
| D | 6 | 67 | 2472 | 5.99 | 990 | 906 | 261.3 |
| D | 10 | 189 | 2347 | 5.51 | 990 | 906 | 261.3 |
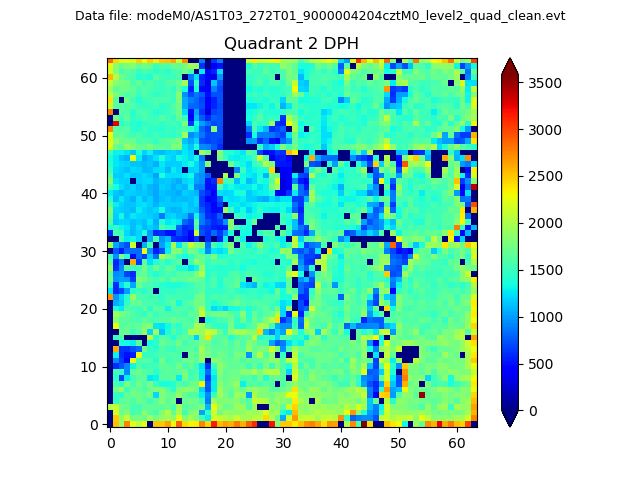
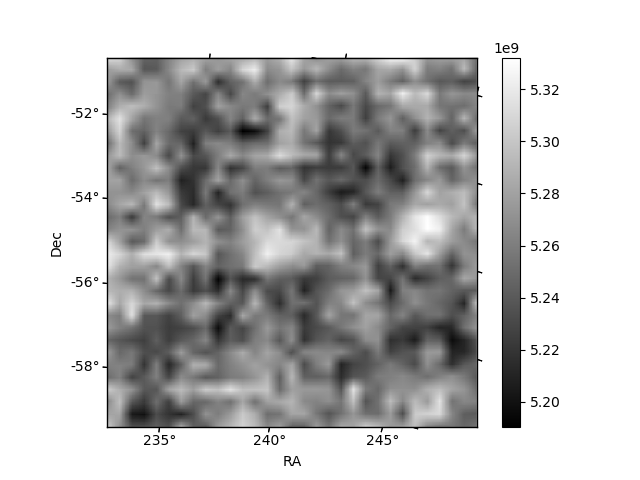
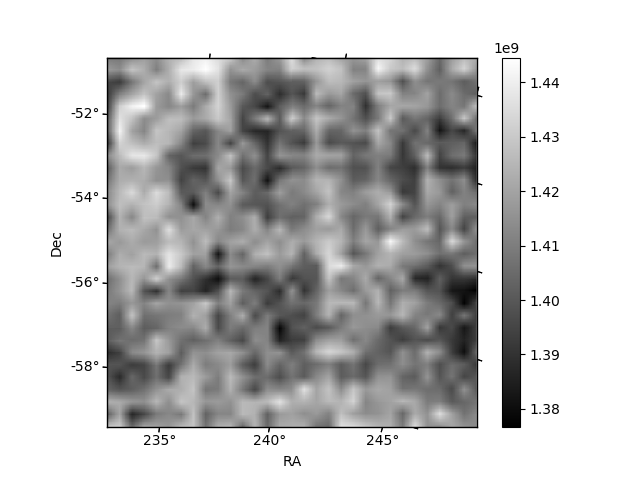
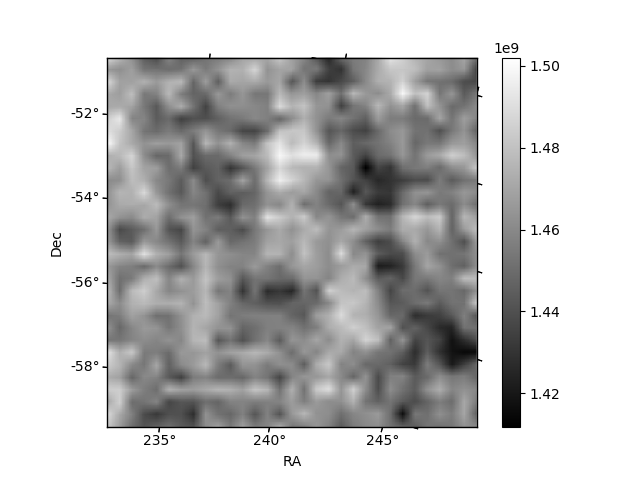
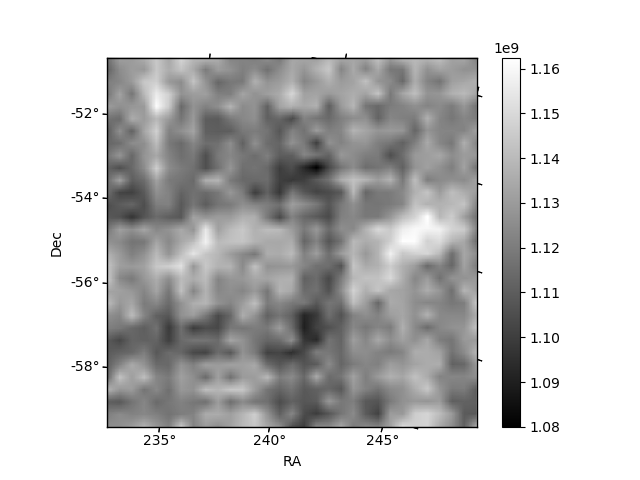
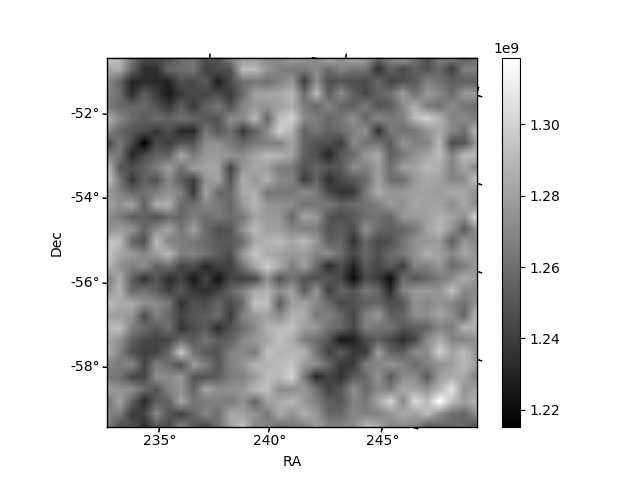
Histogram calculated using DETX and DETY for each event in the final _common_clean file
| Quadrant A | 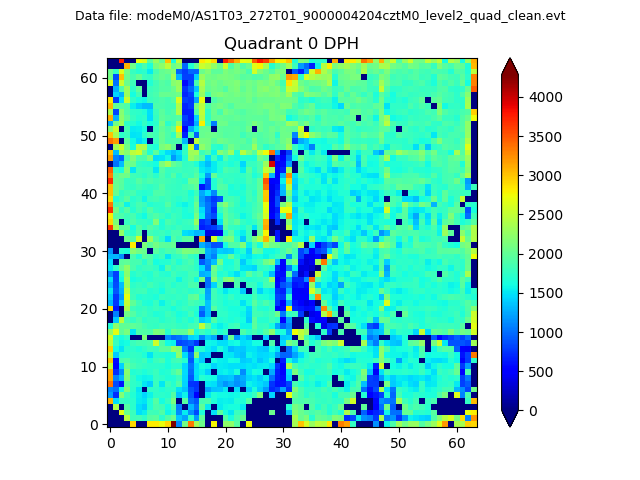 |
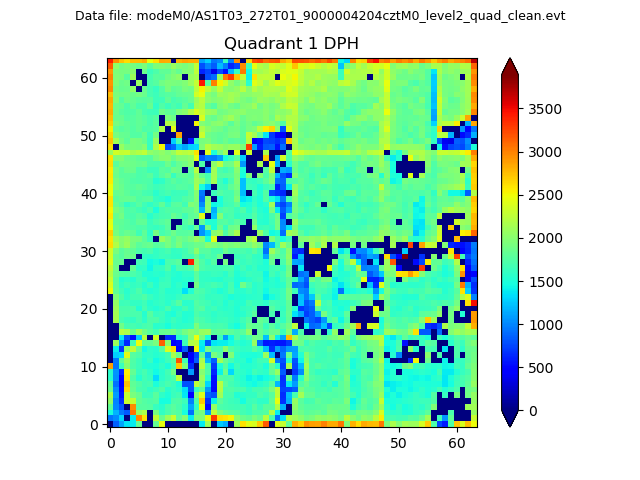 |
Quadrant B |
|---|---|---|---|
| Quadrant D | 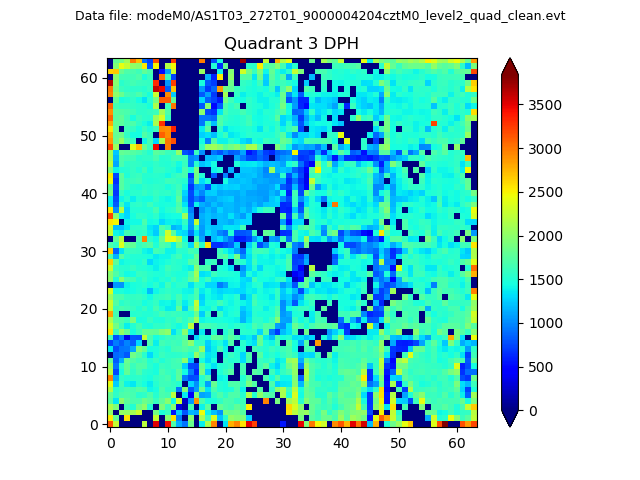 |
 |
Quadrant C |
| Plot type | Count rate plots | Images |
|---|---|---|
| Comparison with Poisson distribution Blue bars denote a histogram of data divided into 1 sec bins. Red curve is a Poisson curve with rate = median count rate of data. |
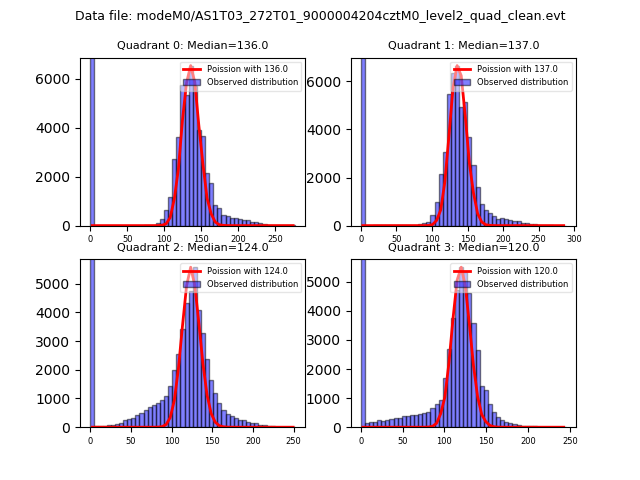 |
 |
| Quadrant-wise count rates Data is divided into 100 sec bins |
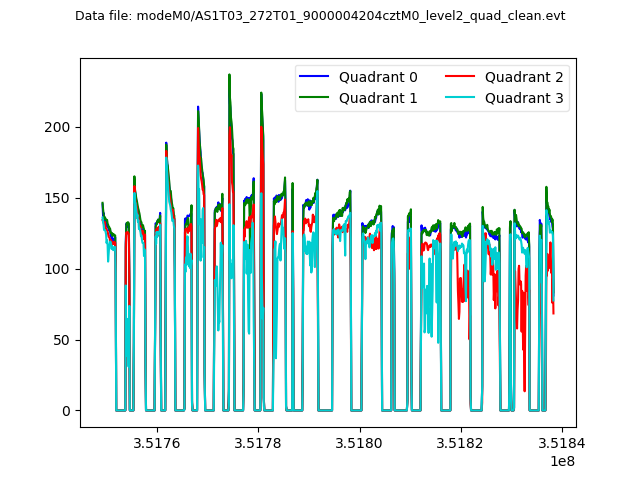 |
|
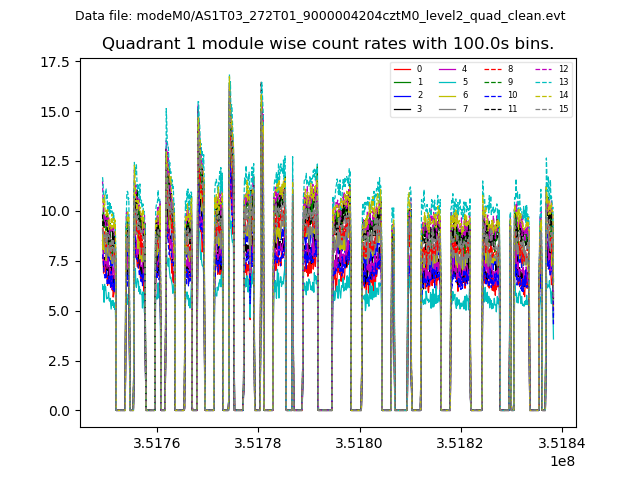
| Module-wise count rates for Quadrant A Data is divided into 100 sec bins |
 |
 |
| Module-wise count rates for Quadrant B Data is divided into 100 sec bins |
 |
 |
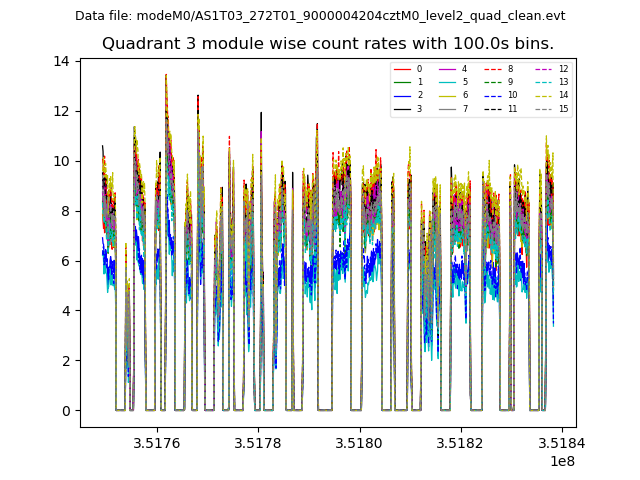
| Module-wise count rates for Quadrant C Data is divided into 100 sec bins |
 |
 |
| Module-wise count rates for Quadrant D Data is divided into 100 sec bins |
 |
 |
| Parameter | Plot |
|---|---|
| CZT HV Monitor | 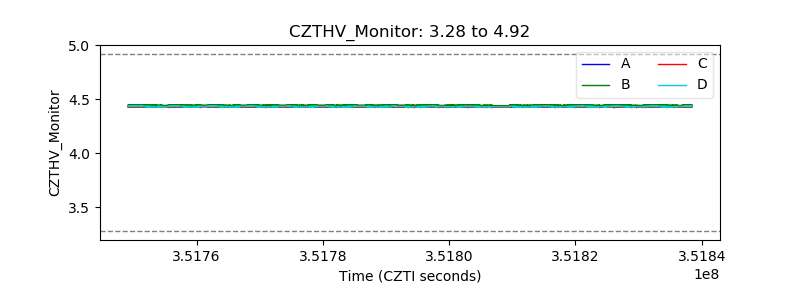 |
| D_VDD | 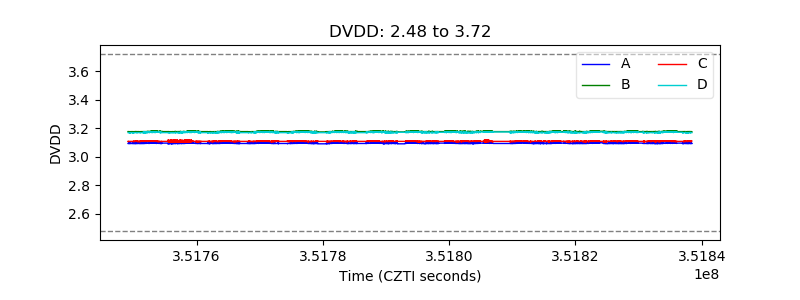 |
| Temperature 1 | 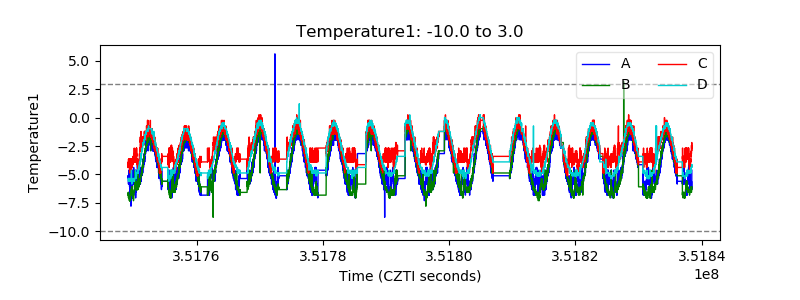 |
| Veto HV Monitor |  |
| Veto LLD | 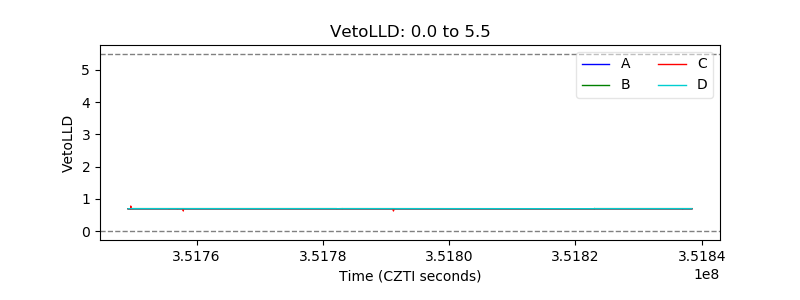 |
| Alpha Counter | 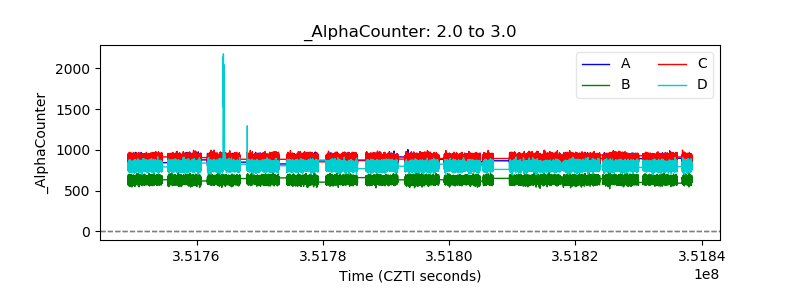 |
| _CPM_Rate | 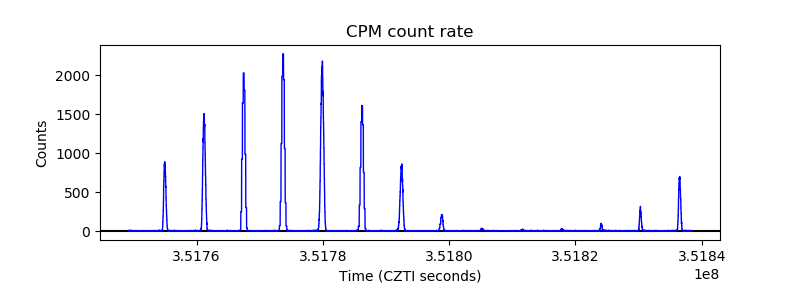 |
| CZT Counter |  |
| +2.5 Volts monitor | 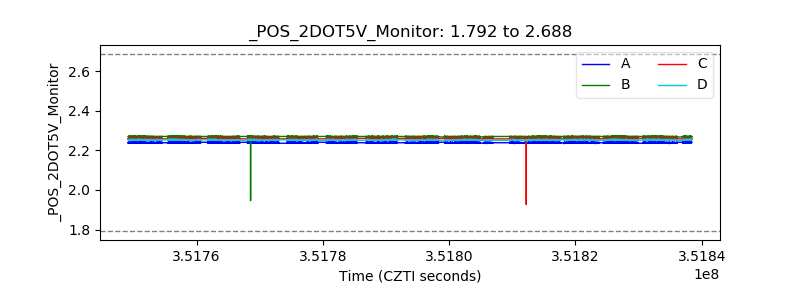 |
| +5 Volts monitor | 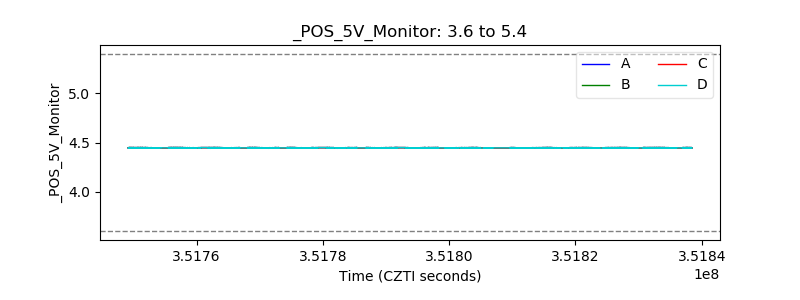 |
| _ROLL_ROT | 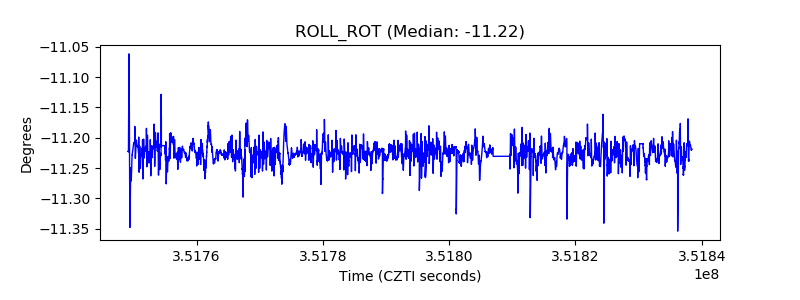 |
| _Roll_DEC | 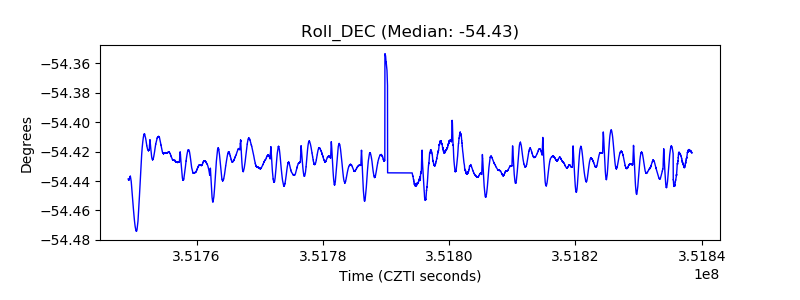 |
| _Roll_RA | 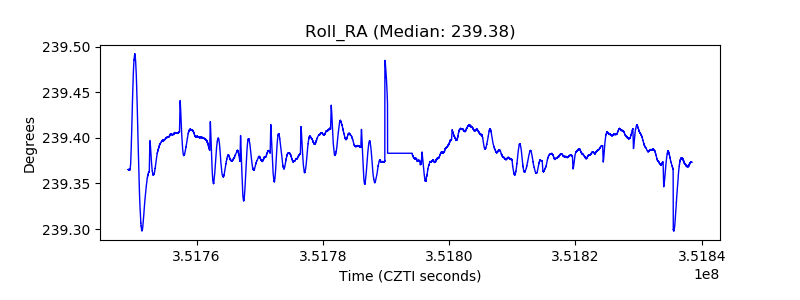 |
| Veto Counter |  |