| Param | Original file | Final file |
|---|---|---|
| Filename | modeM0/AS1T03_272T01_9000004204_29237cztM0_level2.evt | modeM0/AS1T03_272T01_9000004204_29237cztM0_level2_quad_clean.evt |
| Size (bytes) | 1,041,690,240 | 180,610,560 |
| Size | 993.4 MB | 172.2 MB |
| Events in quadrant A | 6,134,991 | 1,182,910 |
| Events in quadrant B | 6,553,614 | 1,198,629 |
| Events in quadrant C | 7,854,727 | 1,143,583 |
| Events in quadrant D | 10,137,710 | 1,058,532 |
| Mode M9 | |||
|---|---|---|---|
| Quadrant | BADHDUFLAG | Total packets | Discarded packets |
| A | 0 | 19 | 0 |
| B | 0 | 19 | 0 |
| C | 0 | 19 | 0 |
| D | 0 | 19 | 0 |
| Mode SS | |||
|---|---|---|---|
| Quadrant | BADHDUFLAG | Total packets | Discarded packets |
| A | 0 | 262 | 0 |
| B | 0 | 262 | 0 |
| C | 0 | 262 | 0 |
| D | 0 | 262 | 0 |
| Mode M0 | |||
|---|---|---|---|
| Quadrant | BADHDUFLAG | Total packets | Discarded packets |
| A | 0 | 26211 | 3 |
| B | 0 | 27599 | 3 |
| C | 0 | 31859 | 3 |
| D | 0 | 38516 | 3 |
| Quadrant | Total seconds | Saturated seconds | Saturation percentage |
|---|---|---|---|
| A | 12819 | 57 | 0.444652% |
| B | 12819 | 101 | 0.787893% |
| C | 12819 | 243 | 1.895624% |
| D | 12819 | 1421 | 11.085108% |
Noise dominated data is calculated using 1-second bins in cleaned event files. If a bin has >2000 counts, and if more than 50% of those come from <1% of pixels, then it is considered to be noise-dominated and hence unusable.
| Quadrant | # 1 sec bins | Bins with >0 counts | Bins with >2000 counts | High rate bins dominated by noise | Noise dominated (total time) | Noise dominated (detector-on time) | Marked lightcurve |
|---|---|---|---|---|---|---|---|
| A | 14739 | 12821 | 0 | 0 | 0.00% | 0.00% | 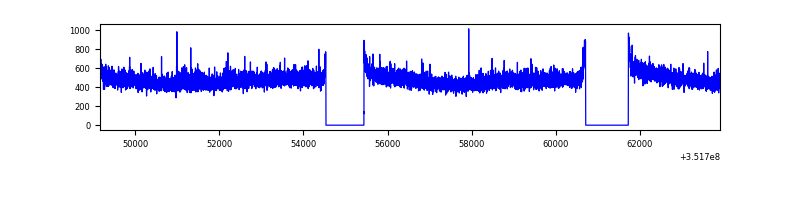 |
| B | 14739 | 12821 | 9 | 9 | 0.06% | 0.07% | 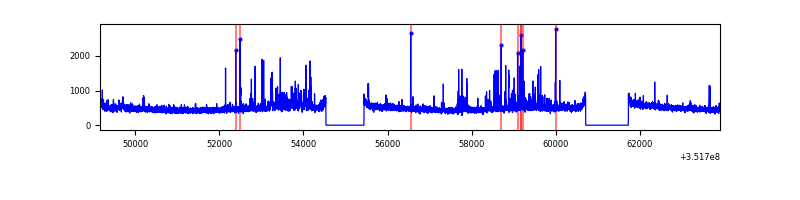 |
| C | 14739 | 12821 | 9 | 9 | 0.06% | 0.07% | 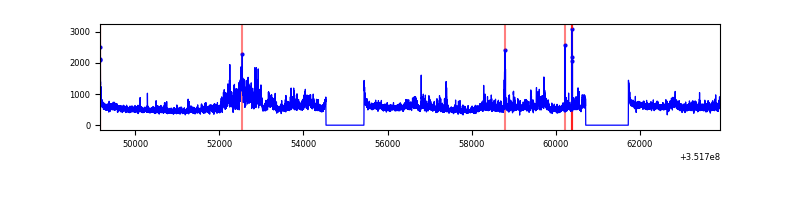 |
| D | 14739 | 12819 | 702 | 702 | 4.76% | 5.48% | 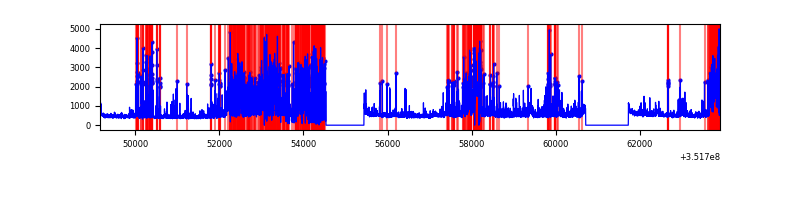 |
Top three noisy pixels from each quadrant. If the there are fewer than three noisy pixels in the level2.evt file, extra rows are filled as -1
| Pixel properties | Quadrant properties | ||||||
|---|---|---|---|---|---|---|---|
| Quadrant | DetID | PixID | Counts | Sigma | Mean | Median | Sigma |
| A | 0 | 13 | 76426 | 240.86 | 1569 | 1535 | 310.9 |
| A | 13 | 254 | 24022 | 72.32 | 1569 | 1535 | 310.9 |
| A | 3 | 137 | 14852 | 42.83 | 1569 | 1535 | 310.9 |
| B | 0 | 229 | 203490 | 686.57 | 1550 | 1509 | 294.2 |
| B | 0 | 183 | 185026 | 623.81 | 1550 | 1509 | 294.2 |
| B | 12 | 111 | 36070 | 117.48 | 1550 | 1509 | 294.2 |
| C | 3 | 233 | 1613230 | 4576.9 | 1513 | 1527 | 352.1 |
| C | 14 | 238 | 245002 | 691.42 | 1513 | 1527 | 352.1 |
| C | 10 | 22 | 54625 | 150.79 | 1513 | 1527 | 352.1 |
| D | 1 | 52 | 3449251 | 10216.21 | 1431 | 1397 | 337.5 |
| D | 8 | 195 | 449958 | 1329.11 | 1431 | 1397 | 337.5 |
| D | 13 | 153 | 380707 | 1123.92 | 1431 | 1397 | 337.5 |
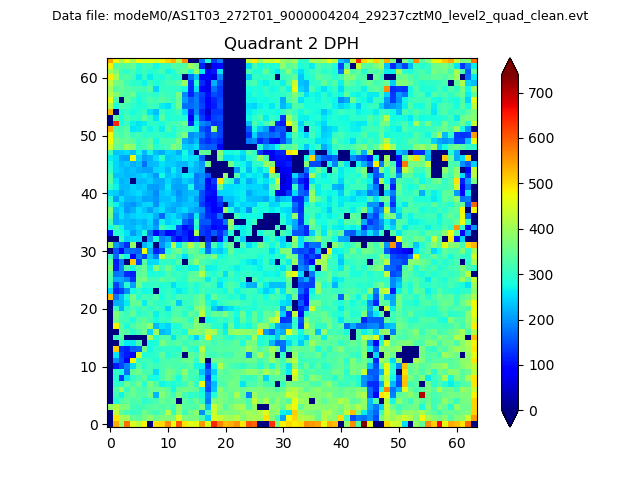
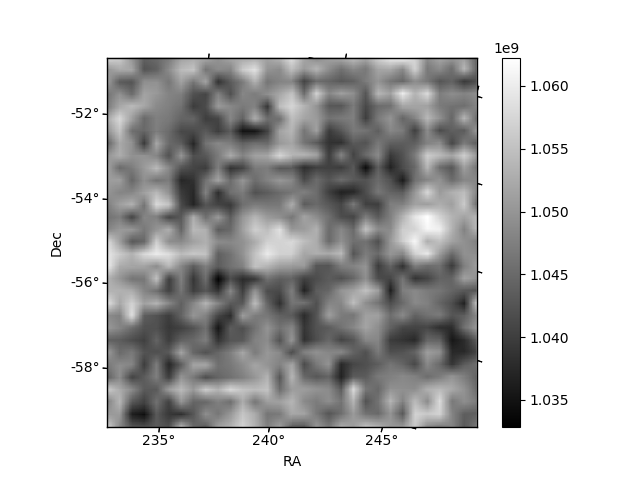
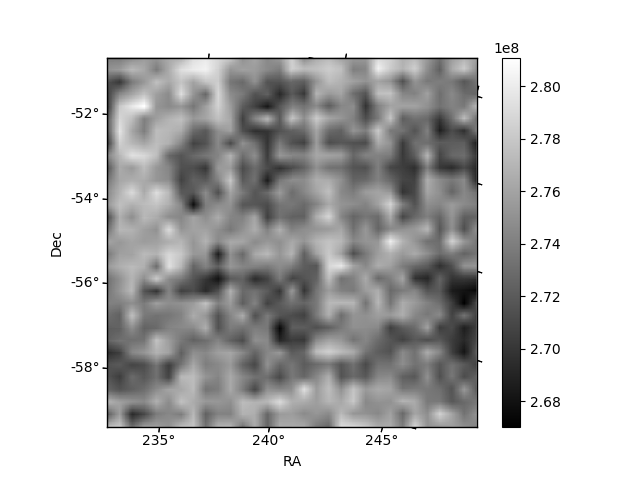
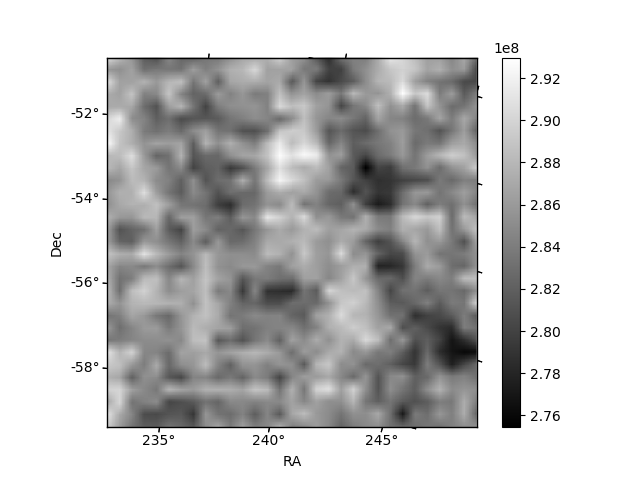
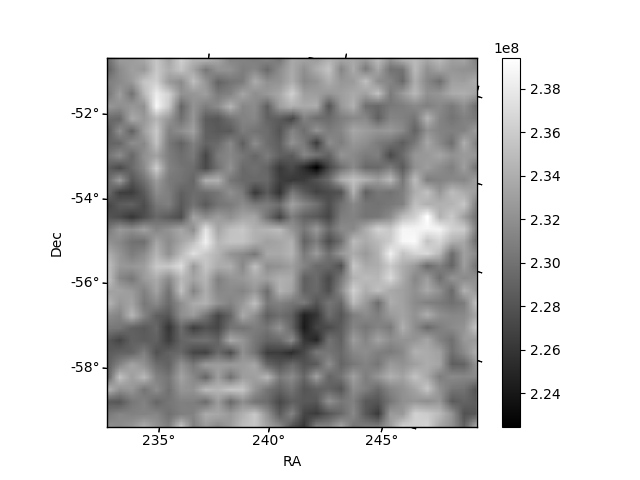
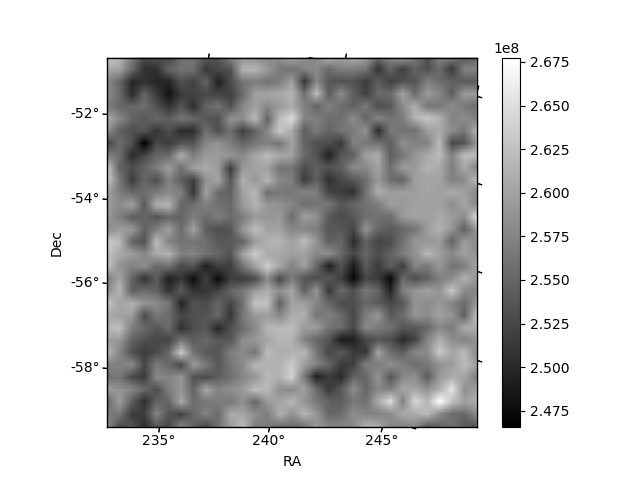
Histogram calculated using DETX and DETY for each event in the final _common_clean file
| Quadrant A | 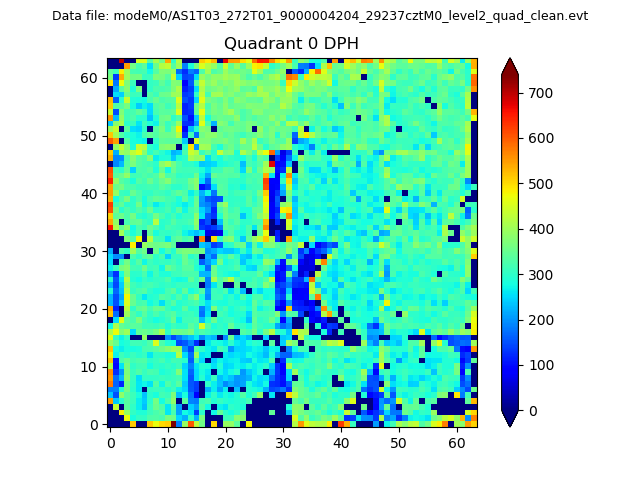 |
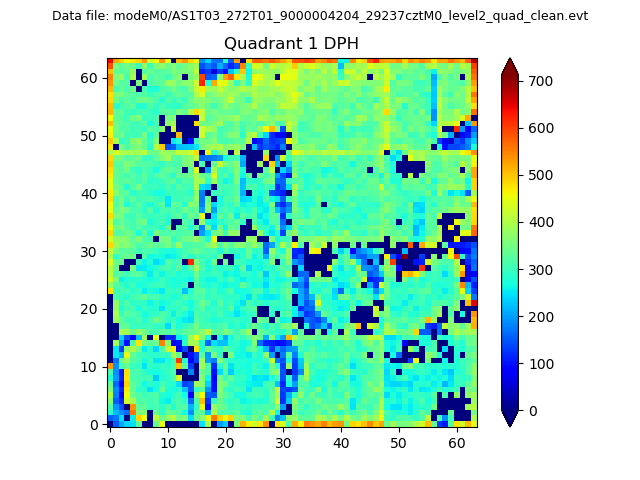 |
Quadrant B |
|---|---|---|---|
| Quadrant D | 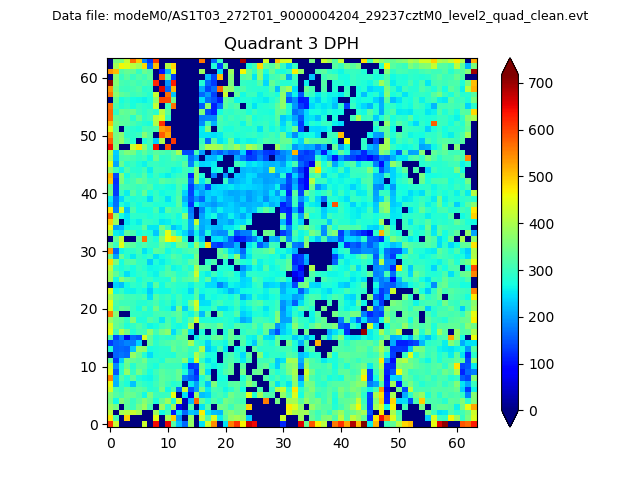 |
 |
Quadrant C |
| Plot type | Count rate plots | Images |
|---|---|---|
| Comparison with Poisson distribution Blue bars denote a histogram of data divided into 1 sec bins. Red curve is a Poisson curve with rate = median count rate of data. |
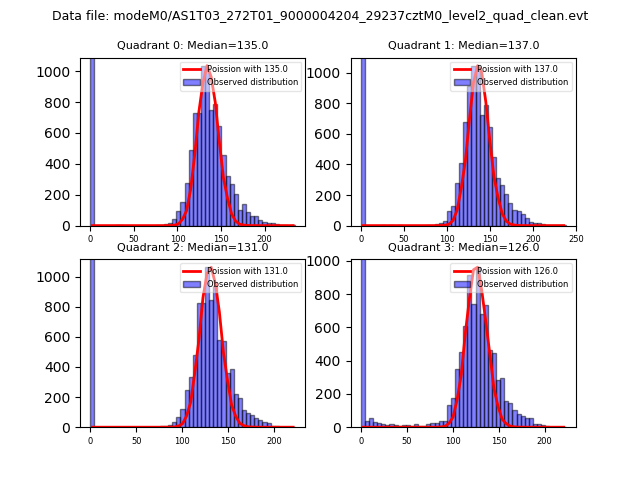 |
 |
| Quadrant-wise count rates Data is divided into 100 sec bins |
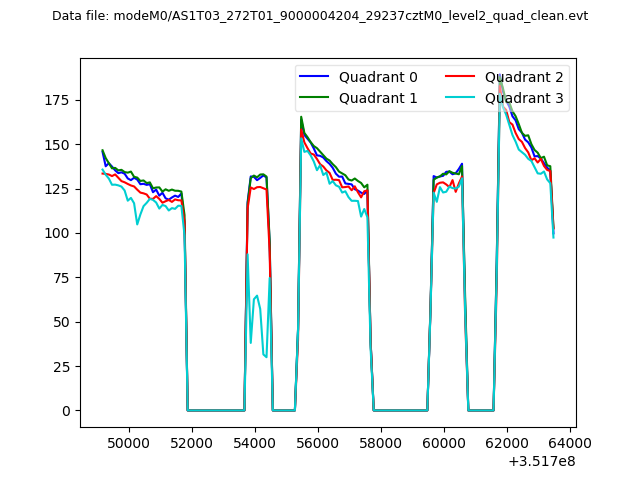 |
|
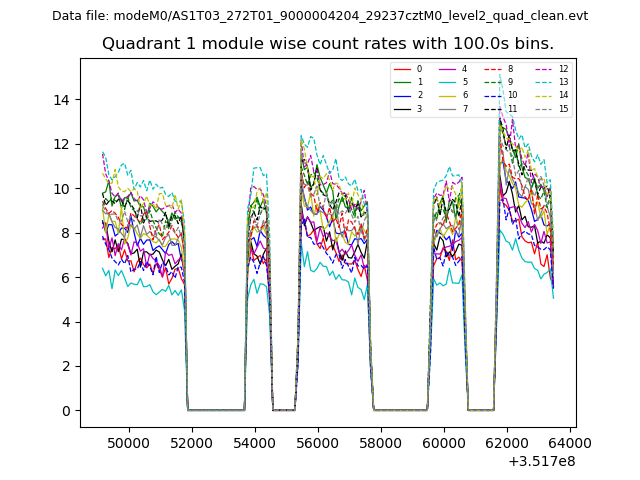
| Module-wise count rates for Quadrant A Data is divided into 100 sec bins |
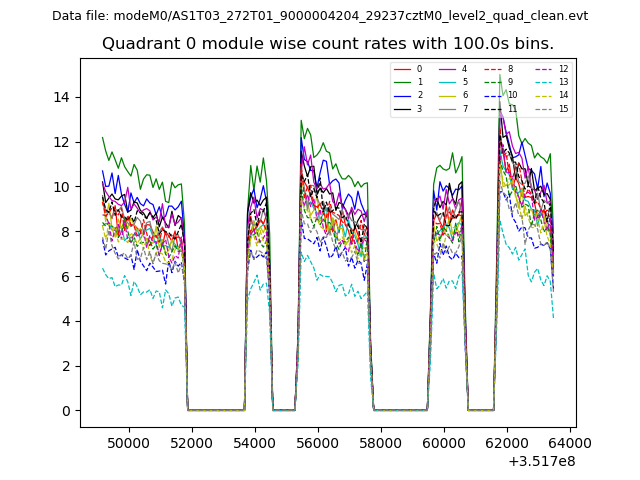 |
 |
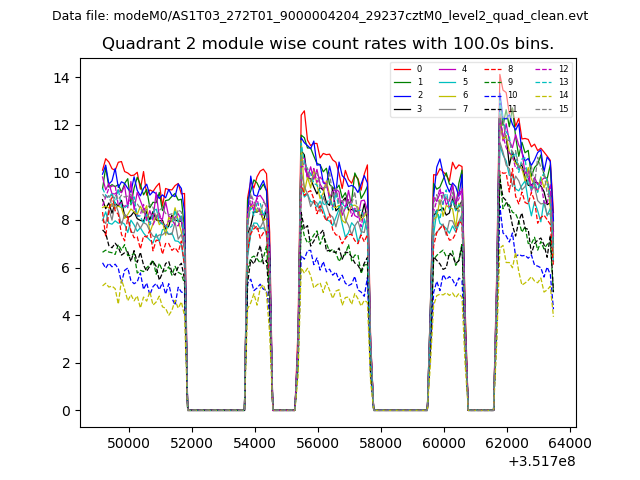
| Module-wise count rates for Quadrant B Data is divided into 100 sec bins |
 |
 |
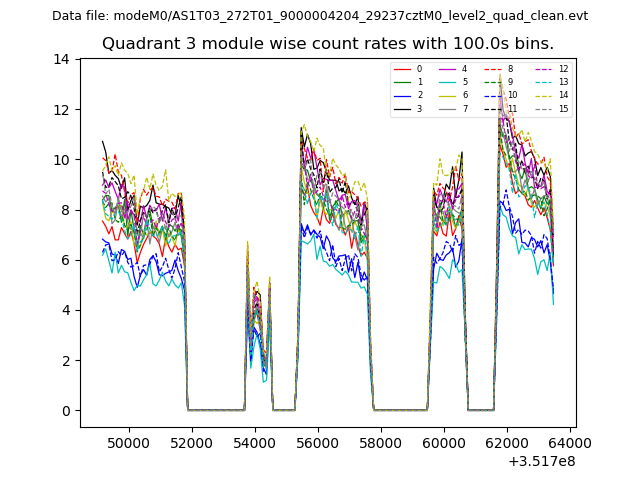
| Module-wise count rates for Quadrant C Data is divided into 100 sec bins |
 |
 |
| Module-wise count rates for Quadrant D Data is divided into 100 sec bins |
 |
 |
| Parameter | Plot |
|---|---|
| CZT HV Monitor | 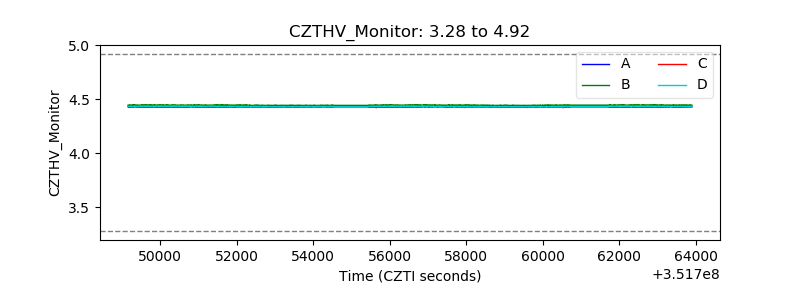 |
| D_VDD | 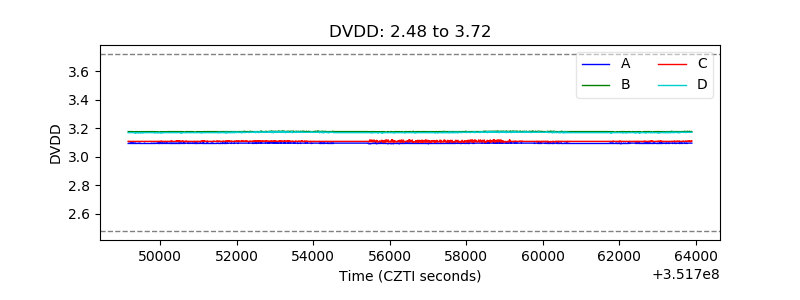 |
| Temperature 1 | 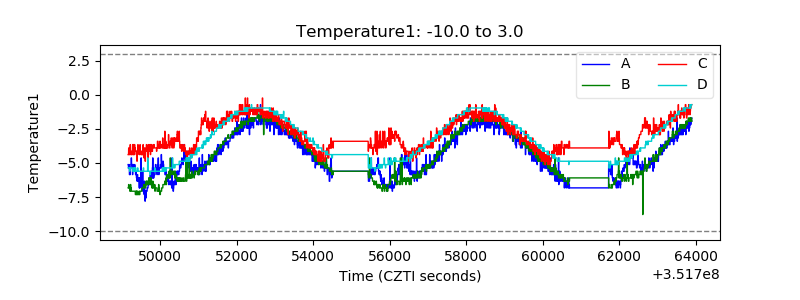 |
| Veto HV Monitor |  |
| Veto LLD | 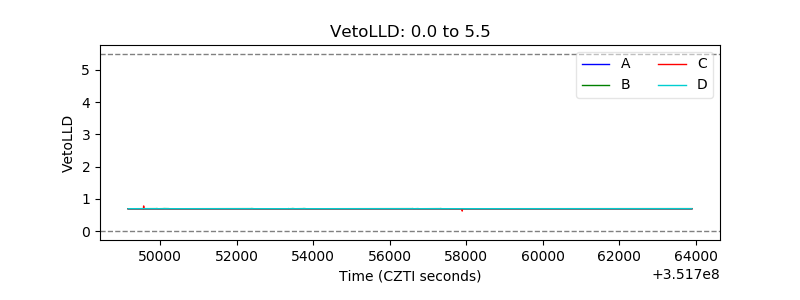 |
| Alpha Counter | 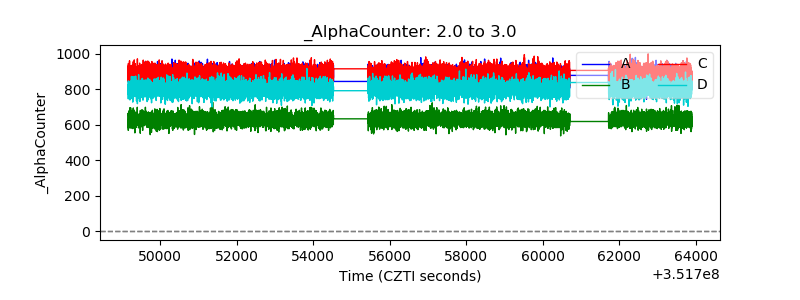 |
| _CPM_Rate | 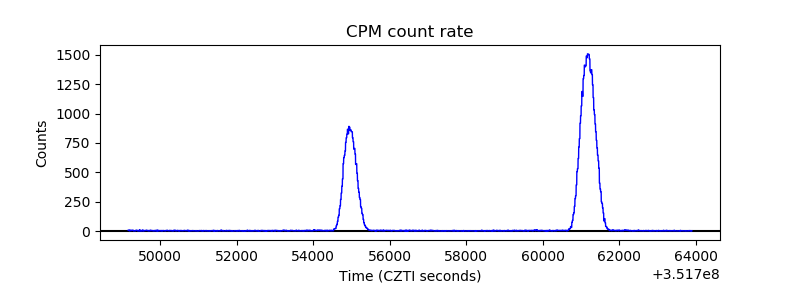 |
| CZT Counter | 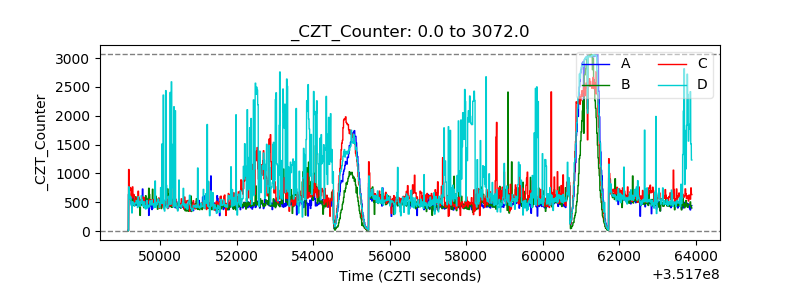 |
| +2.5 Volts monitor | 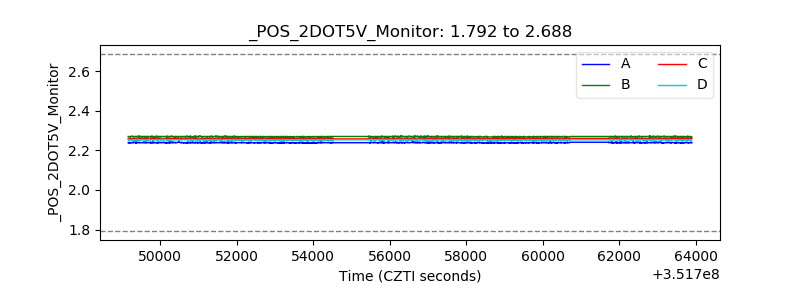 |
| +5 Volts monitor |  |
| _ROLL_ROT | 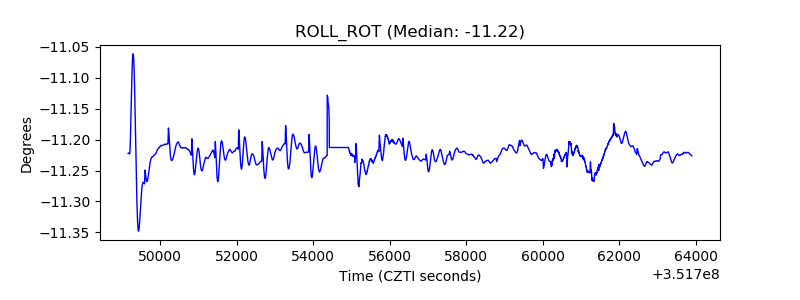 |
| _Roll_DEC | 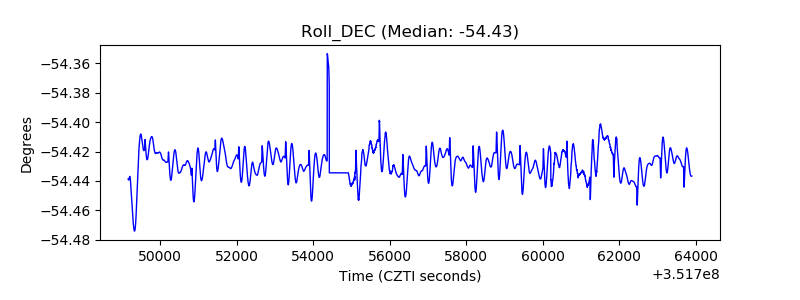 |
| _Roll_RA | 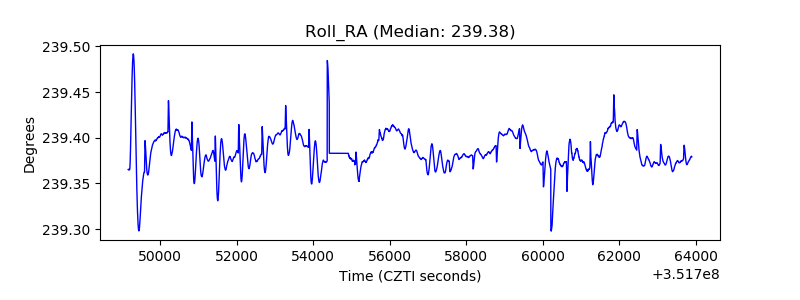 |
| Veto Counter | 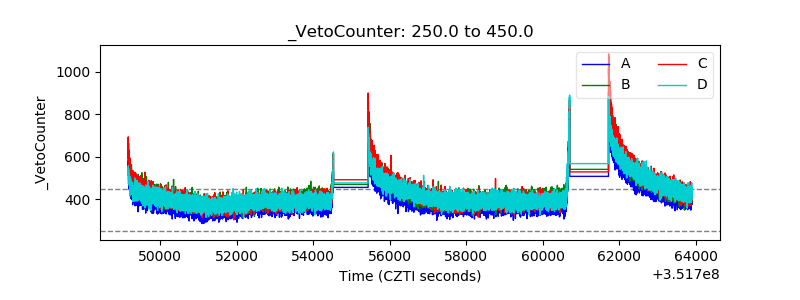 |