| Param | Original file | Final file |
|---|---|---|
| Filename | modeM0/AS1T03_272T01_9000004204_29238cztM0_level2.evt | modeM0/AS1T03_272T01_9000004204_29238cztM0_level2_quad_clean.evt |
| Size (bytes) | 1,428,289,920 | 133,565,760 |
| Size | 1.3 GB | 127.4 MB |
| Events in quadrant A | 5,299,839 | 923,935 |
| Events in quadrant B | 6,961,100 | 919,465 |
| Events in quadrant C | 10,478,166 | 852,536 |
| Events in quadrant D | 19,825,965 | 634,176 |
| Mode M9 | |||
|---|---|---|---|
| Quadrant | BADHDUFLAG | Total packets | Discarded packets |
| A | 0 | 23 | 0 |
| B | 0 | 23 | 0 |
| C | 0 | 23 | 0 |
| D | 0 | 23 | 0 |
| Mode SS | |||
|---|---|---|---|
| Quadrant | BADHDUFLAG | Total packets | Discarded packets |
| A | 0 | 212 | 0 |
| B | 0 | 212 | 0 |
| C | 0 | 212 | 0 |
| D | 0 | 212 | 0 |
| Mode M0 | |||
|---|---|---|---|
| Quadrant | BADHDUFLAG | Total packets | Discarded packets |
| A | 0 | 22241 | 2 |
| B | 0 | 27413 | 2 |
| C | 0 | 38515 | 2 |
| D | 0 | 65928 | 2 |
| Quadrant | Total seconds | Saturated seconds | Saturation percentage |
|---|---|---|---|
| A | 10288 | 141 | 1.370529% |
| B | 10289 | 435 | 4.227816% |
| C | 10289 | 1019 | 9.903781% |
| D | 10288 | 5642 | 54.840591% |
Noise dominated data is calculated using 1-second bins in cleaned event files. If a bin has >2000 counts, and if more than 50% of those come from <1% of pixels, then it is considered to be noise-dominated and hence unusable.
| Quadrant | # 1 sec bins | Bins with >0 counts | Bins with >2000 counts | High rate bins dominated by noise | Noise dominated (total time) | Noise dominated (detector-on time) | Marked lightcurve |
|---|---|---|---|---|---|---|---|
| A | 12633 | 10290 | 0 | 0 | 0.00% | 0.00% | 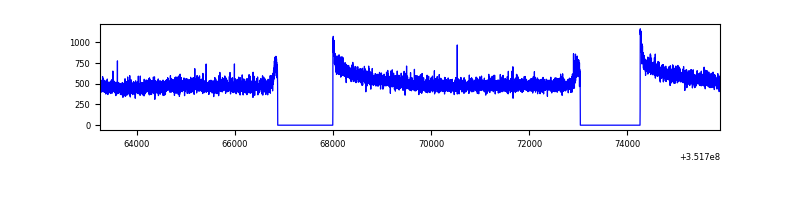 |
| B | 12634 | 10291 | 156 | 156 | 1.23% | 1.52% | 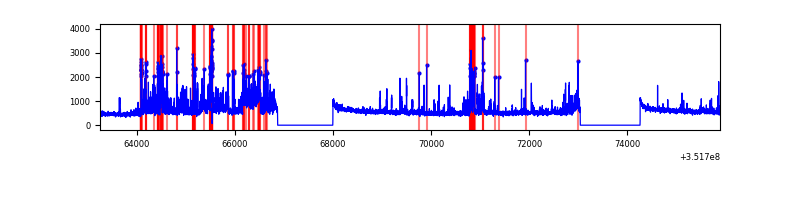 |
| C | 12634 | 10291 | 430 | 430 | 3.40% | 4.18% | 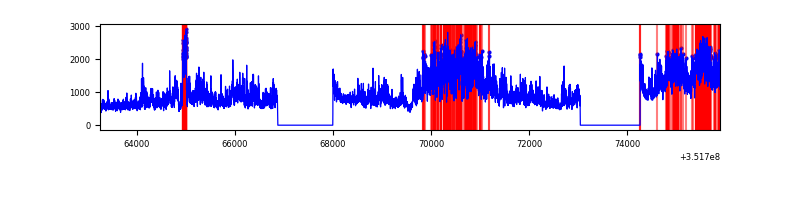 |
| D | 12633 | 10290 | 5144 | 5144 | 40.72% | 49.99% | 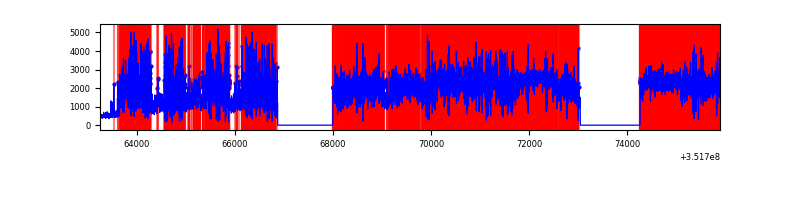 |
Top three noisy pixels from each quadrant. If the there are fewer than three noisy pixels in the level2.evt file, extra rows are filled as -1
| Pixel properties | Quadrant properties | ||||||
|---|---|---|---|---|---|---|---|
| Quadrant | DetID | PixID | Counts | Sigma | Mean | Median | Sigma |
| A | 13 | 254 | 18962 | 65.33 | 1374 | 1349 | 269.6 |
| A | 0 | 226 | 12052 | 39.7 | 1374 | 1349 | 269.6 |
| A | 3 | 137 | 11949 | 39.32 | 1374 | 1349 | 269.6 |
| B | 10 | 245 | 1036543 | 4179.95 | 1336 | 1305 | 247.7 |
| B | 0 | 229 | 401032 | 1613.97 | 1336 | 1305 | 247.7 |
| B | 0 | 183 | 221657 | 889.71 | 1336 | 1305 | 247.7 |
| C | 3 | 233 | 5270273 | 17923.83 | 1278 | 1285 | 294.0 |
| C | 14 | 238 | 205806 | 695.73 | 1278 | 1285 | 294.0 |
| C | 2 | 114 | 24342 | 78.43 | 1278 | 1285 | 294.0 |
| D | 7 | 223 | 10654676 | 42734.72 | 1071 | 1047 | 249.3 |
| D | 1 | 52 | 4173044 | 16735.06 | 1071 | 1047 | 249.3 |
| D | 8 | 195 | 427106 | 1709.04 | 1071 | 1047 | 249.3 |
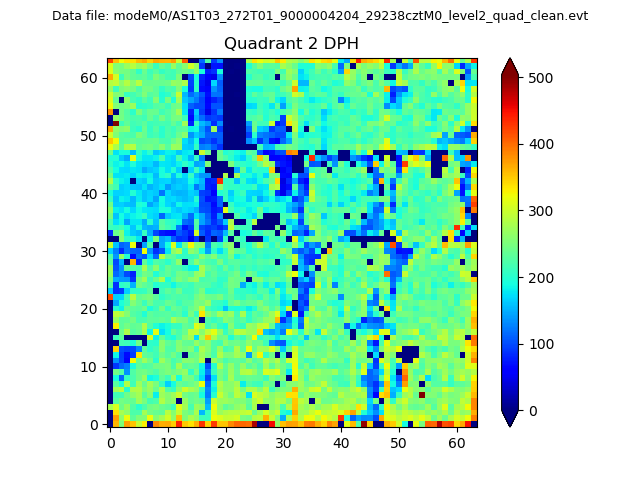
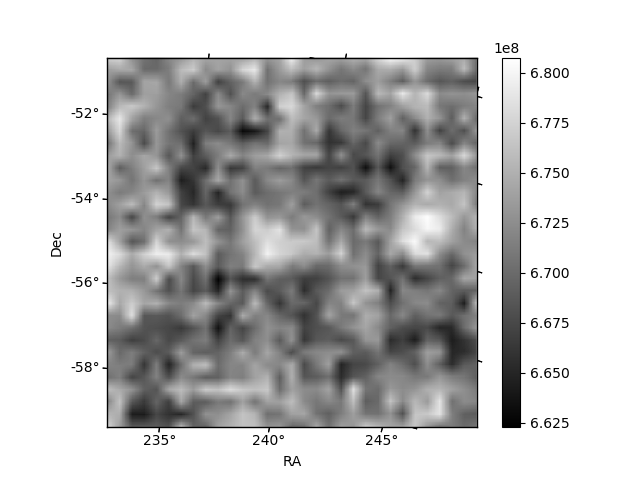
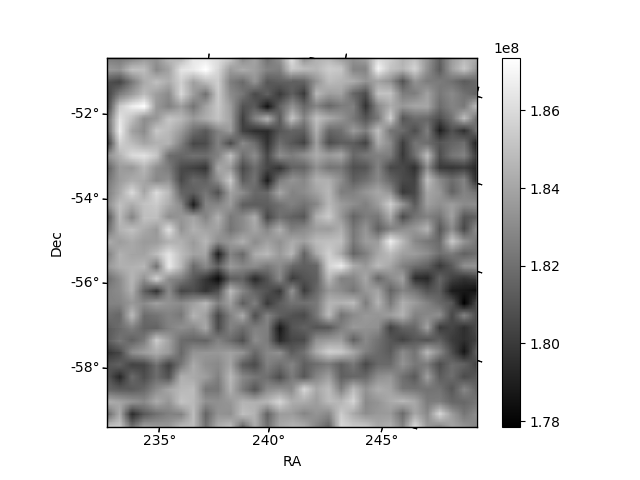
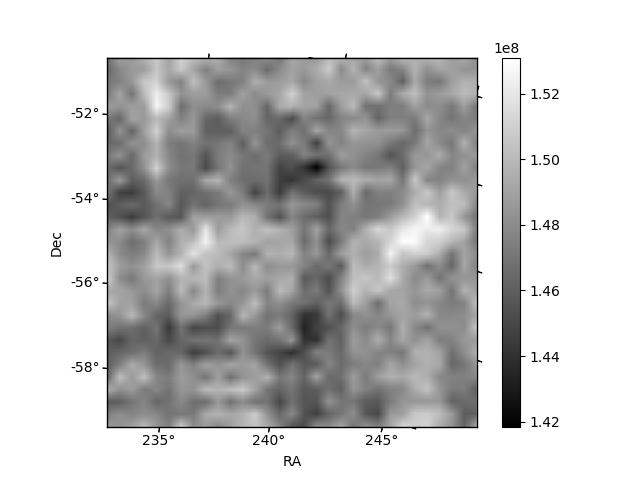
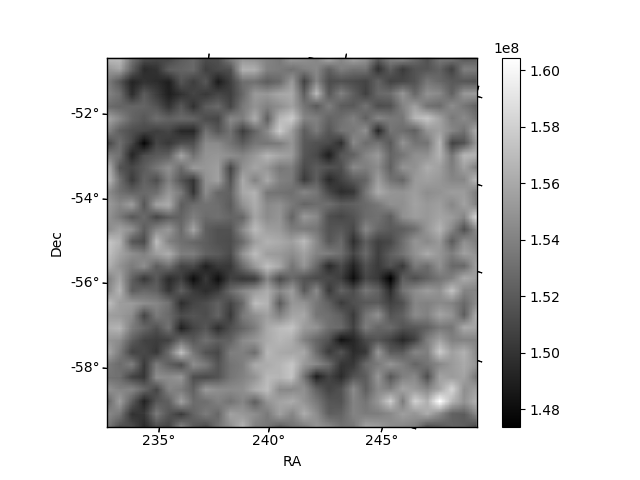
Histogram calculated using DETX and DETY for each event in the final _common_clean file
| Quadrant A | 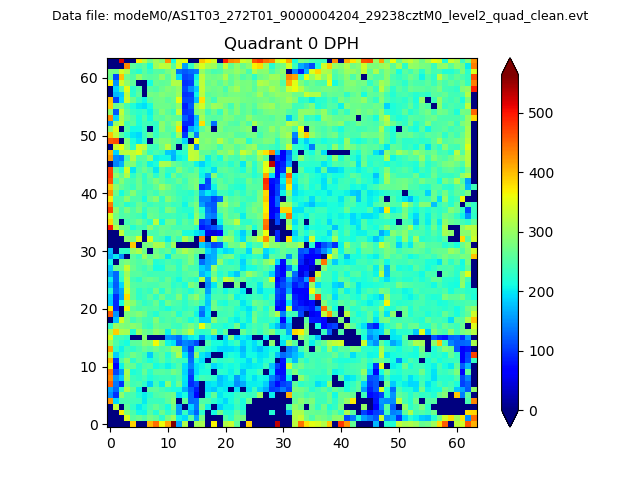 |
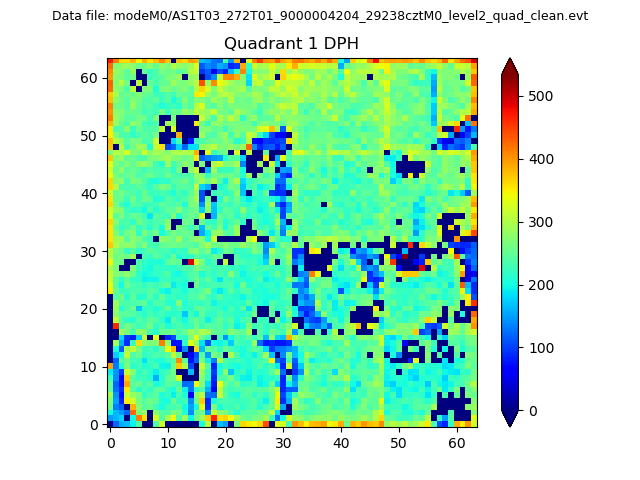 |
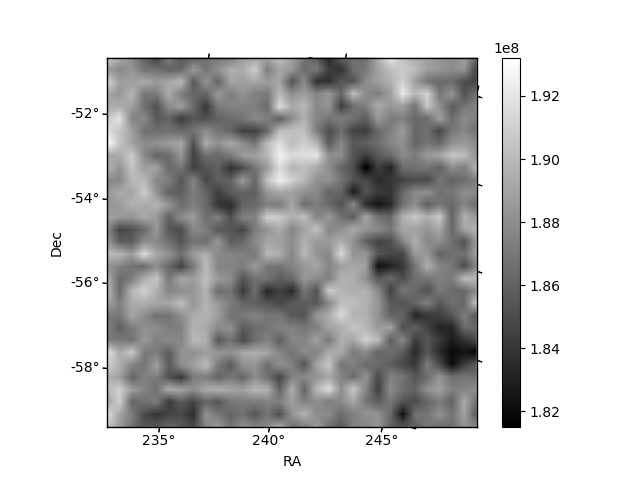
Quadrant B |
|---|---|---|---|
| Quadrant D | 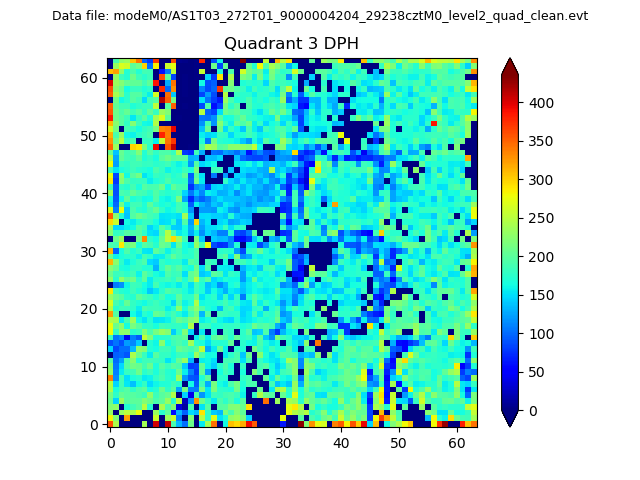 |
 |
Quadrant C |
| Plot type | Count rate plots | Images |
|---|---|---|
| Comparison with Poisson distribution Blue bars denote a histogram of data divided into 1 sec bins. Red curve is a Poisson curve with rate = median count rate of data. |
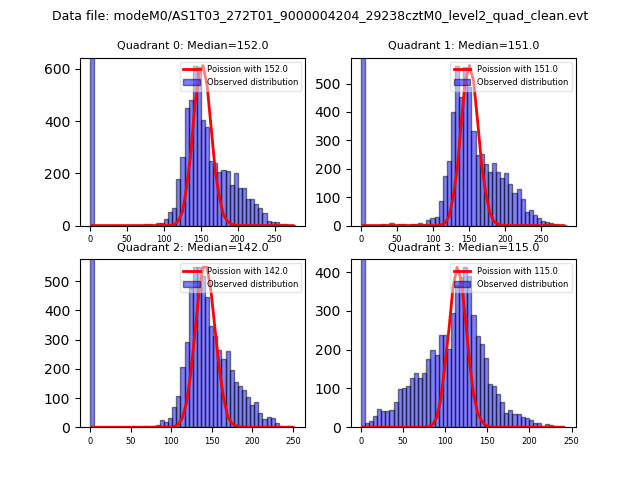 |
 |
| Quadrant-wise count rates Data is divided into 100 sec bins |
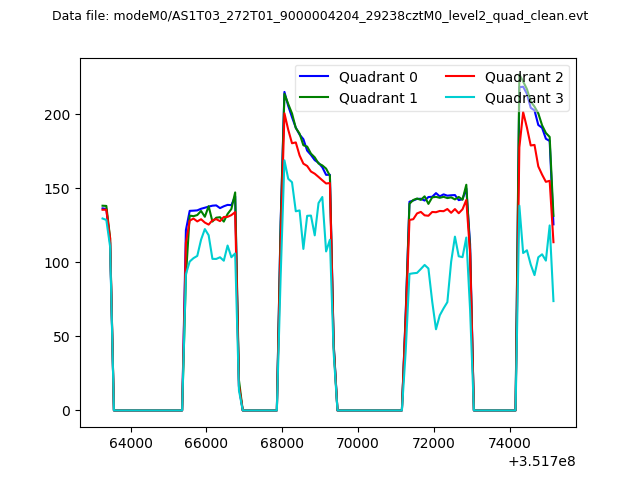 |
|
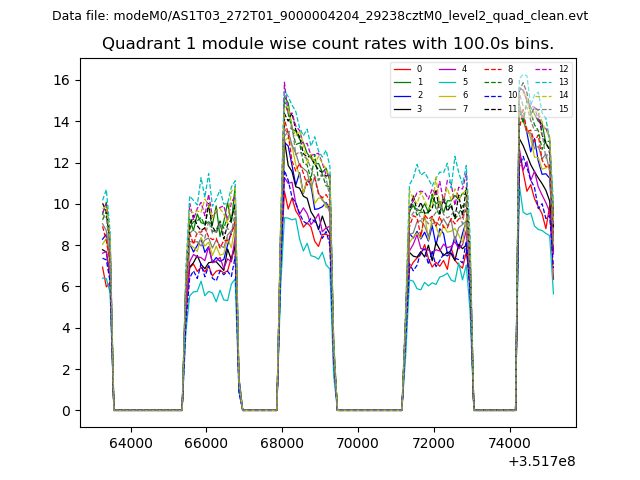
| Module-wise count rates for Quadrant A Data is divided into 100 sec bins |
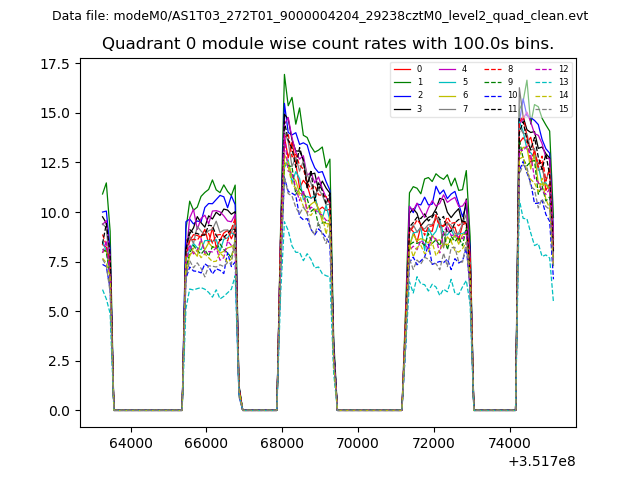 |
 |
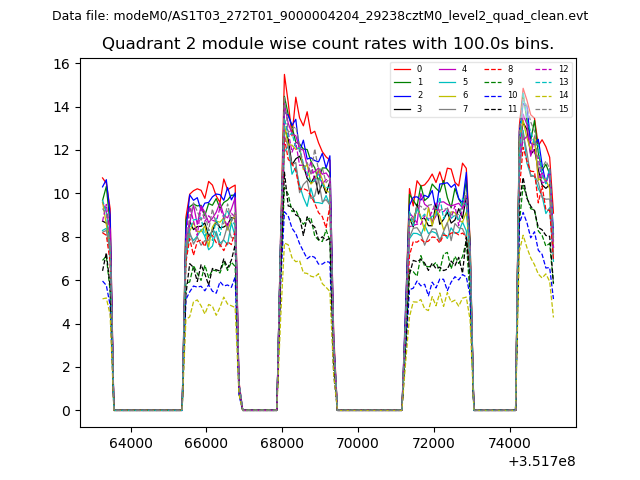
| Module-wise count rates for Quadrant B Data is divided into 100 sec bins |
 |
 |
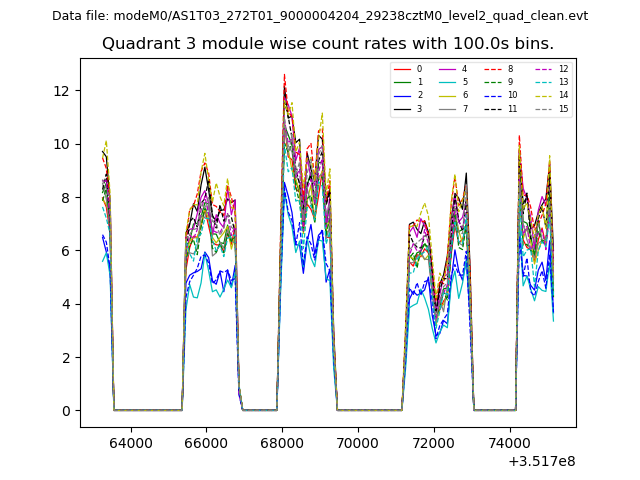
| Module-wise count rates for Quadrant C Data is divided into 100 sec bins |
 |
 |
| Module-wise count rates for Quadrant D Data is divided into 100 sec bins |
 |
 |
| Parameter | Plot |
|---|---|
| CZT HV Monitor | 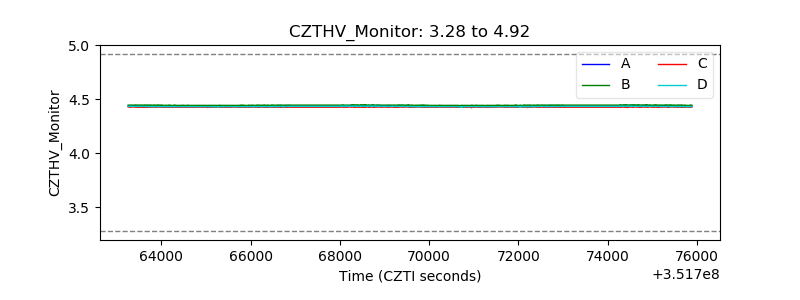 |
| D_VDD | 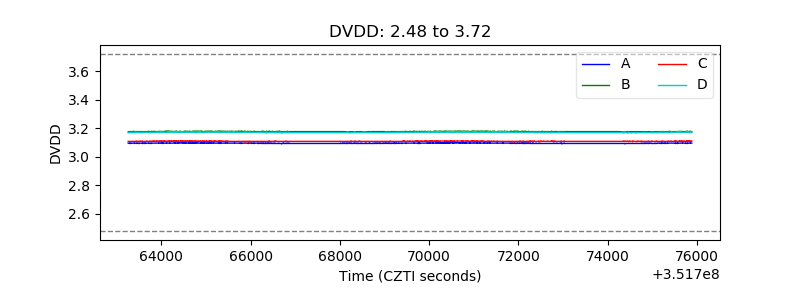 |
| Temperature 1 | 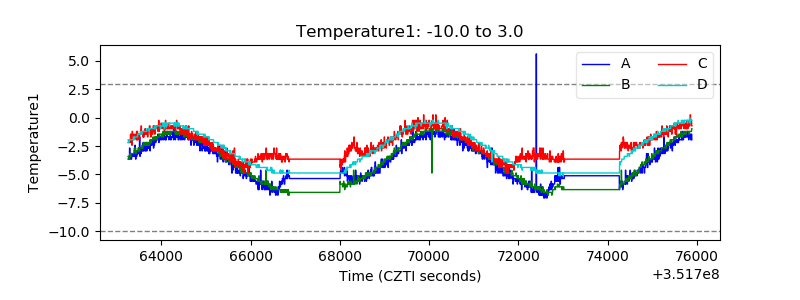 |
| Veto HV Monitor | 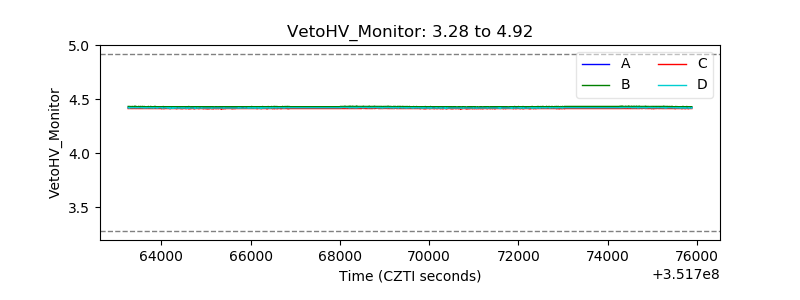 |
| Veto LLD | 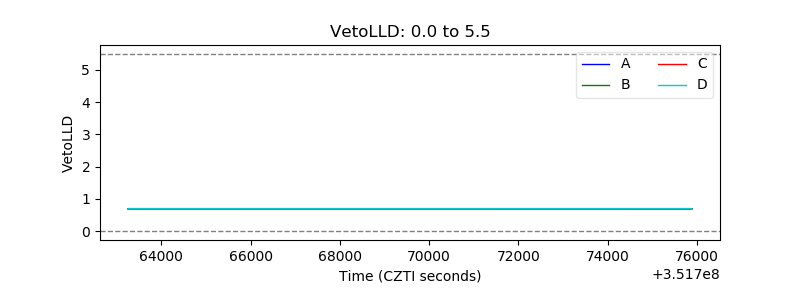 |
| Alpha Counter | 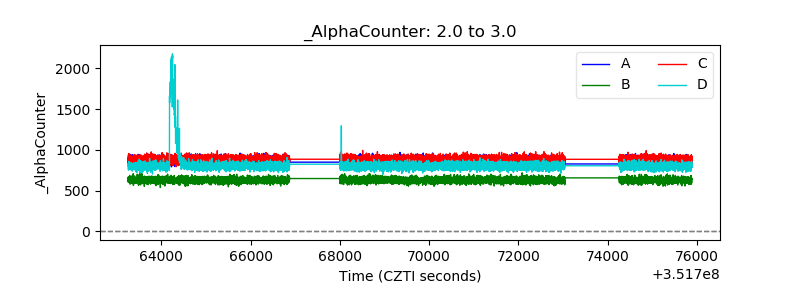 |
| _CPM_Rate | 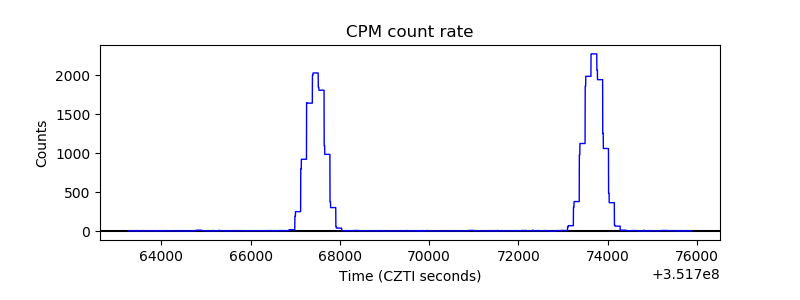 |
| CZT Counter | 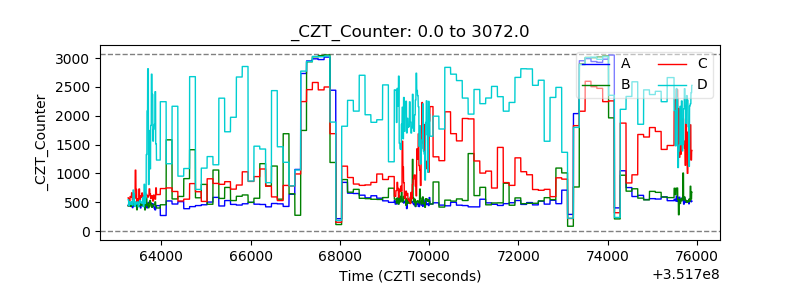 |
| +2.5 Volts monitor |  |
| +5 Volts monitor |  |
| _ROLL_ROT | 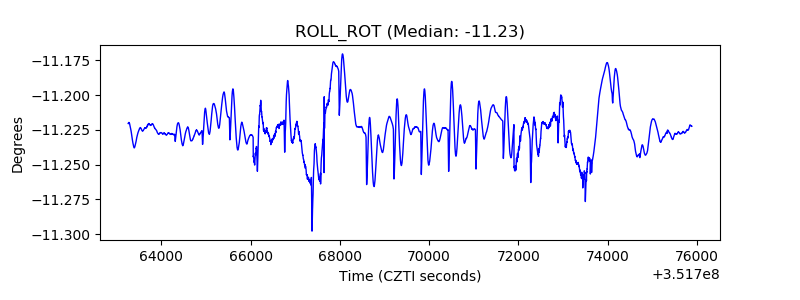 |
| _Roll_DEC | 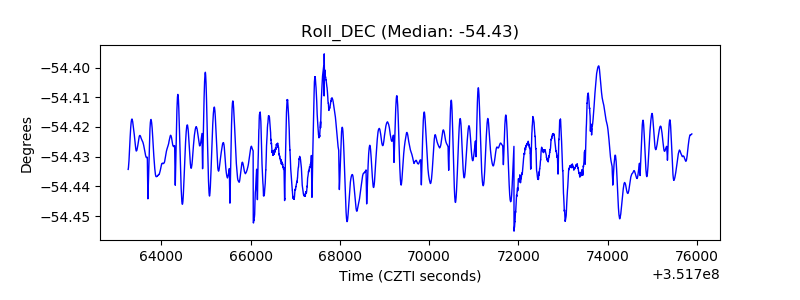 |
| _Roll_RA | 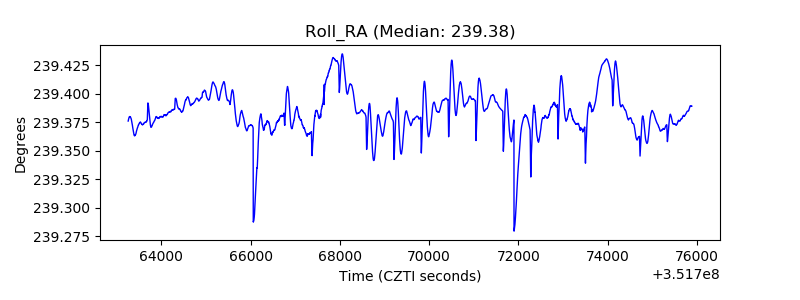 |
| Veto Counter | 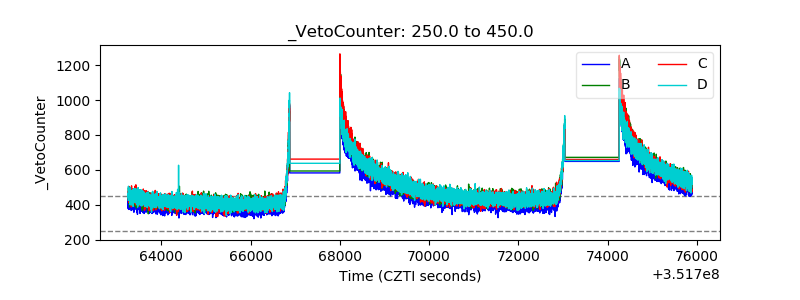 |