| Param | Original file | Final file |
|---|---|---|
| Filename | modeM0/AS1T03_272T01_9000004204_29239cztM0_level2.evt | modeM0/AS1T03_272T01_9000004204_29239cztM0_level2_quad_clean.evt |
| Size (bytes) | 950,034,240 | 68,774,400 |
| Size | 906.0 MB | 65.6 MB |
| Events in quadrant A | 3,162,103 | 477,742 |
| Events in quadrant B | 3,664,454 | 471,856 |
| Events in quadrant C | 8,408,953 | 422,842 |
| Events in quadrant D | 13,142,101 | 298,654 |
| Mode M9 | |||
|---|---|---|---|
| Quadrant | BADHDUFLAG | Total packets | Discarded packets |
| A | 0 | 13 | 0 |
| B | 0 | 13 | 0 |
| C | 0 | 13 | 0 |
| D | 0 | 13 | 0 |
| Mode SS | |||
|---|---|---|---|
| Quadrant | BADHDUFLAG | Total packets | Discarded packets |
| A | 0 | 120 | 0 |
| B | 0 | 120 | 0 |
| C | 0 | 120 | 0 |
| D | 0 | 120 | 0 |
| Mode M0 | |||
|---|---|---|---|
| Quadrant | BADHDUFLAG | Total packets | Discarded packets |
| A | 0 | 12918 | 1 |
| B | 0 | 14552 | 1 |
| C | 0 | 29061 | 1 |
| D | 0 | 43030 | 1 |
| Quadrant | Total seconds | Saturated seconds | Saturation percentage |
|---|---|---|---|
| A | 5865 | 88 | 1.500426% |
| B | 5866 | 230 | 3.920900% |
| C | 5866 | 1209 | 20.610297% |
| D | 5866 | 4385 | 74.752813% |
Noise dominated data is calculated using 1-second bins in cleaned event files. If a bin has >2000 counts, and if more than 50% of those come from <1% of pixels, then it is considered to be noise-dominated and hence unusable.
| Quadrant | # 1 sec bins | Bins with >0 counts | Bins with >2000 counts | High rate bins dominated by noise | Noise dominated (total time) | Noise dominated (detector-on time) | Marked lightcurve |
|---|---|---|---|---|---|---|---|
| A | 7145 | 5866 | 0 | 0 | 0.00% | 0.00% | 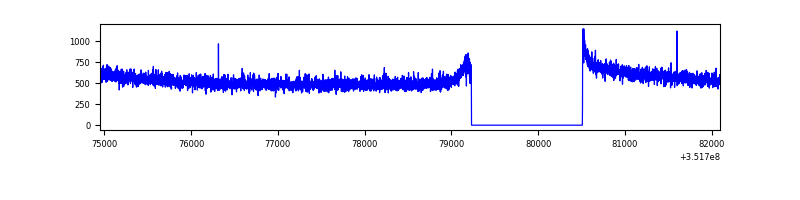 |
| B | 7146 | 5867 | 93 | 93 | 1.30% | 1.59% | 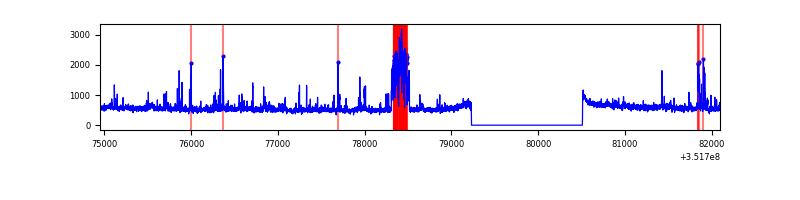 |
| C | 7146 | 5867 | 615 | 615 | 8.61% | 10.48% | 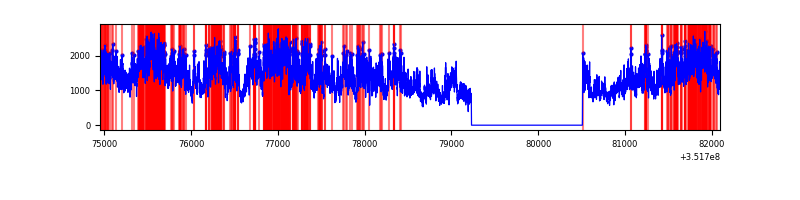 |
| D | 7146 | 5867 | 4195 | 4195 | 58.70% | 71.50% | 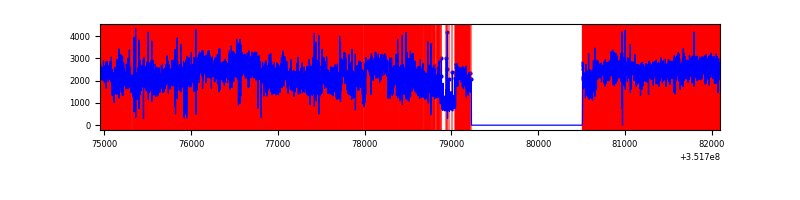 |
Top three noisy pixels from each quadrant. If the there are fewer than three noisy pixels in the level2.evt file, extra rows are filled as -1
| Pixel properties | Quadrant properties | ||||||
|---|---|---|---|---|---|---|---|
| Quadrant | DetID | PixID | Counts | Sigma | Mean | Median | Sigma |
| A | 13 | 254 | 11554 | 67.23 | 818 | 805 | 159.9 |
| A | 0 | 226 | 7112 | 39.45 | 818 | 805 | 159.9 |
| A | 3 | 137 | 6986 | 38.66 | 818 | 805 | 159.9 |
| B | 0 | 183 | 319356 | 2158.33 | 796 | 781 | 147.6 |
| B | 0 | 229 | 164886 | 1111.8 | 796 | 781 | 147.6 |
| B | 0 | 189 | 32480 | 214.76 | 796 | 781 | 147.6 |
| C | 3 | 233 | 5398720 | 32147.79 | 738 | 743 | 167.9 |
| C | 14 | 238 | 120017 | 710.34 | 738 | 743 | 167.9 |
| C | 2 | 114 | 13612 | 76.64 | 738 | 743 | 167.9 |
| D | 7 | 223 | 9633296 | 74901.61 | 546 | 532 | 128.6 |
| D | 1 | 52 | 992930 | 7716.6 | 546 | 532 | 128.6 |
| D | 8 | 195 | 195009 | 1512.2 | 546 | 532 | 128.6 |
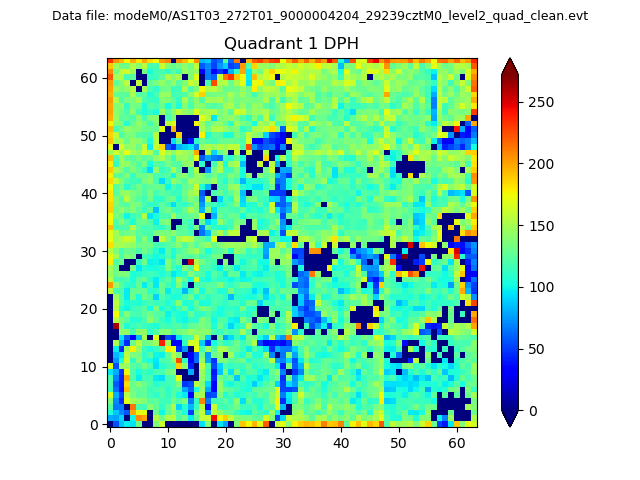
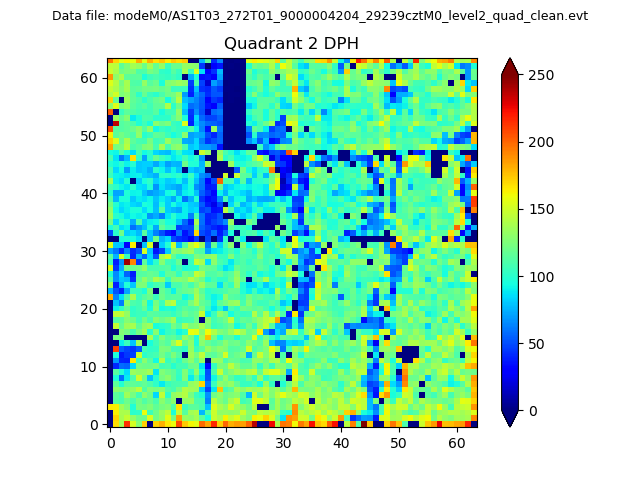
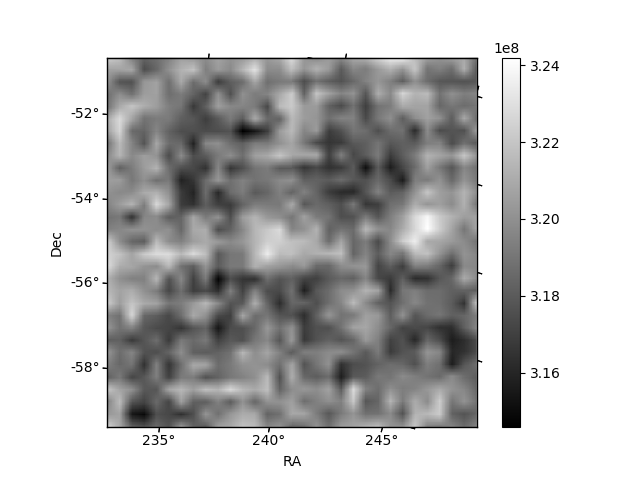
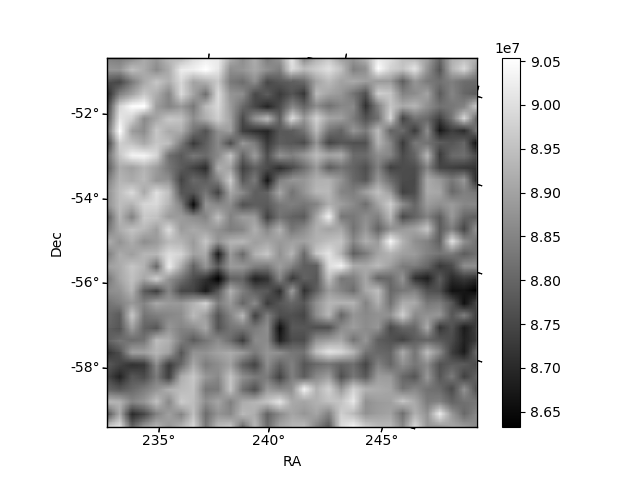
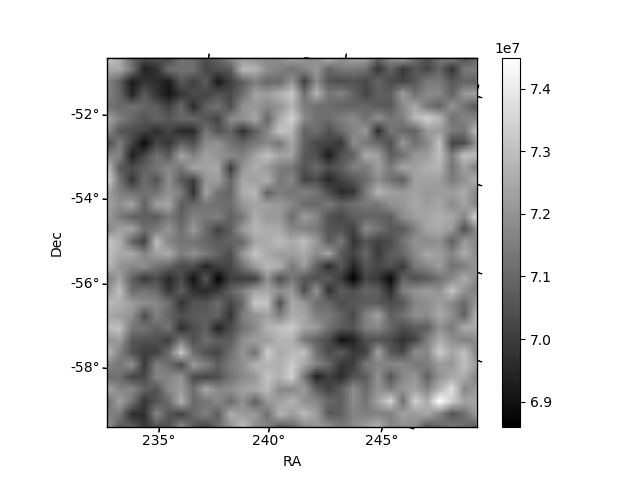
Histogram calculated using DETX and DETY for each event in the final _common_clean file
| Quadrant A |  |
 |
Quadrant B |
|---|---|---|---|
| Quadrant D | 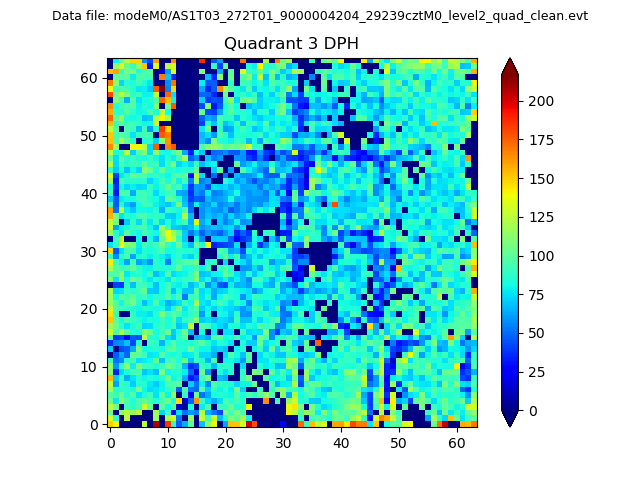 |
 |
Quadrant C |
| Plot type | Count rate plots | Images |
|---|---|---|
| Comparison with Poisson distribution Blue bars denote a histogram of data divided into 1 sec bins. Red curve is a Poisson curve with rate = median count rate of data. |
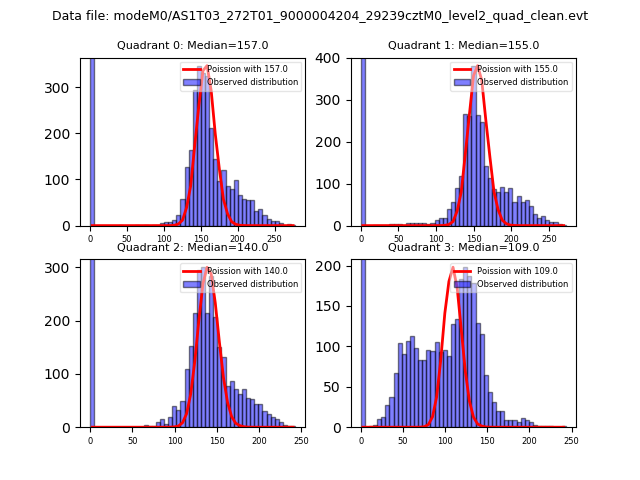 |
 |
| Quadrant-wise count rates Data is divided into 100 sec bins |
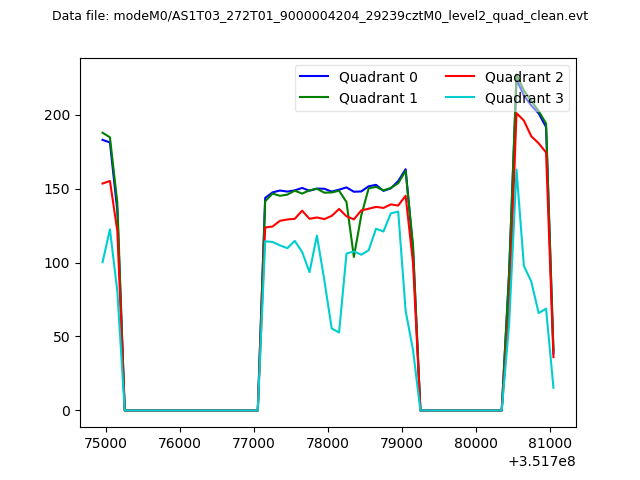 |
|
| Module-wise count rates for Quadrant A Data is divided into 100 sec bins |
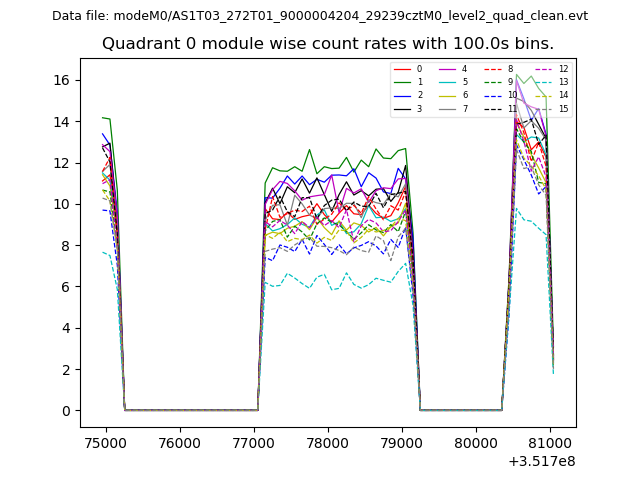 |
 |
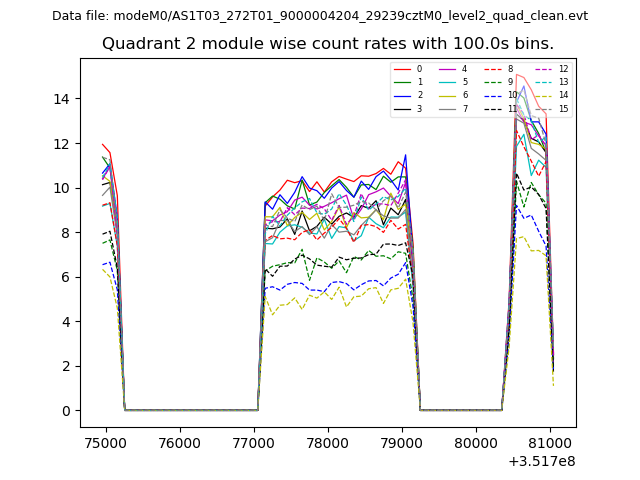
| Module-wise count rates for Quadrant B Data is divided into 100 sec bins |
 |
 |
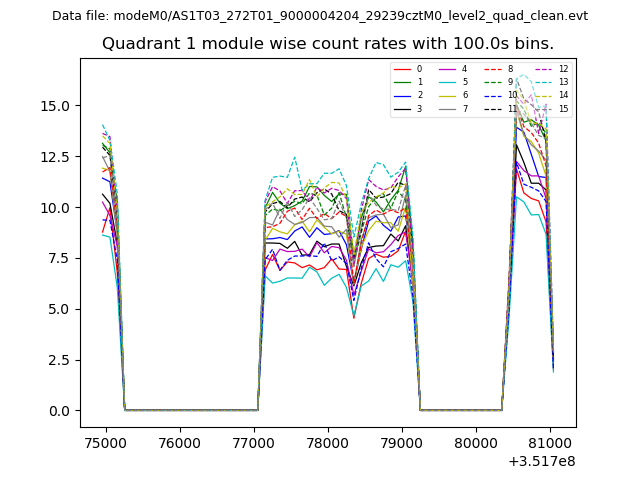
| Module-wise count rates for Quadrant C Data is divided into 100 sec bins |
 |
 |
| Module-wise count rates for Quadrant D Data is divided into 100 sec bins |
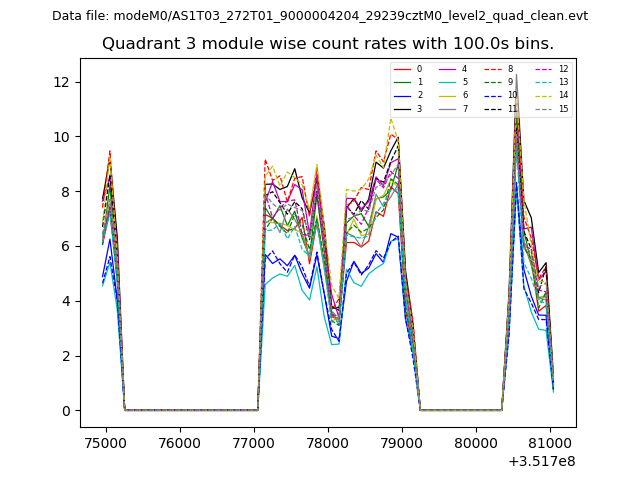 |
 |
| Parameter | Plot |
|---|---|
| CZT HV Monitor | 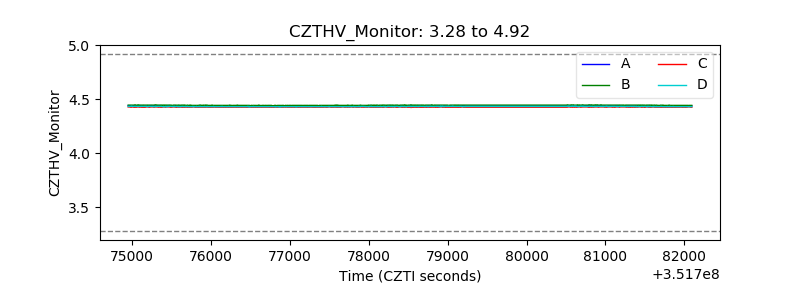 |
| D_VDD | 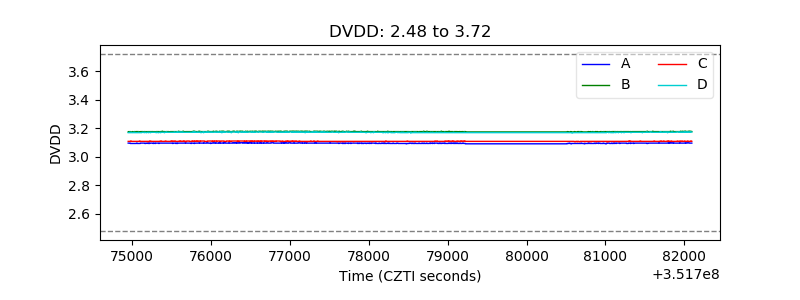 |
| Temperature 1 | 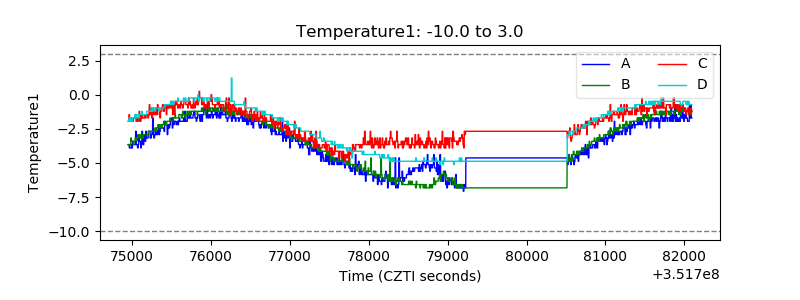 |
| Veto HV Monitor | 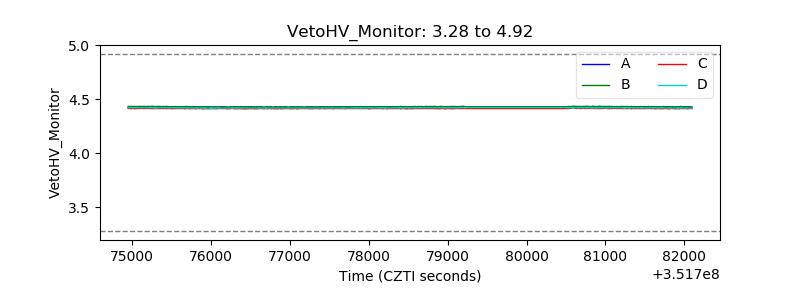 |
| Veto LLD | 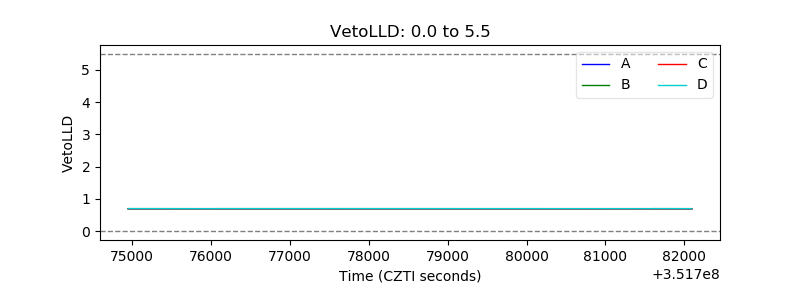 |
| Alpha Counter | 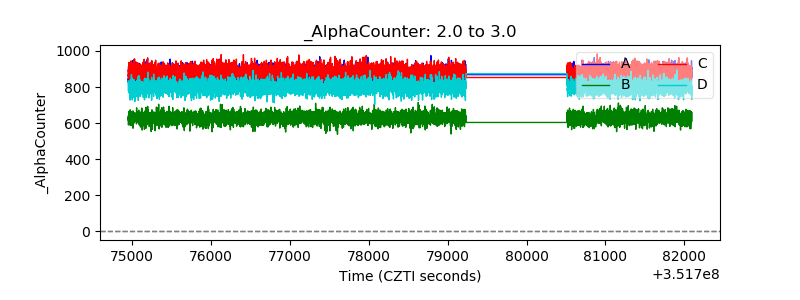 |
| _CPM_Rate |  |
| CZT Counter | 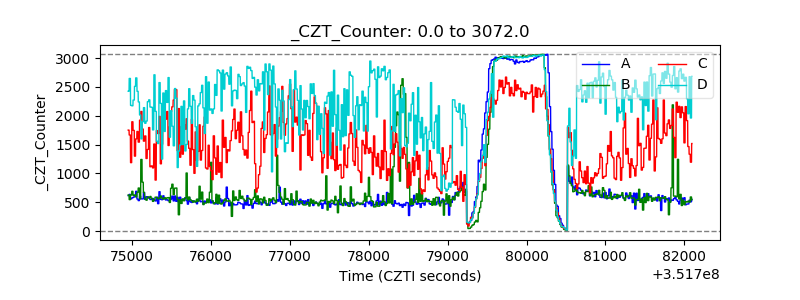 |
| +2.5 Volts monitor |  |
| +5 Volts monitor |  |
| _ROLL_ROT | 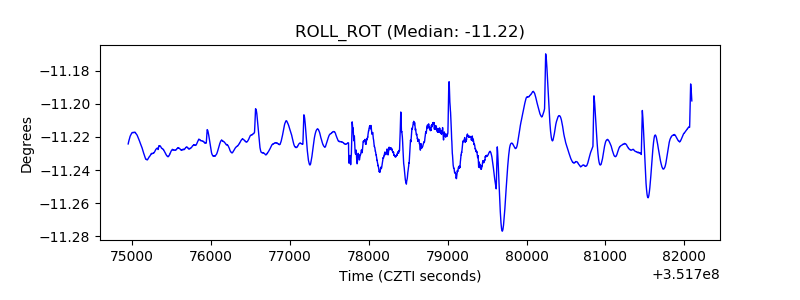 |
| _Roll_DEC |  |
| _Roll_RA |  |
| Veto Counter | 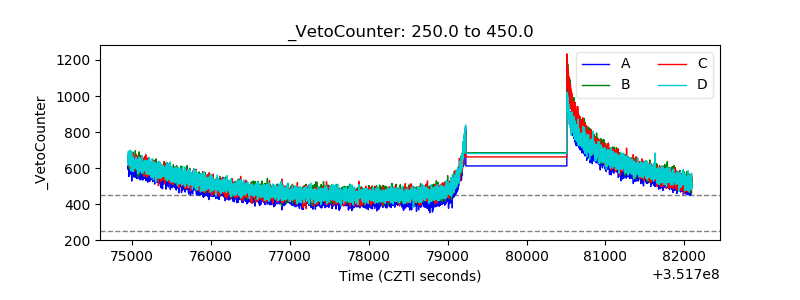 |