| Param | Original file | Final file |
|---|---|---|
| Filename | modeM0/AS1T03_272T01_9000004204_29240cztM0_level2.evt | modeM0/AS1T03_272T01_9000004204_29240cztM0_level2_quad_clean.evt |
| Size (bytes) | 941,244,480 | 60,785,280 |
| Size | 897.6 MB | 58.0 MB |
| Events in quadrant A | 3,141,577 | 398,472 |
| Events in quadrant B | 3,843,800 | 397,587 |
| Events in quadrant C | 8,430,755 | 351,702 |
| Events in quadrant D | 12,691,642 | 277,959 |
| Mode M9 | |||
|---|---|---|---|
| Quadrant | BADHDUFLAG | Total packets | Discarded packets |
| A | 0 | 14 | 0 |
| B | 0 | 14 | 0 |
| C | 0 | 14 | 0 |
| D | 0 | 14 | 0 |
| Mode SS | |||
|---|---|---|---|
| Quadrant | BADHDUFLAG | Total packets | Discarded packets |
| A | 0 | 118 | 0 |
| B | 0 | 118 | 0 |
| C | 0 | 118 | 0 |
| D | 0 | 118 | 0 |
| Mode M0 | |||
|---|---|---|---|
| Quadrant | BADHDUFLAG | Total packets | Discarded packets |
| A | 0 | 12811 | 2 |
| B | 0 | 15195 | 1 |
| C | 0 | 29204 | 1 |
| D | 0 | 41780 | 1 |
| Quadrant | Total seconds | Saturated seconds | Saturation percentage |
|---|---|---|---|
| A | 5932 | 80 | 1.348618% |
| B | 5933 | 246 | 4.146300% |
| C | 5933 | 1252 | 21.102309% |
| D | 5933 | 3915 | 65.986853% |
Noise dominated data is calculated using 1-second bins in cleaned event files. If a bin has >2000 counts, and if more than 50% of those come from <1% of pixels, then it is considered to be noise-dominated and hence unusable.
| Quadrant | # 1 sec bins | Bins with >0 counts | Bins with >2000 counts | High rate bins dominated by noise | Noise dominated (total time) | Noise dominated (detector-on time) | Marked lightcurve |
|---|---|---|---|---|---|---|---|
| A | 7252 | 5933 | 0 | 0 | 0.00% | 0.00% | 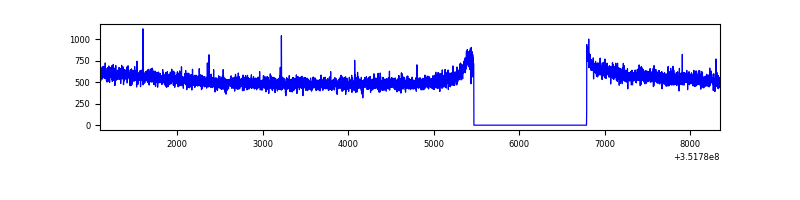 |
| B | 7253 | 5934 | 101 | 101 | 1.39% | 1.70% |  |
| C | 7253 | 5934 | 661 | 661 | 9.11% | 11.14% | 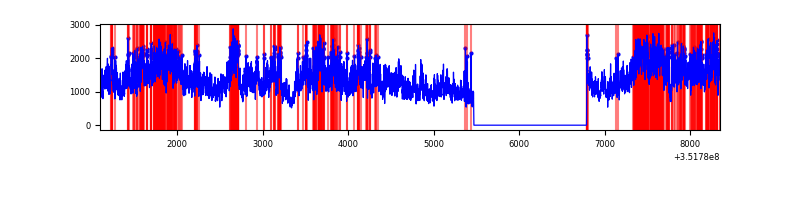 |
| D | 7253 | 5934 | 3732 | 3732 | 51.45% | 62.89% | 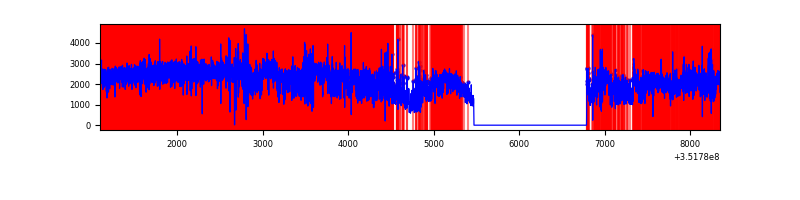 |
Top three noisy pixels from each quadrant. If the there are fewer than three noisy pixels in the level2.evt file, extra rows are filled as -1
| Pixel properties | Quadrant properties | ||||||
|---|---|---|---|---|---|---|---|
| Quadrant | DetID | PixID | Counts | Sigma | Mean | Median | Sigma |
| A | 13 | 254 | 11206 | 65.17 | 814 | 802 | 159.6 |
| A | 0 | 226 | 7060 | 39.2 | 814 | 802 | 159.6 |
| A | 3 | 137 | 6965 | 38.61 | 814 | 802 | 159.6 |
| B | 0 | 229 | 542726 | 3730.42 | 790 | 775 | 145.3 |
| B | 10 | 246 | 58730 | 398.92 | 790 | 775 | 145.3 |
| B | 0 | 189 | 43273 | 292.53 | 790 | 775 | 145.3 |
| C | 3 | 233 | 5422463 | 32742.41 | 730 | 735 | 165.6 |
| C | 14 | 238 | 120264 | 721.85 | 730 | 735 | 165.6 |
| C | 15 | 208 | 23999 | 140.49 | 730 | 735 | 165.6 |
| D | 7 | 223 | 8925954 | 65129.69 | 590 | 576 | 137.0 |
| D | 1 | 52 | 916636 | 6684.61 | 590 | 576 | 137.0 |
| D | 8 | 195 | 405423 | 2954.22 | 590 | 576 | 137.0 |
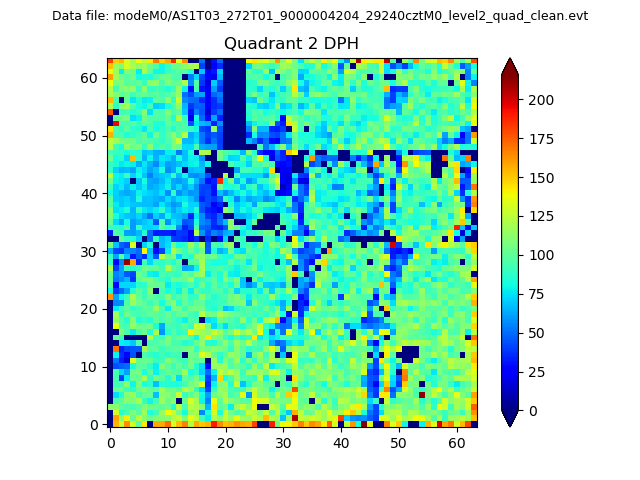
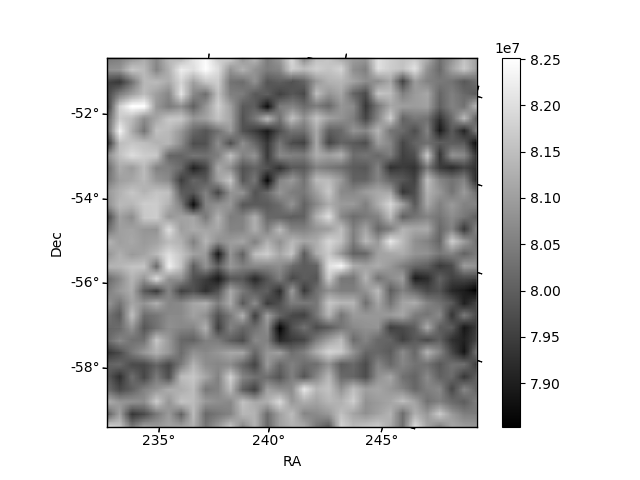
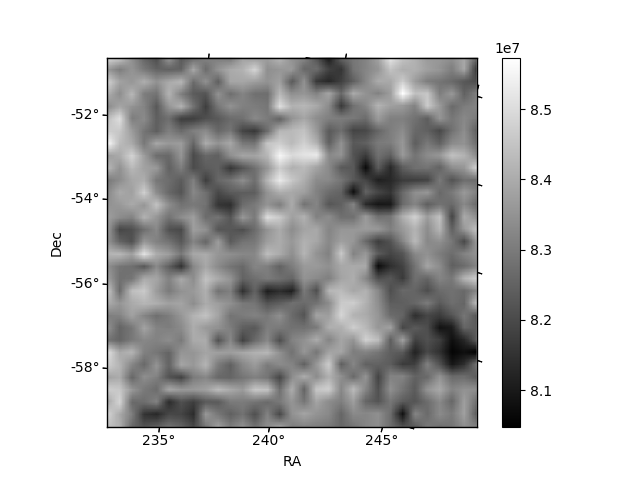
Histogram calculated using DETX and DETY for each event in the final _common_clean file
| Quadrant A | 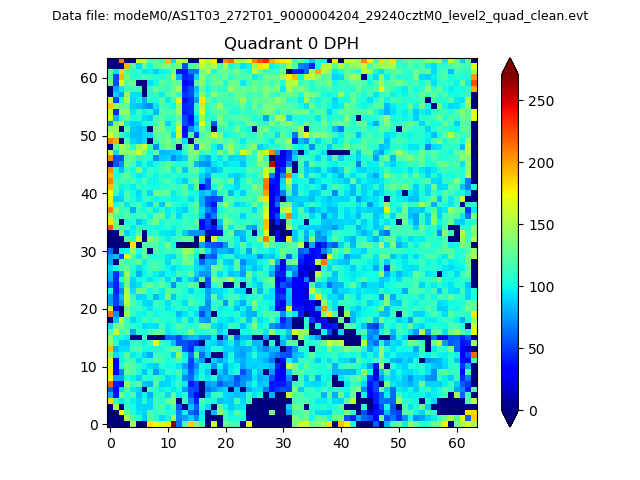 |
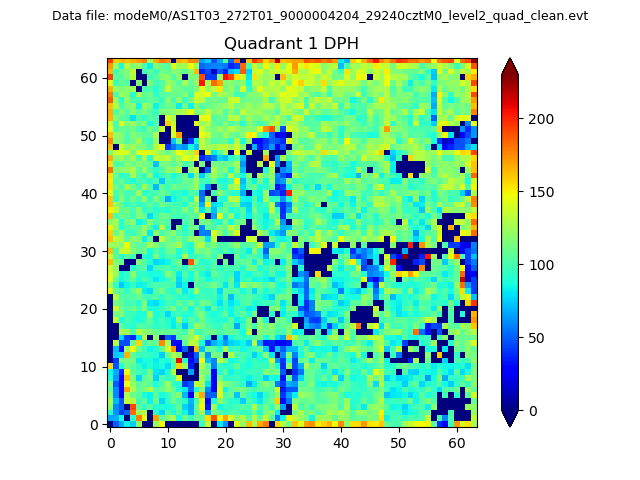 |
Quadrant B |
|---|---|---|---|
| Quadrant D | 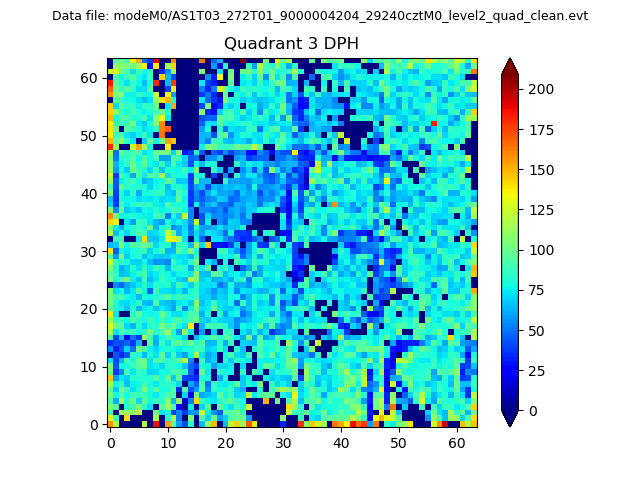 |
 |
Quadrant C |
| Plot type | Count rate plots | Images |
|---|---|---|
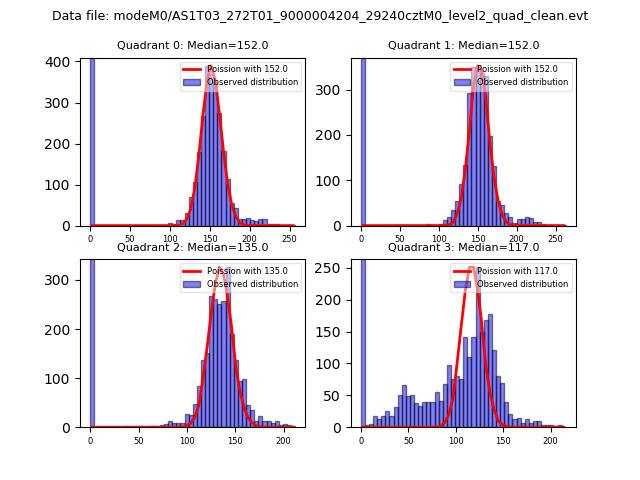
| Comparison with Poisson distribution Blue bars denote a histogram of data divided into 1 sec bins. Red curve is a Poisson curve with rate = median count rate of data. |
 |
 |
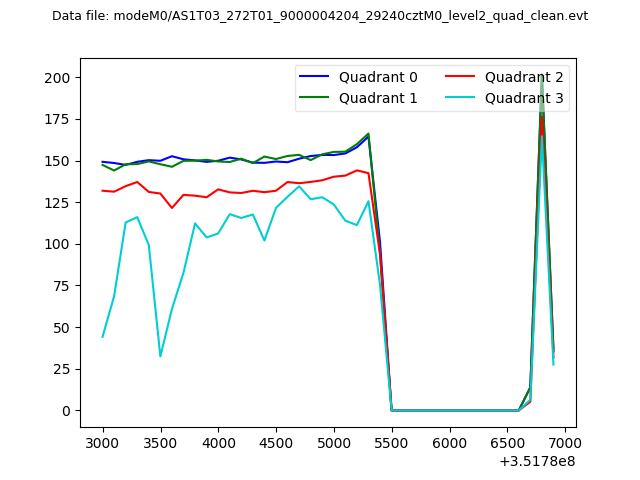
| Quadrant-wise count rates Data is divided into 100 sec bins |
 |
|
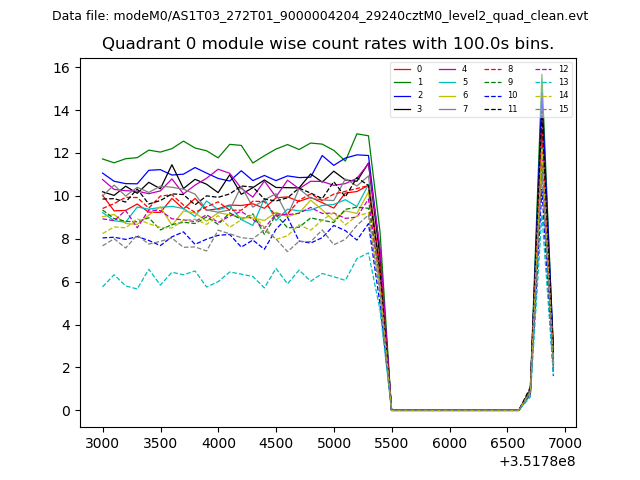
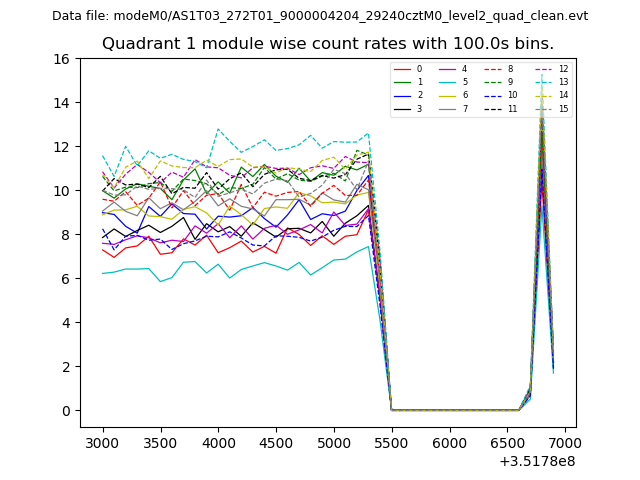
| Module-wise count rates for Quadrant A Data is divided into 100 sec bins |
 |
 |
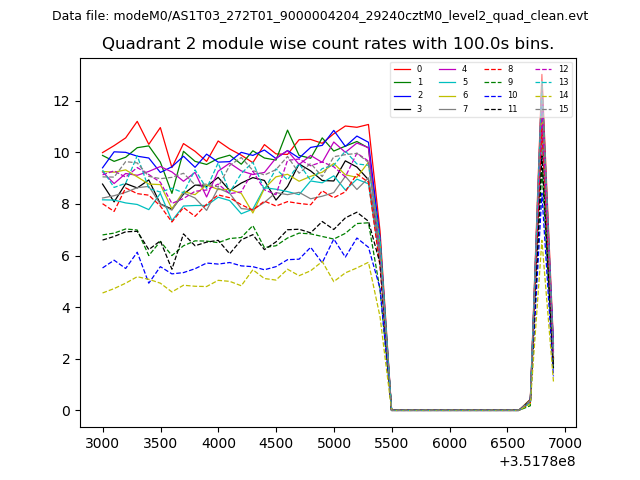
| Module-wise count rates for Quadrant B Data is divided into 100 sec bins |
 |
 |
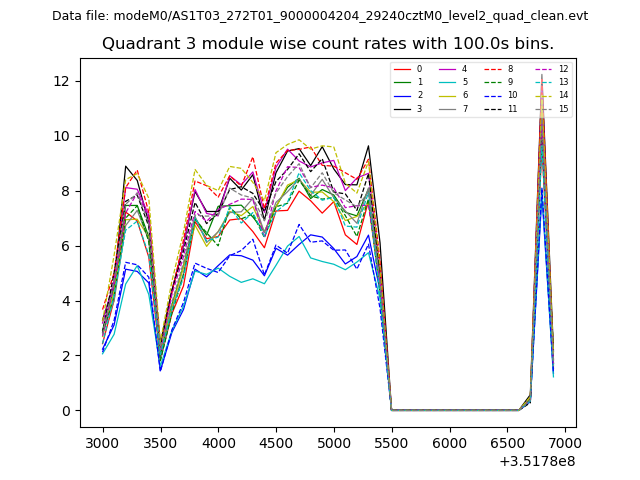
| Module-wise count rates for Quadrant C Data is divided into 100 sec bins |
 |
 |
| Module-wise count rates for Quadrant D Data is divided into 100 sec bins |
 |
 |
| Parameter | Plot |
|---|---|
| CZT HV Monitor | 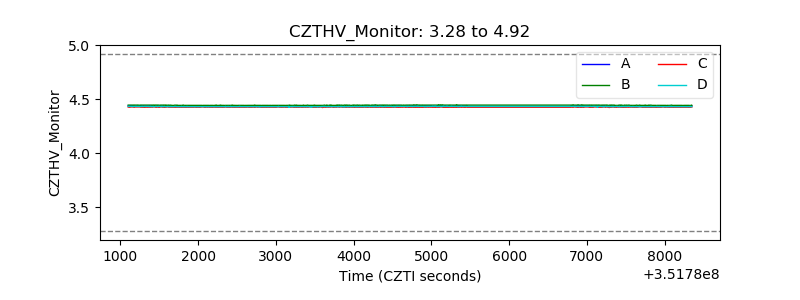 |
| D_VDD | 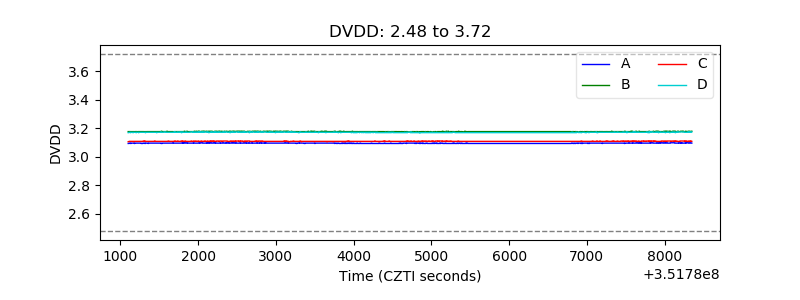 |
| Temperature 1 | 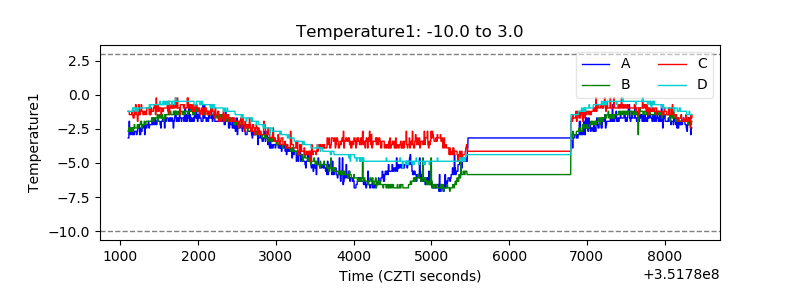 |
| Veto HV Monitor | 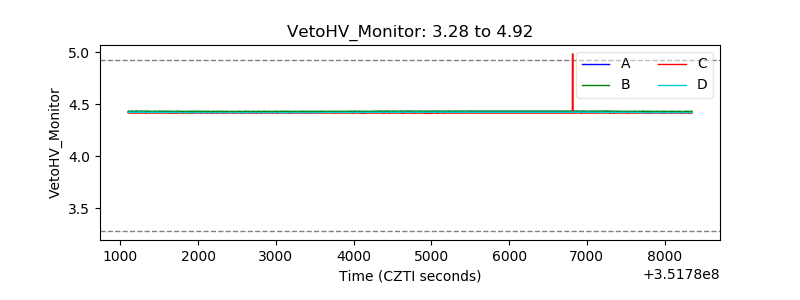 |
| Veto LLD | 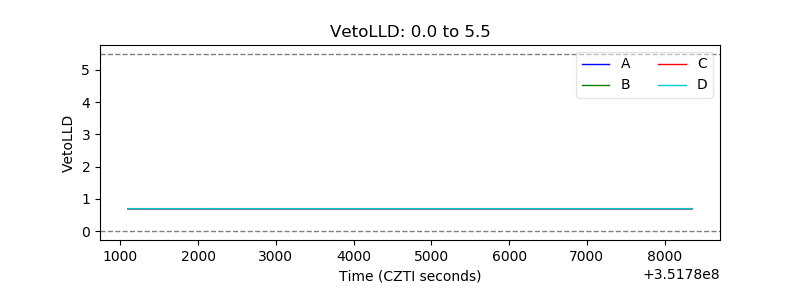 |
| Alpha Counter | 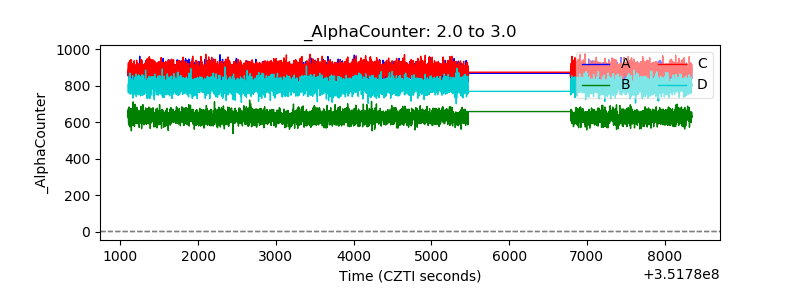 |
| _CPM_Rate | 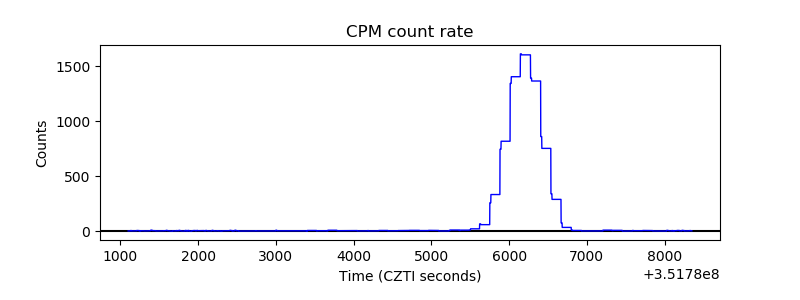 |
| CZT Counter | 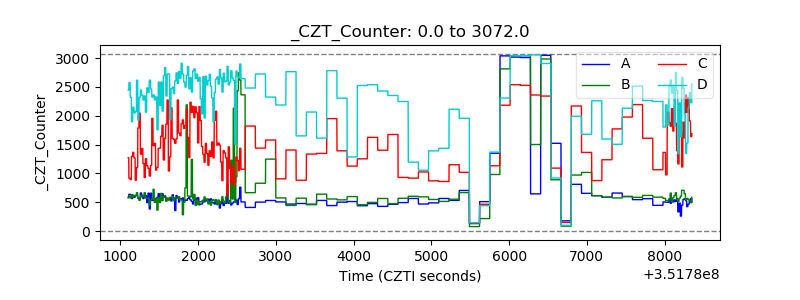 |
| +2.5 Volts monitor |  |
| +5 Volts monitor | 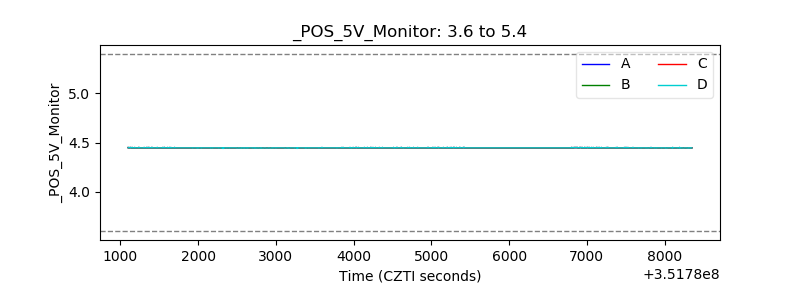 |
| _ROLL_ROT | 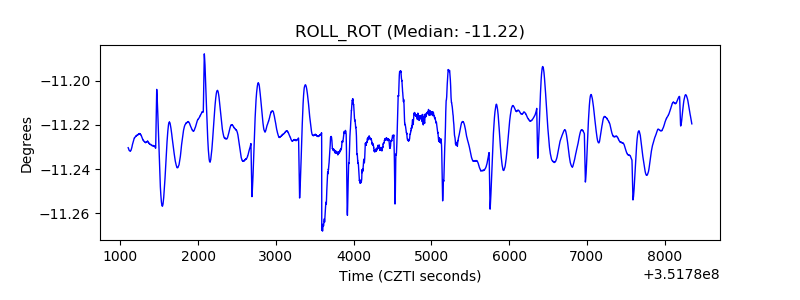 |
| _Roll_DEC | 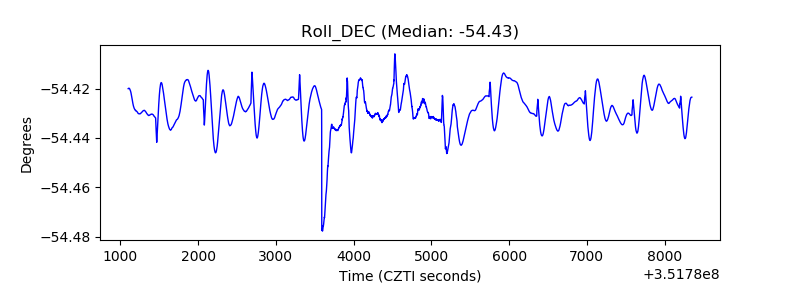 |
| _Roll_RA | 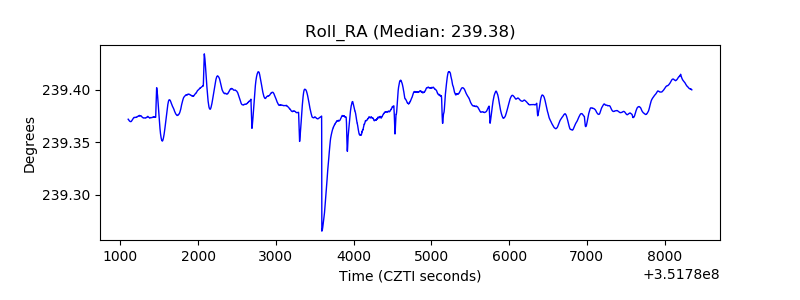 |
| Veto Counter | 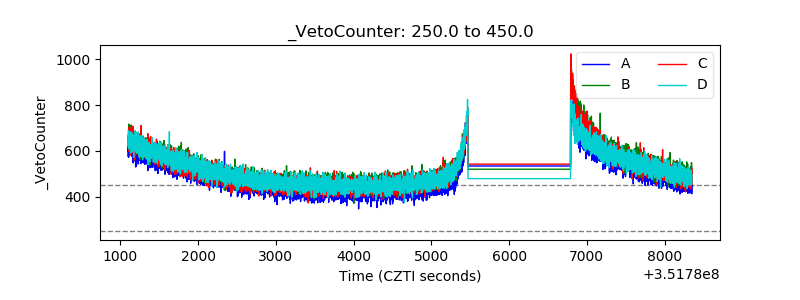 |