| Param | Original file | Final file |
|---|---|---|
| Filename | modeM0/AS1T03_272T01_9000004204_29241cztM0_level2.evt | modeM0/AS1T03_272T01_9000004204_29241cztM0_level2_quad_clean.evt |
| Size (bytes) | 779,878,080 | 67,812,480 |
| Size | 743.7 MB | 64.7 MB |
| Events in quadrant A | 2,973,422 | 443,652 |
| Events in quadrant B | 3,634,437 | 443,018 |
| Events in quadrant C | 7,000,756 | 399,171 |
| Events in quadrant D | 9,616,314 | 357,771 |
| Mode M9 | |||
|---|---|---|---|
| Quadrant | BADHDUFLAG | Total packets | Discarded packets |
| A | 0 | 12 | 0 |
| B | 0 | 12 | 0 |
| C | 0 | 12 | 0 |
| D | 0 | 12 | 0 |
| Mode SS | |||
|---|---|---|---|
| Quadrant | BADHDUFLAG | Total packets | Discarded packets |
| A | 0 | 120 | 0 |
| B | 0 | 120 | 0 |
| C | 0 | 120 | 0 |
| D | 0 | 120 | 0 |
| Mode M0 | |||
|---|---|---|---|
| Quadrant | BADHDUFLAG | Total packets | Discarded packets |
| A | 0 | 12256 | 1 |
| B | 0 | 14509 | 1 |
| C | 0 | 24943 | 1 |
| D | 0 | 32626 | 1 |
| Quadrant | Total seconds | Saturated seconds | Saturation percentage |
|---|---|---|---|
| A | 5849 | 100 | 1.709694% |
| B | 5850 | 226 | 3.863248% |
| C | 5850 | 843 | 14.410256% |
| D | 5850 | 1967 | 33.623932% |
Noise dominated data is calculated using 1-second bins in cleaned event files. If a bin has >2000 counts, and if more than 50% of those come from <1% of pixels, then it is considered to be noise-dominated and hence unusable.
| Quadrant | # 1 sec bins | Bins with >0 counts | Bins with >2000 counts | High rate bins dominated by noise | Noise dominated (total time) | Noise dominated (detector-on time) | Marked lightcurve |
|---|---|---|---|---|---|---|---|
| A | 7024 | 5850 | 0 | 0 | 0.00% | 0.00% | 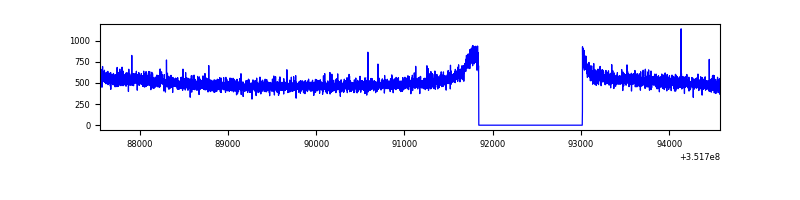 |
| B | 7025 | 5851 | 58 | 58 | 0.83% | 0.99% | 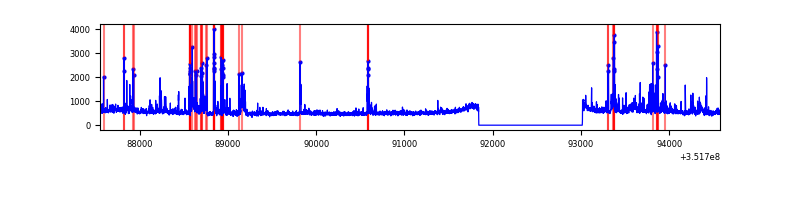 |
| C | 7025 | 5851 | 397 | 397 | 5.65% | 6.79% | 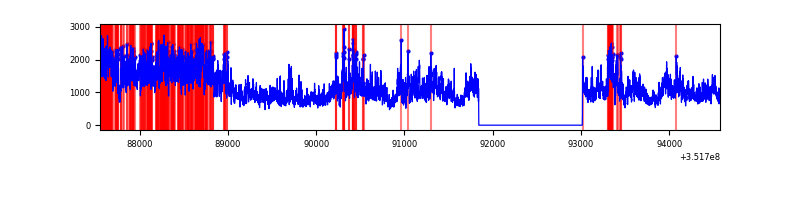 |
| D | 7025 | 5851 | 2184 | 2184 | 31.09% | 37.33% | 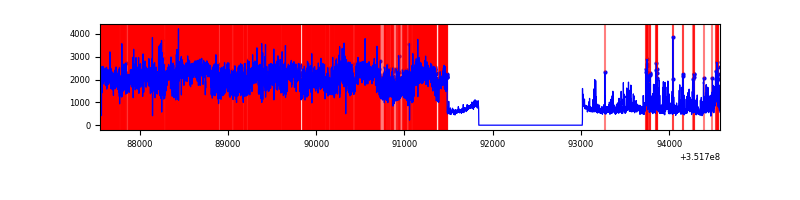 |
Top three noisy pixels from each quadrant. If the there are fewer than three noisy pixels in the level2.evt file, extra rows are filled as -1
| Pixel properties | Quadrant properties | ||||||
|---|---|---|---|---|---|---|---|
| Quadrant | DetID | PixID | Counts | Sigma | Mean | Median | Sigma |
| A | 13 | 254 | 11635 | 71.34 | 770 | 755 | 152.5 |
| A | 3 | 137 | 7125 | 41.77 | 770 | 755 | 152.5 |
| A | 0 | 226 | 6594 | 38.29 | 770 | 755 | 152.5 |
| B | 0 | 229 | 331680 | 2347.27 | 756 | 739 | 141.0 |
| B | 0 | 189 | 112563 | 793.13 | 756 | 739 | 141.0 |
| B | 0 | 183 | 102470 | 721.55 | 756 | 739 | 141.0 |
| C | 3 | 233 | 4114184 | 25453.37 | 705 | 710 | 161.6 |
| C | 14 | 238 | 114563 | 704.5 | 705 | 710 | 161.6 |
| C | 2 | 114 | 13868 | 81.42 | 705 | 710 | 161.6 |
| D | 7 | 223 | 5608302 | 35005.95 | 688 | 670 | 160.2 |
| D | 1 | 52 | 701416 | 4374.45 | 688 | 670 | 160.2 |
| D | 8 | 195 | 405399 | 2526.54 | 688 | 670 | 160.2 |
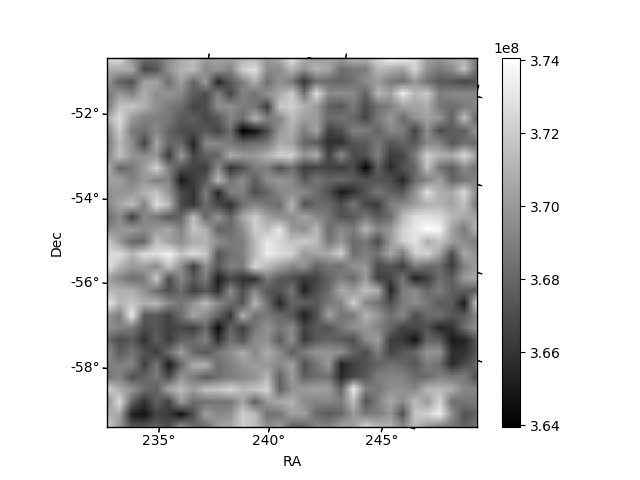
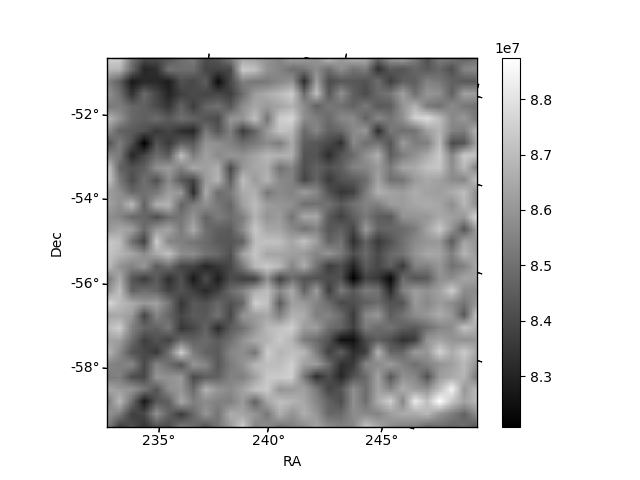
Histogram calculated using DETX and DETY for each event in the final _common_clean file
| Quadrant A | 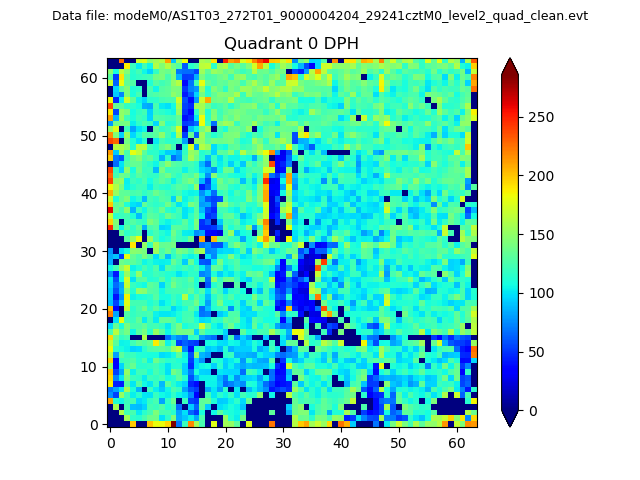 |
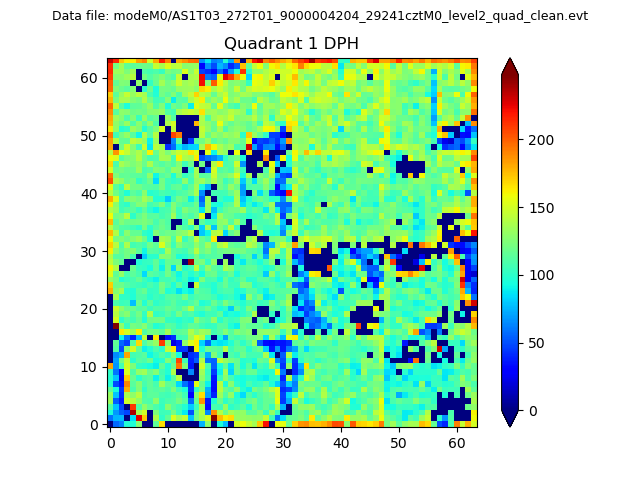 |
Quadrant B |
|---|---|---|---|
| Quadrant D | 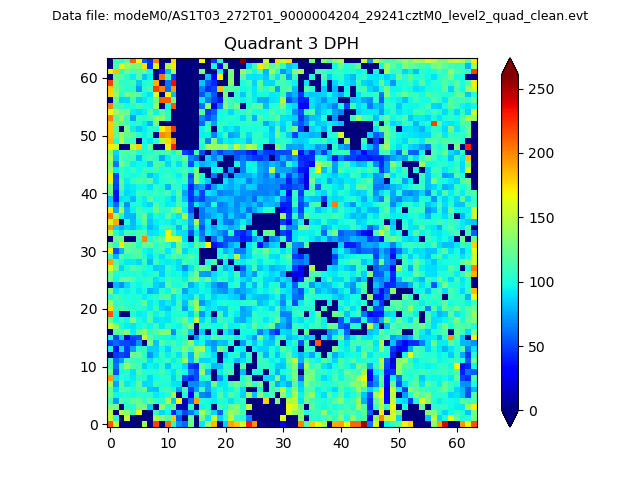 |
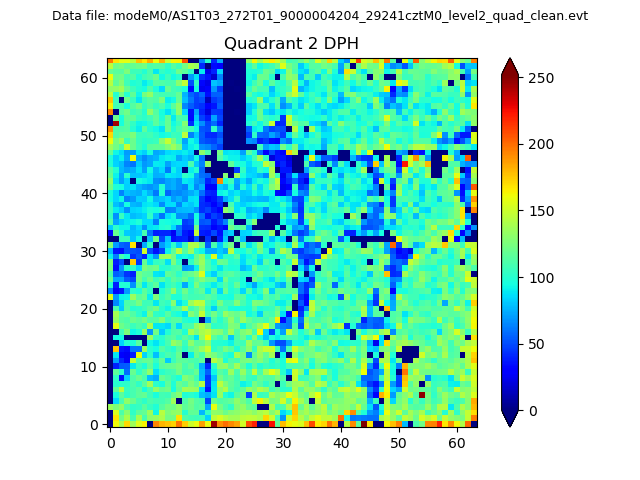 |
Quadrant C |
| Plot type | Count rate plots | Images |
|---|---|---|
| Comparison with Poisson distribution Blue bars denote a histogram of data divided into 1 sec bins. Red curve is a Poisson curve with rate = median count rate of data. |
 |
 |
| Quadrant-wise count rates Data is divided into 100 sec bins |
 |
|
| Module-wise count rates for Quadrant A Data is divided into 100 sec bins |
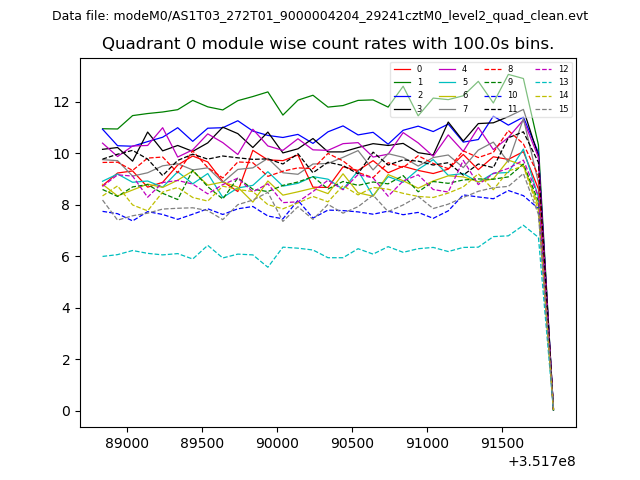 |
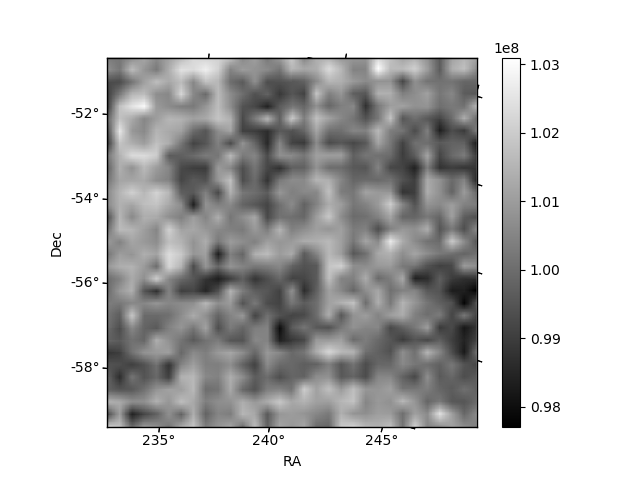 |
| Module-wise count rates for Quadrant B Data is divided into 100 sec bins |
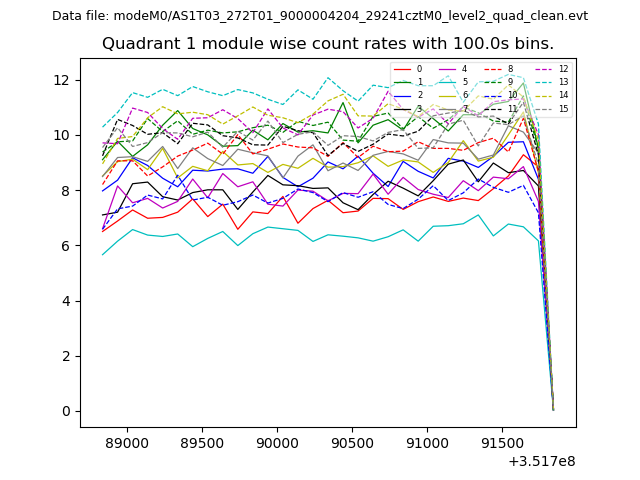 |
 |
| Module-wise count rates for Quadrant C Data is divided into 100 sec bins |
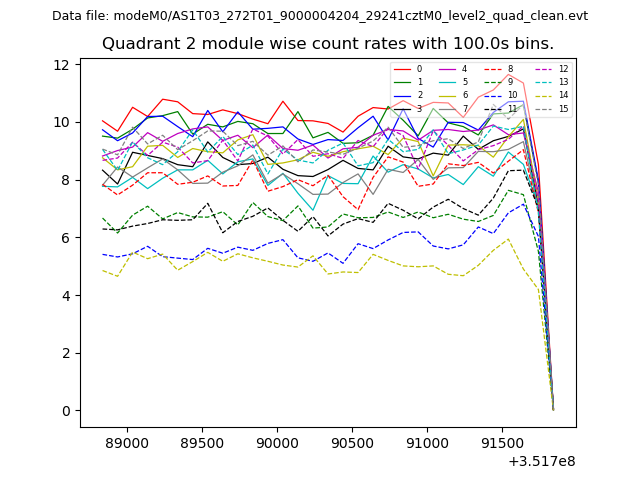 |
 |
| Module-wise count rates for Quadrant D Data is divided into 100 sec bins |
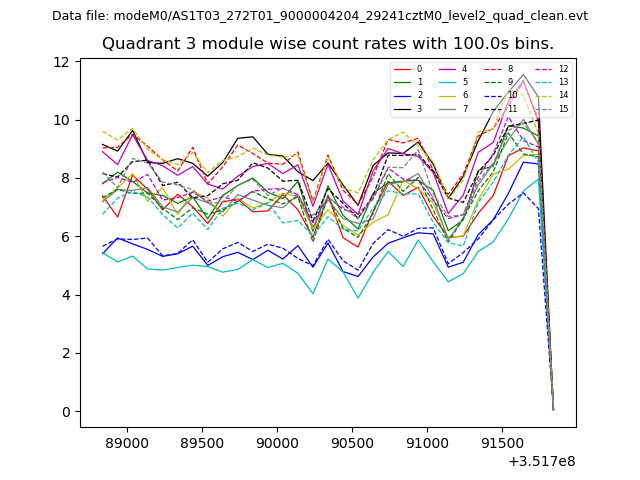 |
 |
| Parameter | Plot |
|---|---|
| CZT HV Monitor | 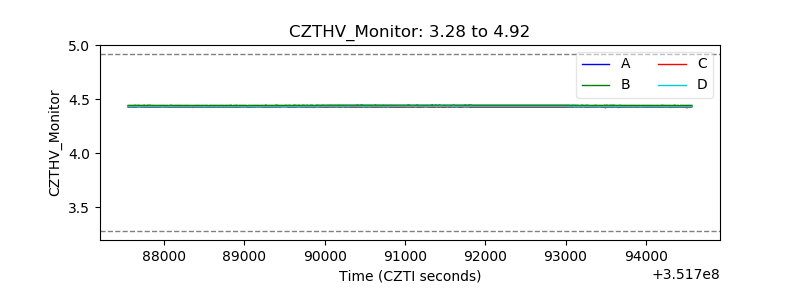 |
| D_VDD | 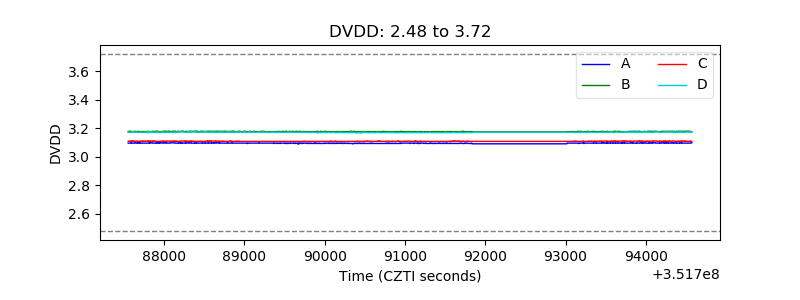 |
| Temperature 1 | 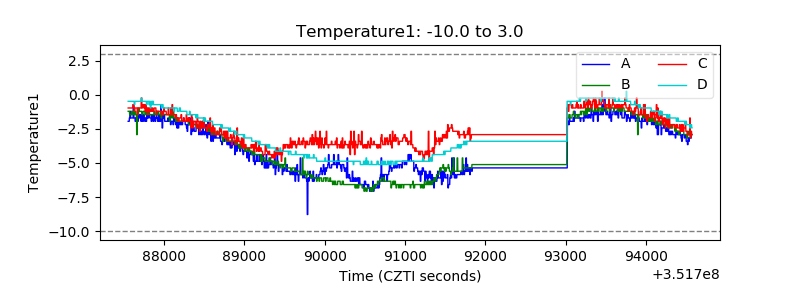 |
| Veto HV Monitor | 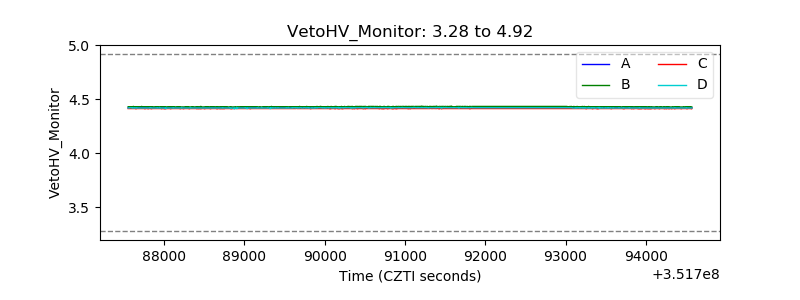 |
| Veto LLD | 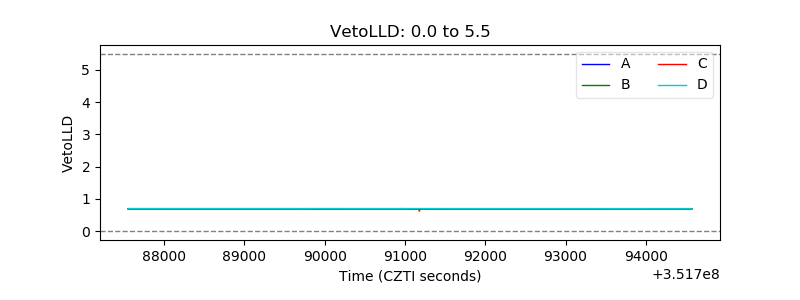 |
| Alpha Counter | 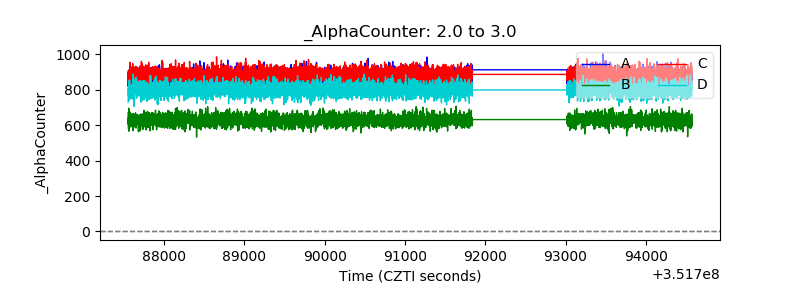 |
| _CPM_Rate | 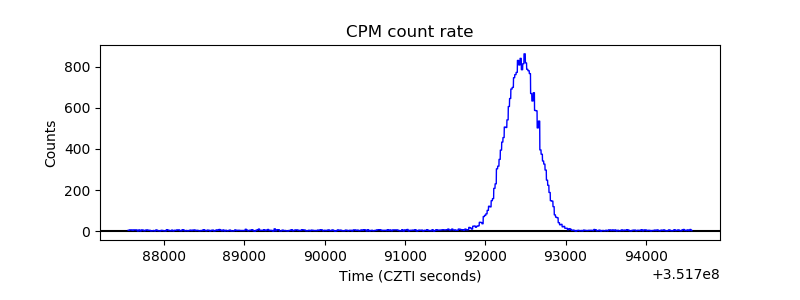 |
| CZT Counter | 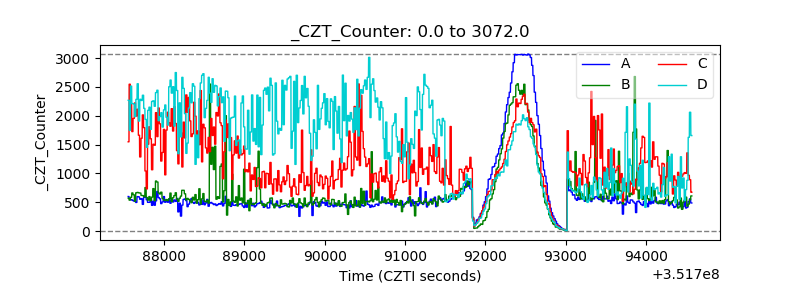 |
| +2.5 Volts monitor |  |
| +5 Volts monitor |  |
| _ROLL_ROT | 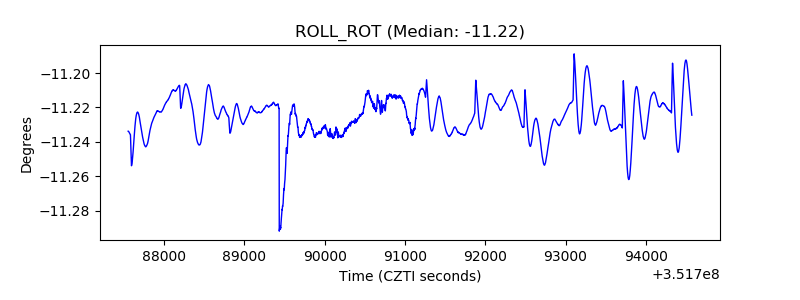 |
| _Roll_DEC | 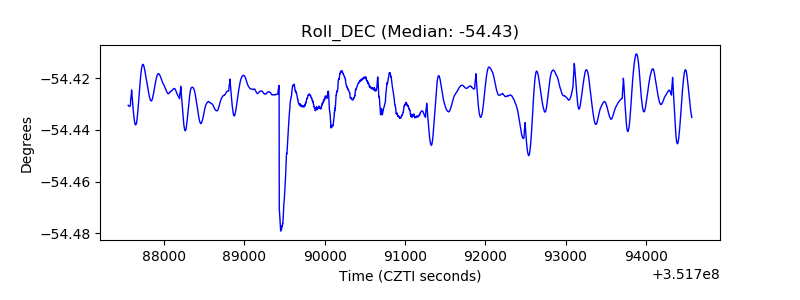 |
| _Roll_RA | 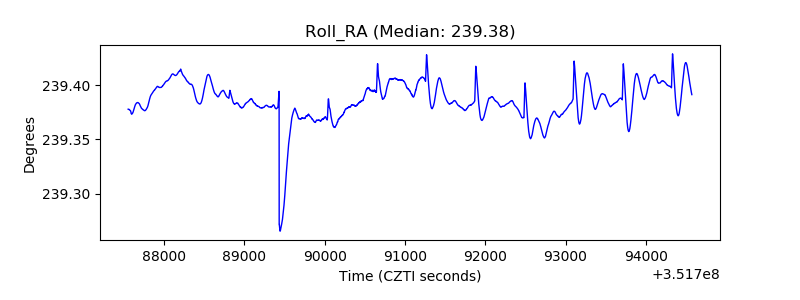 |
| Veto Counter | 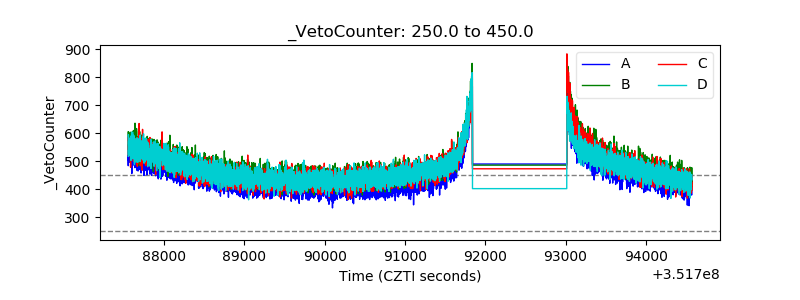 |