| Param | Original file | Final file |
|---|---|---|
| Filename | modeM0/AS1T03_272T01_9000004204_29242cztM0_level2.evt | modeM0/AS1T03_272T01_9000004204_29242cztM0_level2_quad_clean.evt |
| Size (bytes) | 673,505,280 | 81,204,480 |
| Size | 642.3 MB | 77.4 MB |
| Events in quadrant A | 3,260,099 | 522,264 |
| Events in quadrant B | 4,332,471 | 525,447 |
| Events in quadrant C | 7,227,235 | 475,336 |
| Events in quadrant D | 5,134,937 | 478,834 |
| Mode M9 | |||
|---|---|---|---|
| Quadrant | BADHDUFLAG | Total packets | Discarded packets |
| A | 0 | 9 | 0 |
| B | 0 | 9 | 0 |
| C | 0 | 9 | 0 |
| D | 0 | 9 | 0 |
| Mode SS | |||
|---|---|---|---|
| Quadrant | BADHDUFLAG | Total packets | Discarded packets |
| A | 0 | 134 | 0 |
| B | 0 | 134 | 0 |
| C | 0 | 134 | 0 |
| D | 0 | 134 | 0 |
| Mode M0 | |||
|---|---|---|---|
| Quadrant | BADHDUFLAG | Total packets | Discarded packets |
| A | 0 | 13644 | 1 |
| B | 0 | 17120 | 1 |
| C | 0 | 26183 | 8 |
| D | 0 | 19714 | 1 |
| Quadrant | Total seconds | Saturated seconds | Saturation percentage |
|---|---|---|---|
| A | 6549 | 76 | 1.160483% |
| B | 6549 | 230 | 3.511987% |
| C | 6548 | 869 | 13.271228% |
| D | 6548 | 370 | 5.650580% |
Noise dominated data is calculated using 1-second bins in cleaned event files. If a bin has >2000 counts, and if more than 50% of those come from <1% of pixels, then it is considered to be noise-dominated and hence unusable.
| Quadrant | # 1 sec bins | Bins with >0 counts | Bins with >2000 counts | High rate bins dominated by noise | Noise dominated (total time) | Noise dominated (detector-on time) | Marked lightcurve |
|---|---|---|---|---|---|---|---|
| A | 7444 | 6550 | 3 | 3 | 0.04% | 0.05% | 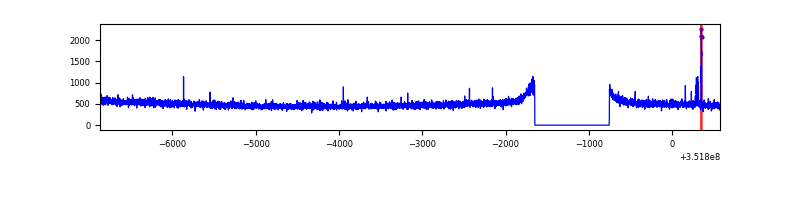 |
| B | 7444 | 6550 | 35 | 35 | 0.47% | 0.53% | 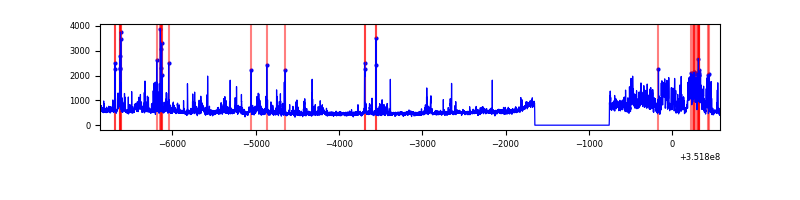 |
| C | 7443 | 6549 | 277 | 277 | 3.72% | 4.23% | 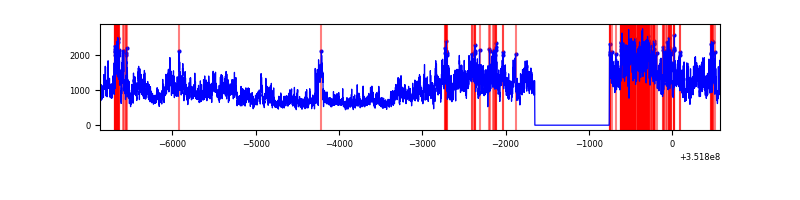 |
| D | 7443 | 6549 | 216 | 216 | 2.90% | 3.30% | 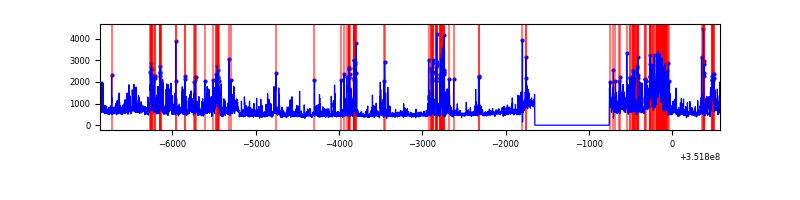 |
Top three noisy pixels from each quadrant. If the there are fewer than three noisy pixels in the level2.evt file, extra rows are filled as -1
| Pixel properties | Quadrant properties | ||||||
|---|---|---|---|---|---|---|---|
| Quadrant | DetID | PixID | Counts | Sigma | Mean | Median | Sigma |
| A | 13 | 170 | 23239 | 134.74 | 834 | 816 | 166.4 |
| A | 0 | 13 | 16605 | 94.88 | 834 | 816 | 166.4 |
| A | 13 | 254 | 13333 | 75.22 | 834 | 816 | 166.4 |
| B | 10 | 245 | 416801 | 2706.43 | 820 | 802 | 153.7 |
| B | 0 | 229 | 301135 | 1953.92 | 820 | 802 | 153.7 |
| B | 0 | 189 | 233003 | 1510.67 | 820 | 802 | 153.7 |
| C | 3 | 233 | 4102128 | 23128.69 | 765 | 771 | 177.3 |
| C | 14 | 238 | 124899 | 699.99 | 765 | 771 | 177.3 |
| C | 2 | 114 | 16107 | 86.48 | 765 | 771 | 177.3 |
| D | 1 | 52 | 680792 | 3625.37 | 788 | 765 | 187.6 |
| D | 8 | 195 | 453630 | 2414.32 | 788 | 765 | 187.6 |
| D | 12 | 233 | 391296 | 2082.0 | 788 | 765 | 187.6 |
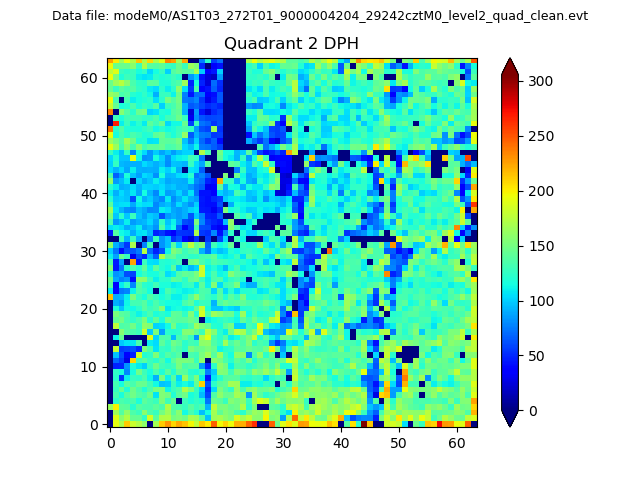
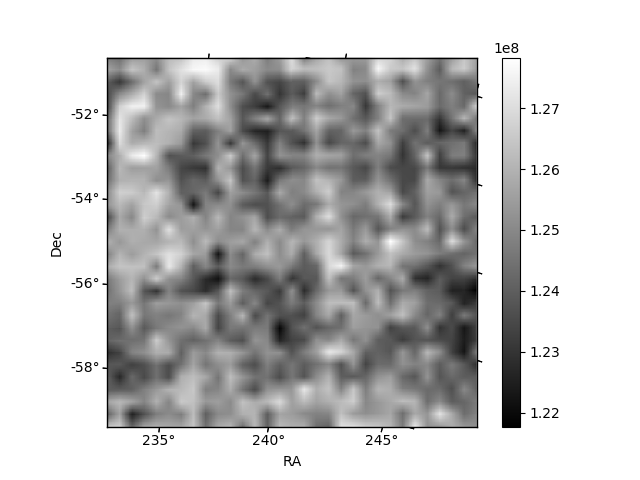
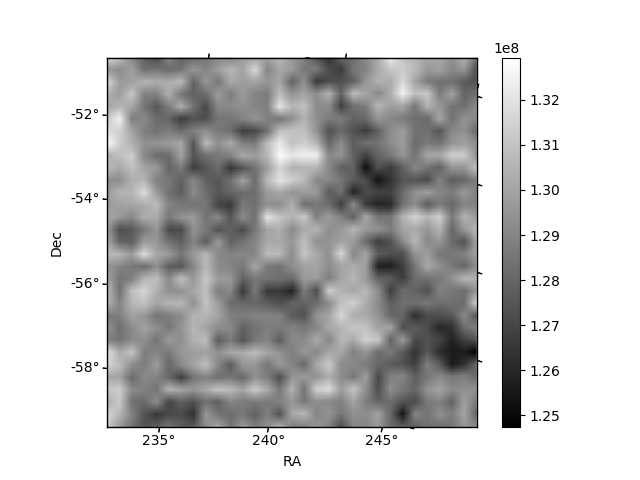
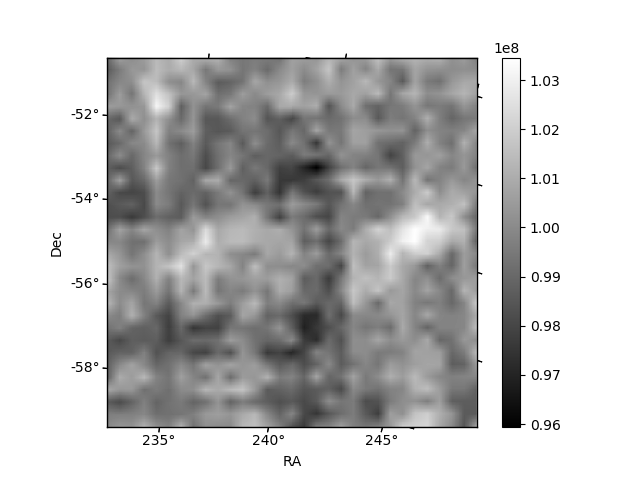
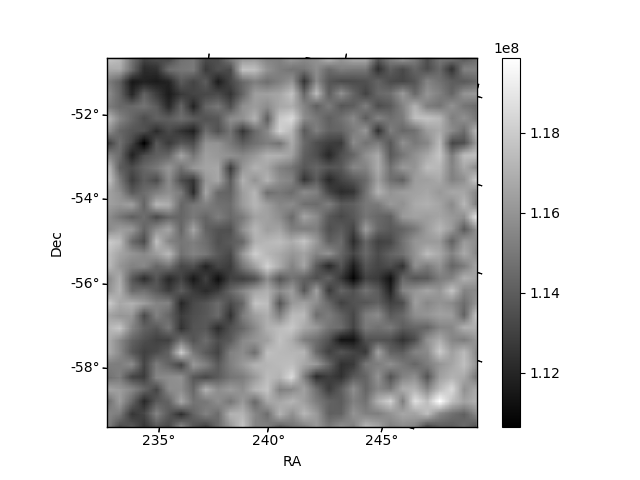
Histogram calculated using DETX and DETY for each event in the final _common_clean file
| Quadrant A | 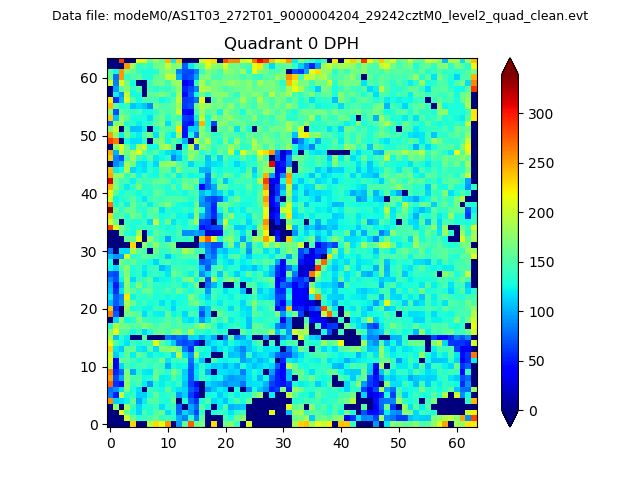 |
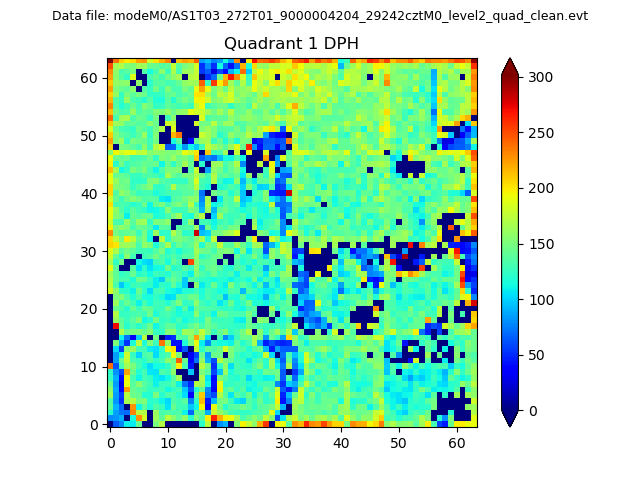 |
Quadrant B |
|---|---|---|---|
| Quadrant D | 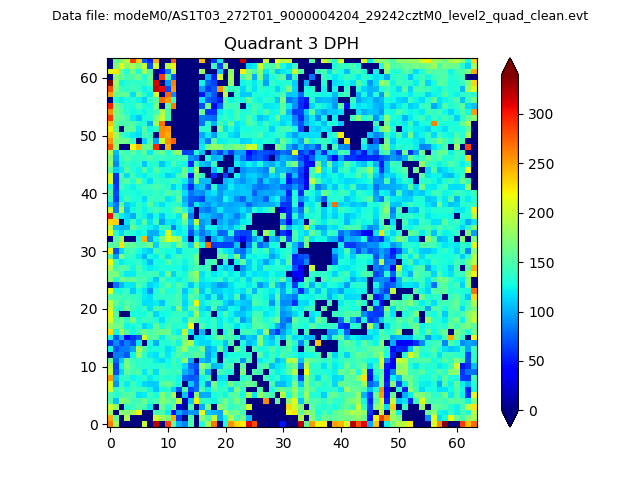 |
 |
Quadrant C |
| Plot type | Count rate plots | Images |
|---|---|---|
| Comparison with Poisson distribution Blue bars denote a histogram of data divided into 1 sec bins. Red curve is a Poisson curve with rate = median count rate of data. |
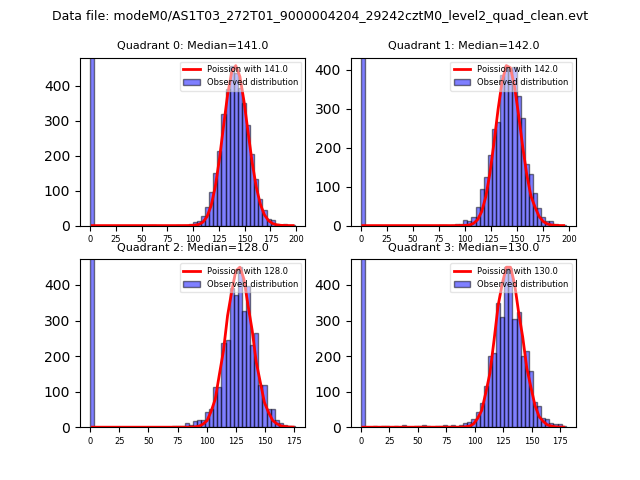 |
 |
| Quadrant-wise count rates Data is divided into 100 sec bins |
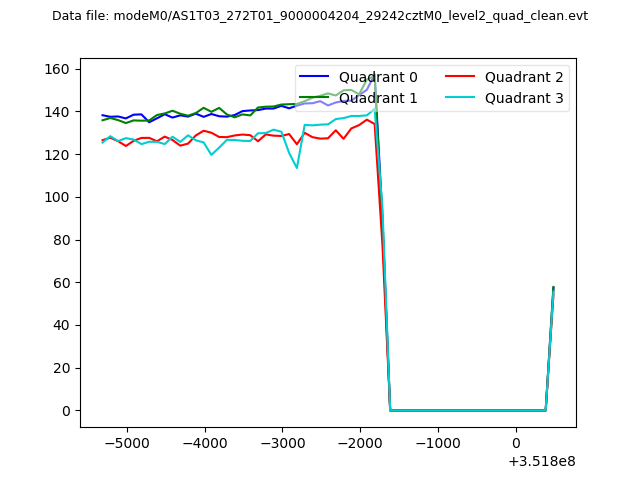 |
|
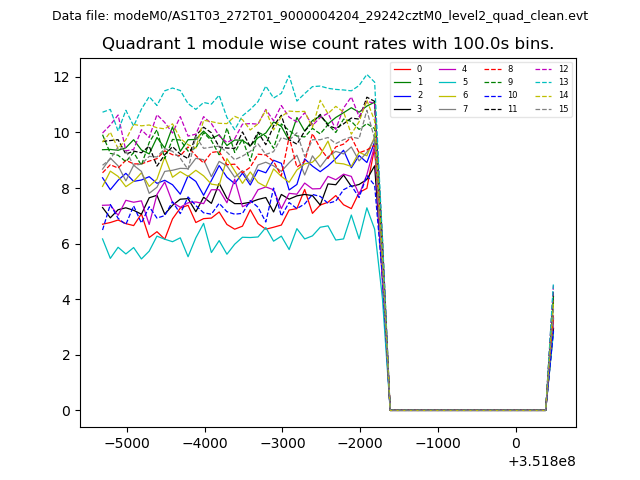
| Module-wise count rates for Quadrant A Data is divided into 100 sec bins |
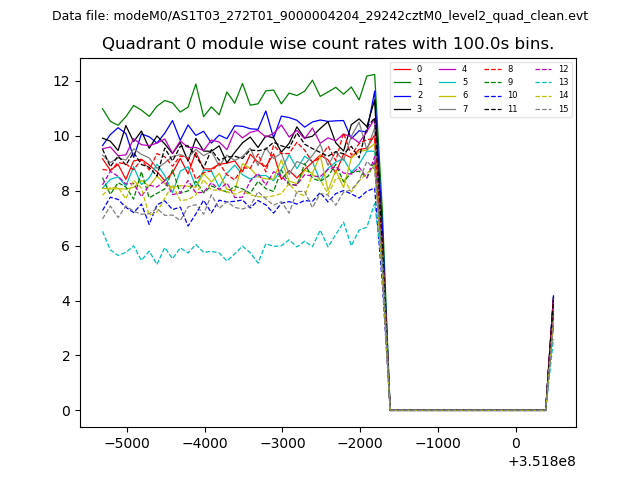 |
 |
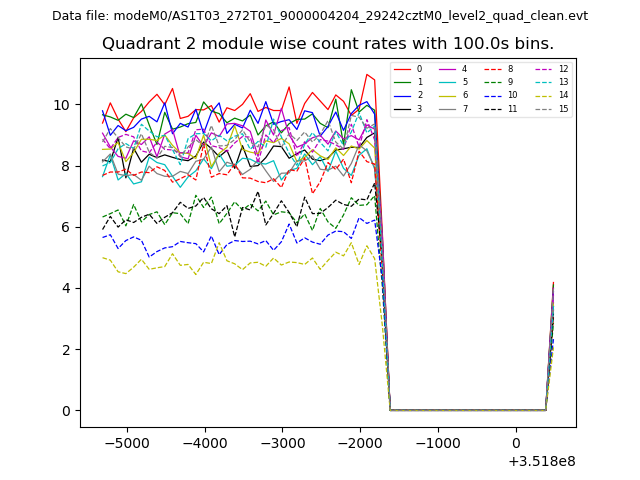
| Module-wise count rates for Quadrant B Data is divided into 100 sec bins |
 |
 |
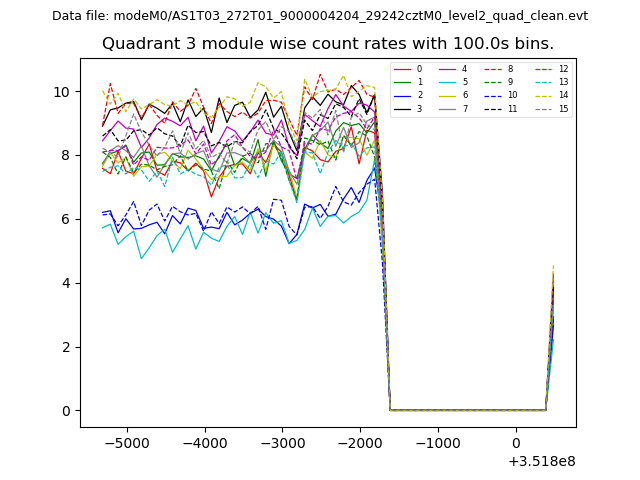
| Module-wise count rates for Quadrant C Data is divided into 100 sec bins |
 |
 |
| Module-wise count rates for Quadrant D Data is divided into 100 sec bins |
 |
 |
| Parameter | Plot |
|---|---|
| CZT HV Monitor | 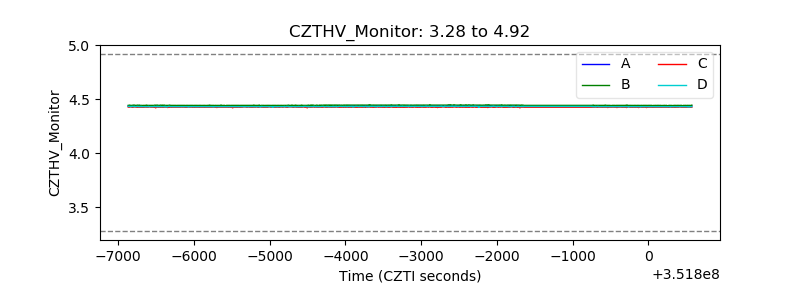 |
| D_VDD | 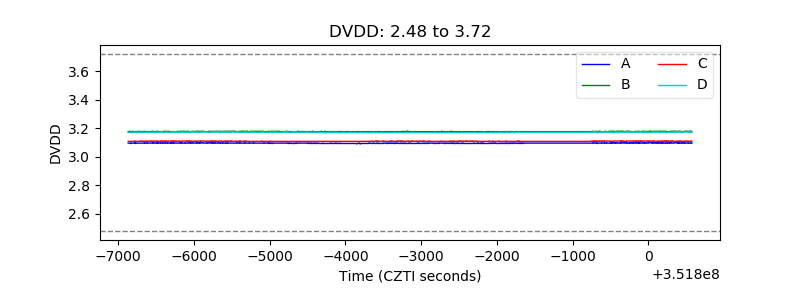 |
| Temperature 1 |  |
| Veto HV Monitor | 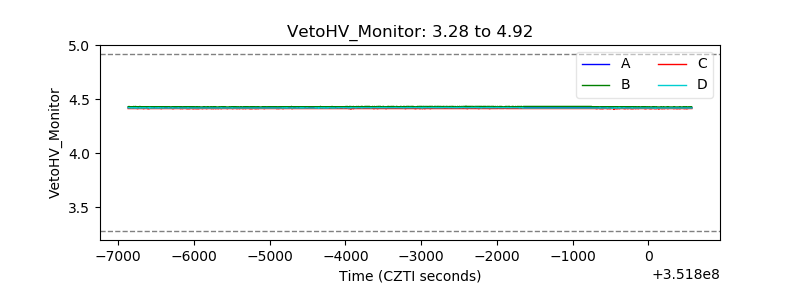 |
| Veto LLD | 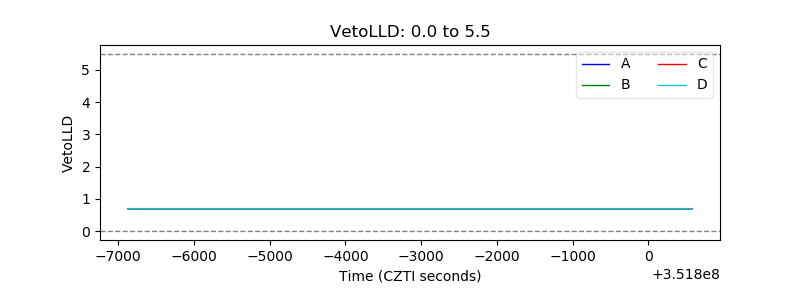 |
| Alpha Counter | 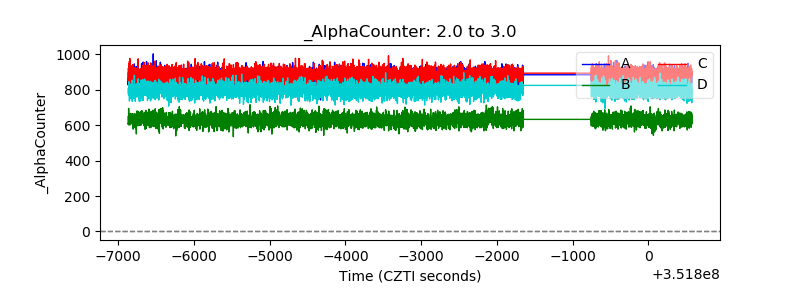 |
| _CPM_Rate | 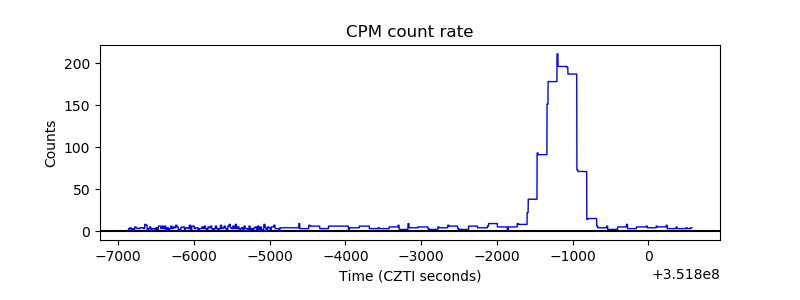 |
| CZT Counter | 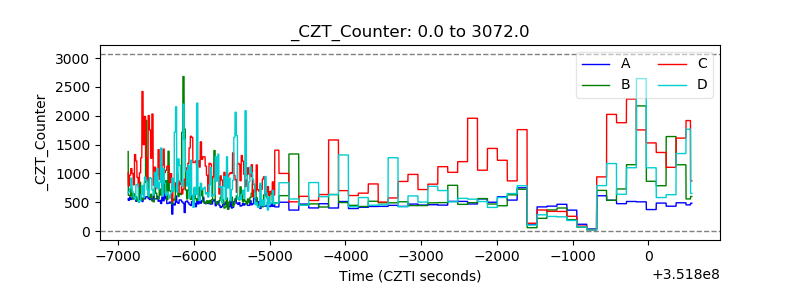 |
| +2.5 Volts monitor |  |
| +5 Volts monitor |  |
| _ROLL_ROT | 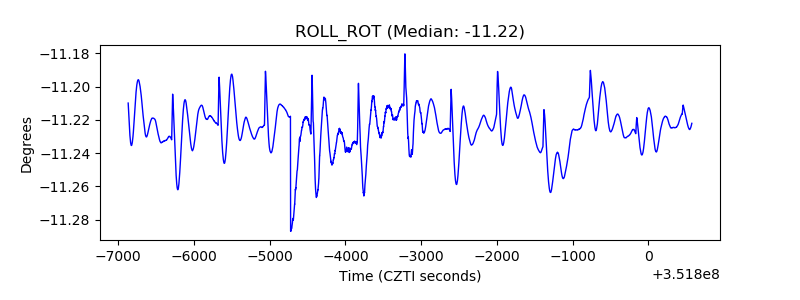 |
| _Roll_DEC | 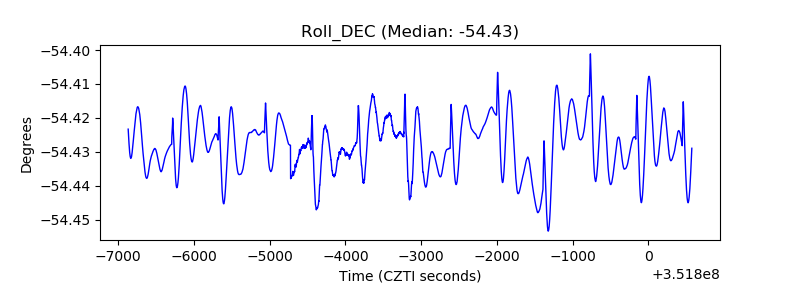 |
| _Roll_RA | 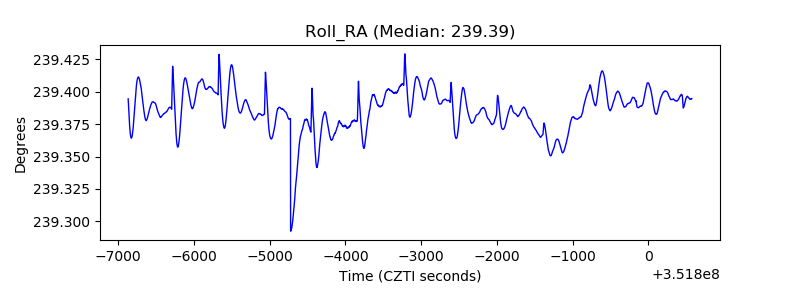 |
| Veto Counter | 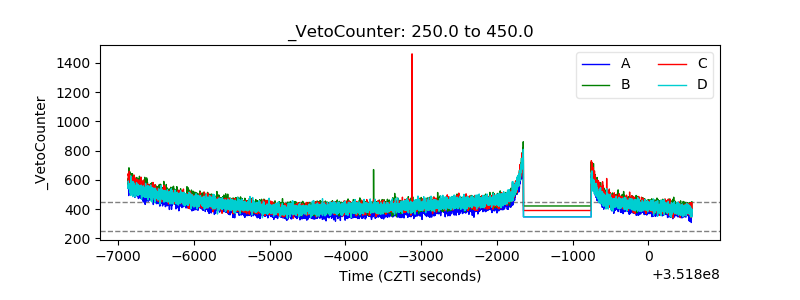 |