| Param | Original file | Final file |
|---|---|---|
| Filename | modeM0/AS1T03_272T01_9000004204_29244cztM0_level2.evt | modeM0/AS1T03_272T01_9000004204_29244cztM0_level2_quad_clean.evt |
| Size (bytes) | 477,400,320 | 36,213,120 |
| Size | 455.3 MB | 34.5 MB |
| Events in quadrant A | 1,758,020 | 230,711 |
| Events in quadrant B | 2,448,972 | 232,572 |
| Events in quadrant C | 4,979,423 | 202,264 |
| Events in quadrant D | 5,035,827 | 183,623 |
| Mode M9 | |||
|---|---|---|---|
| Quadrant | BADHDUFLAG | Total packets | Discarded packets |
| A | 0 | 3 | 0 |
| B | 0 | 3 | 0 |
| C | 0 | 3 | 0 |
| D | 0 | 3 | 0 |
| Mode SS | |||
|---|---|---|---|
| Quadrant | BADHDUFLAG | Total packets | Discarded packets |
| A | 0 | 70 | 0 |
| B | 0 | 70 | 0 |
| C | 0 | 70 | 0 |
| D | 0 | 70 | 0 |
| Mode M0 | |||
|---|---|---|---|
| Quadrant | BADHDUFLAG | Total packets | Discarded packets |
| A | 0 | 7349 | 1 |
| B | 0 | 9575 | 1 |
| C | 0 | 17252 | 1 |
| D | 0 | 17377 | 1 |
| Quadrant | Total seconds | Saturated seconds | Saturation percentage |
|---|---|---|---|
| A | 3484 | 61 | 1.750861% |
| B | 3484 | 209 | 5.998852% |
| C | 3484 | 994 | 28.530425% |
| D | 3483 | 1278 | 36.692506% |
Noise dominated data is calculated using 1-second bins in cleaned event files. If a bin has >2000 counts, and if more than 50% of those come from <1% of pixels, then it is considered to be noise-dominated and hence unusable.
| Quadrant | # 1 sec bins | Bins with >0 counts | Bins with >2000 counts | High rate bins dominated by noise | Noise dominated (total time) | Noise dominated (detector-on time) | Marked lightcurve |
|---|---|---|---|---|---|---|---|
| A | 3694 | 3485 | 0 | 0 | 0.00% | 0.00% | 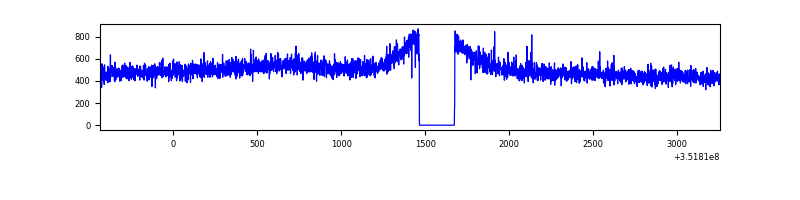 |
| B | 3694 | 3485 | 24 | 24 | 0.65% | 0.69% | 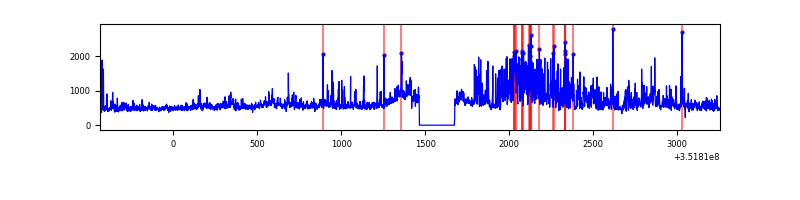 |
| C | 3694 | 3485 | 326 | 326 | 8.83% | 9.35% | 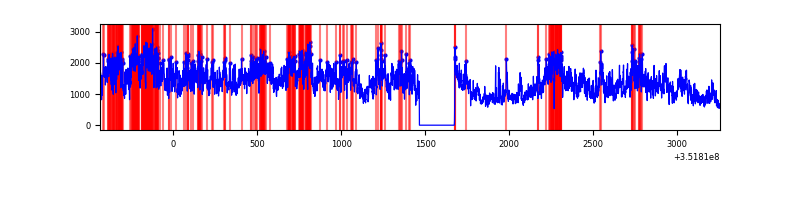 |
| D | 3693 | 3484 | 1030 | 1030 | 27.89% | 29.56% | 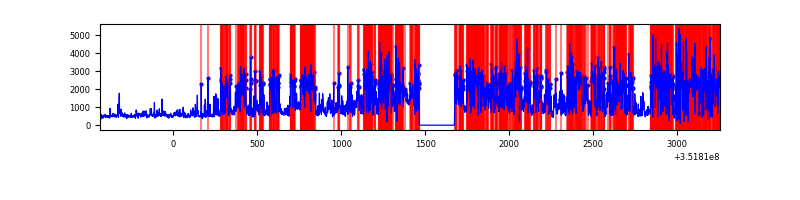 |
Top three noisy pixels from each quadrant. If the there are fewer than three noisy pixels in the level2.evt file, extra rows are filled as -1
| Pixel properties | Quadrant properties | ||||||
|---|---|---|---|---|---|---|---|
| Quadrant | DetID | PixID | Counts | Sigma | Mean | Median | Sigma |
| A | 13 | 254 | 6789 | 68.61 | 453 | 442 | 92.5 |
| A | 3 | 137 | 4381 | 42.58 | 453 | 442 | 92.5 |
| A | 0 | 13 | 4070 | 39.22 | 453 | 442 | 92.5 |
| B | 10 | 245 | 498247 | 5746.74 | 444 | 433 | 86.6 |
| B | 0 | 229 | 120491 | 1385.94 | 444 | 433 | 86.6 |
| B | 0 | 183 | 42215 | 482.33 | 444 | 433 | 86.6 |
| C | 3 | 233 | 3342476 | 35094.59 | 401 | 404 | 95.2 |
| C | 14 | 238 | 63947 | 667.26 | 401 | 404 | 95.2 |
| C | 2 | 114 | 8039 | 80.17 | 401 | 404 | 95.2 |
| D | 1 | 52 | 3310713 | 37919.7 | 357 | 347 | 87.3 |
| D | 8 | 195 | 260112 | 2975.57 | 357 | 347 | 87.3 |
| D | 2 | 250 | 35284 | 400.2 | 357 | 347 | 87.3 |
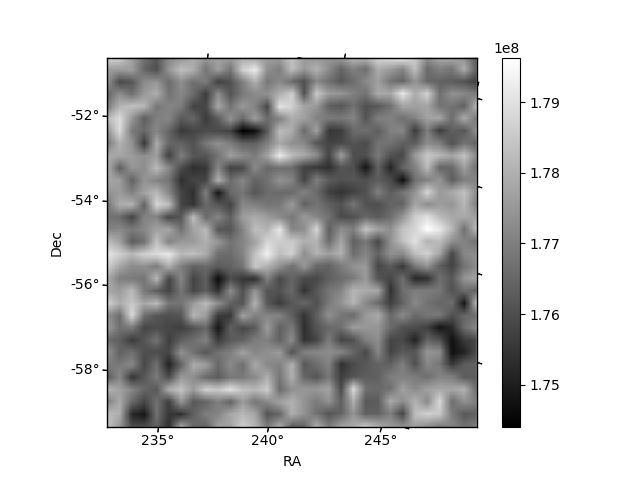
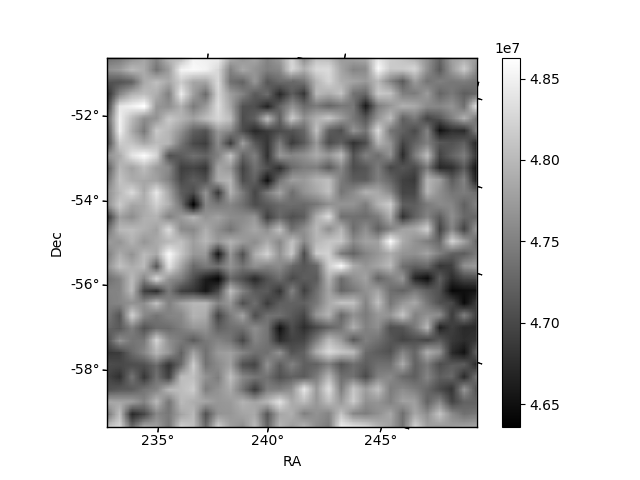
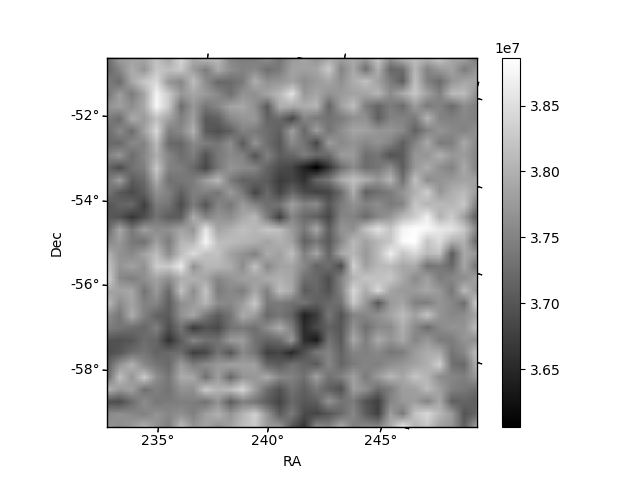
Histogram calculated using DETX and DETY for each event in the final _common_clean file
| Quadrant A | 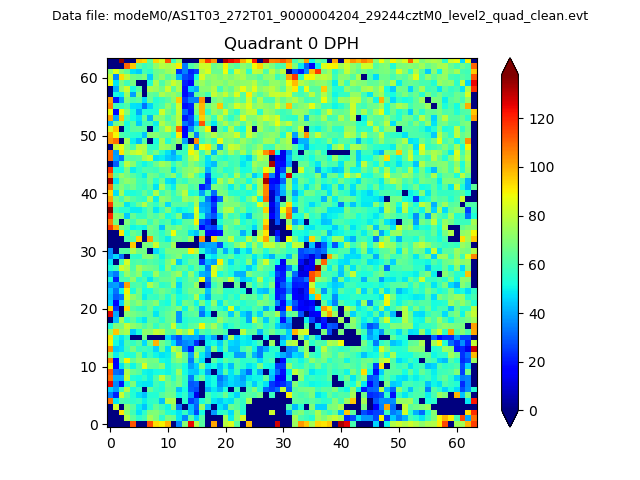 |
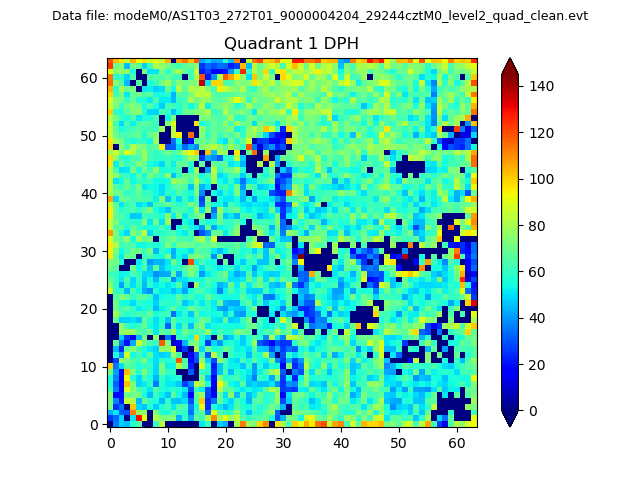 |
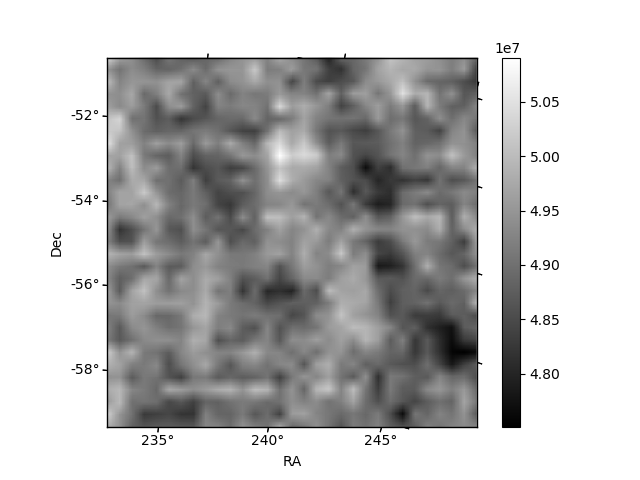
Quadrant B |
|---|---|---|---|
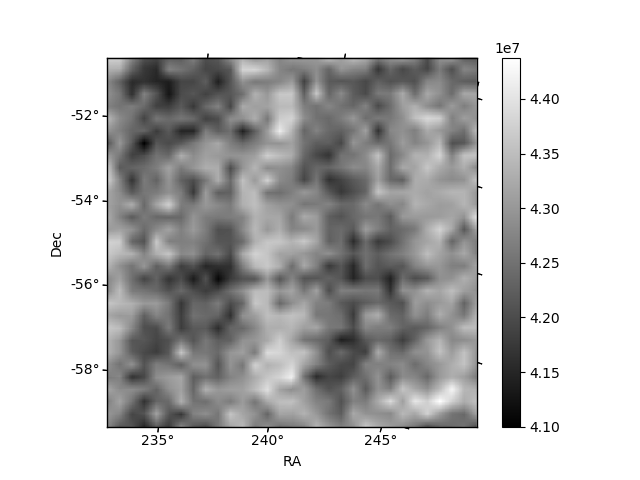
| Quadrant D | 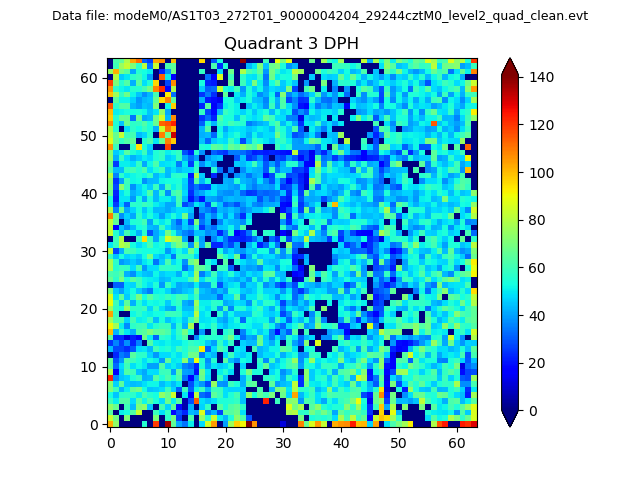 |
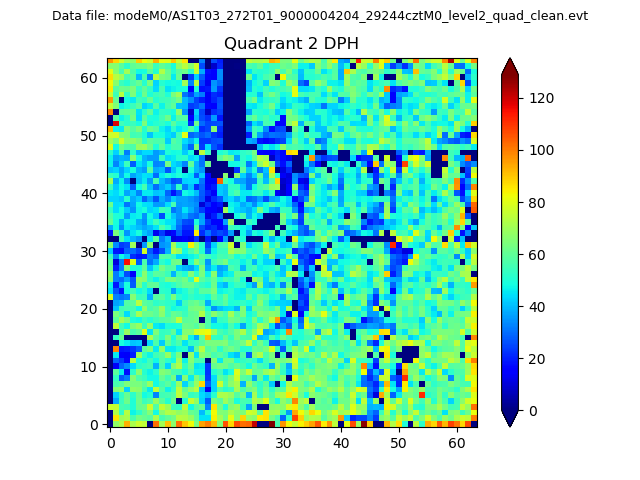 |
Quadrant C |
| Plot type | Count rate plots | Images |
|---|---|---|
| Comparison with Poisson distribution Blue bars denote a histogram of data divided into 1 sec bins. Red curve is a Poisson curve with rate = median count rate of data. |
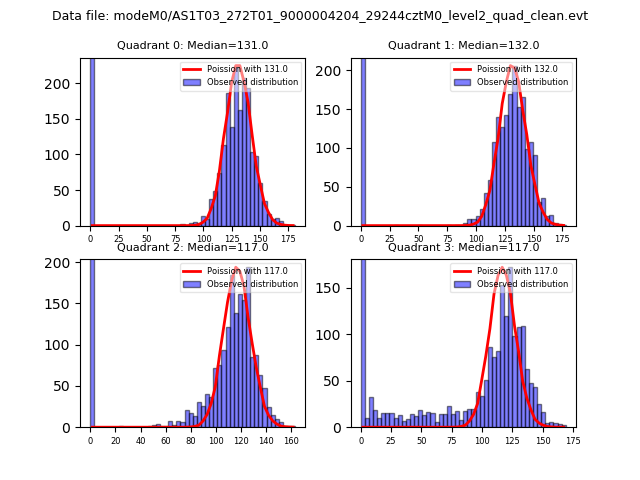 |
 |
| Quadrant-wise count rates Data is divided into 100 sec bins |
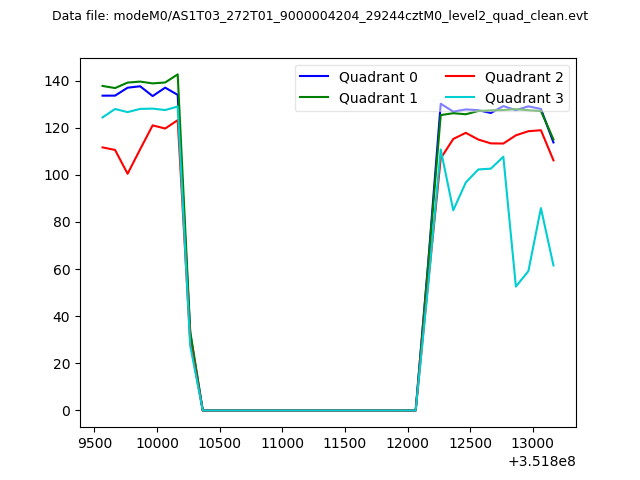 |
|
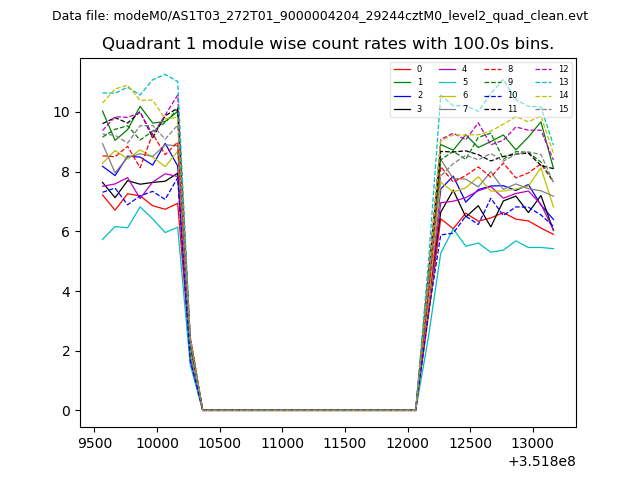
| Module-wise count rates for Quadrant A Data is divided into 100 sec bins |
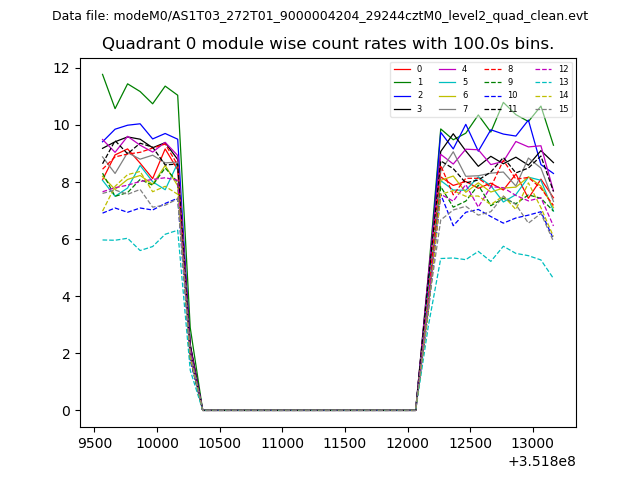 |
 |
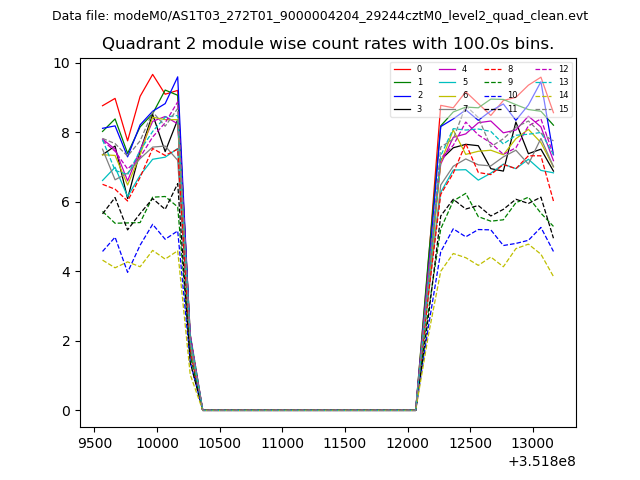
| Module-wise count rates for Quadrant B Data is divided into 100 sec bins |
 |
 |
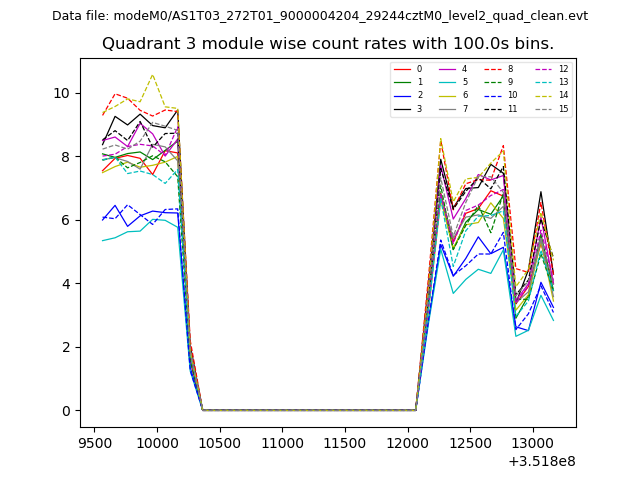
| Module-wise count rates for Quadrant C Data is divided into 100 sec bins |
 |
 |
| Module-wise count rates for Quadrant D Data is divided into 100 sec bins |
 |
 |
| Parameter | Plot |
|---|---|
| CZT HV Monitor | 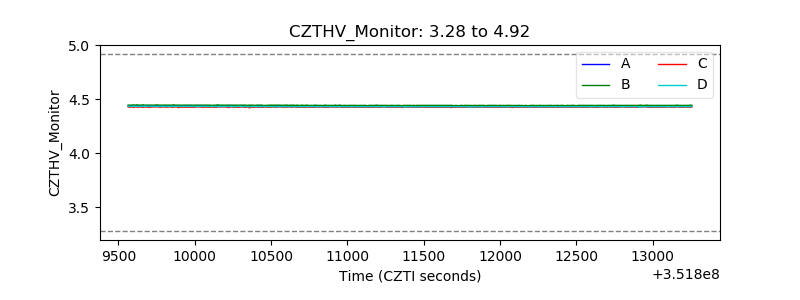 |
| D_VDD | 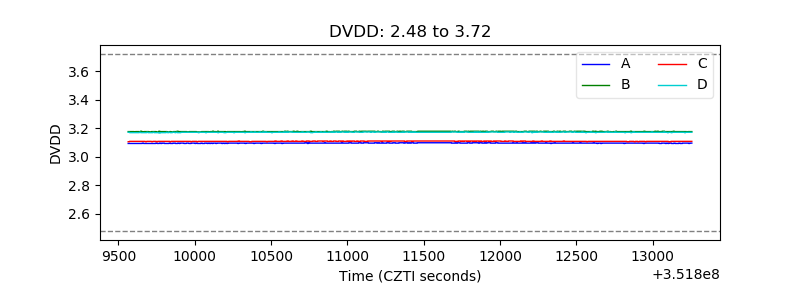 |
| Temperature 1 | 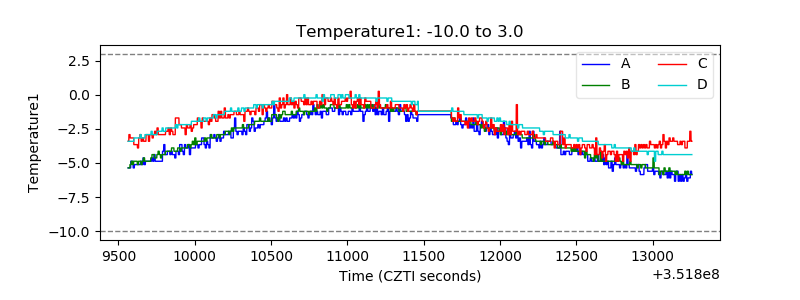 |
| Veto HV Monitor | 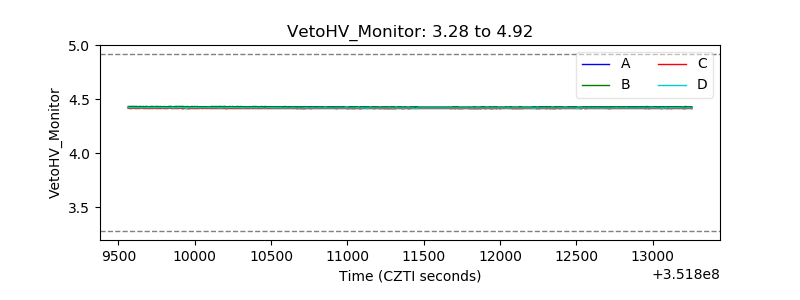 |
| Veto LLD | 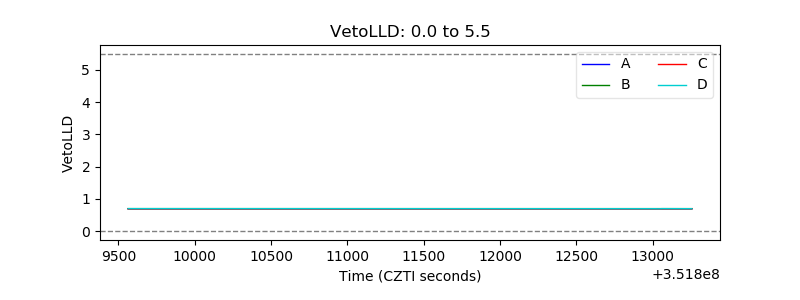 |
| Alpha Counter | 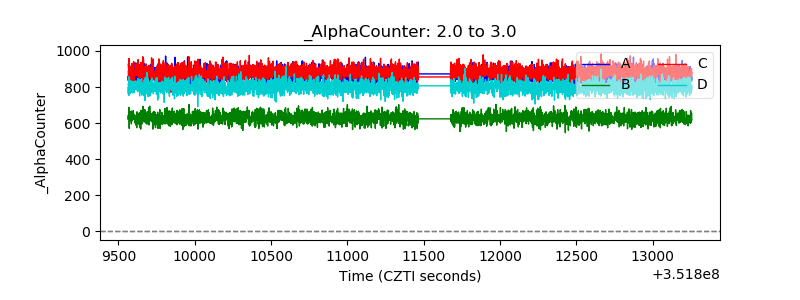 |
| _CPM_Rate | 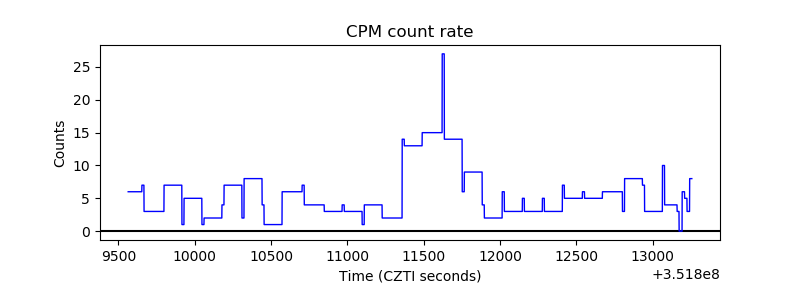 |
| CZT Counter | 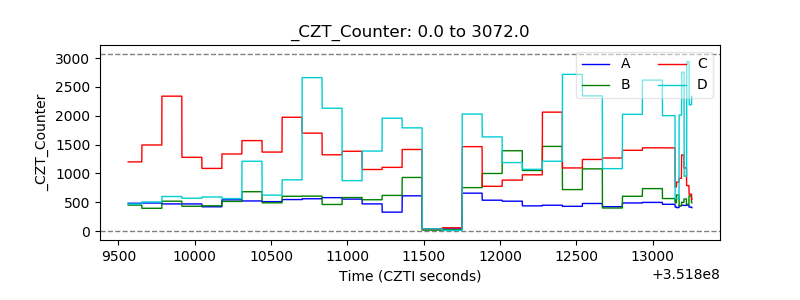 |
| +2.5 Volts monitor | 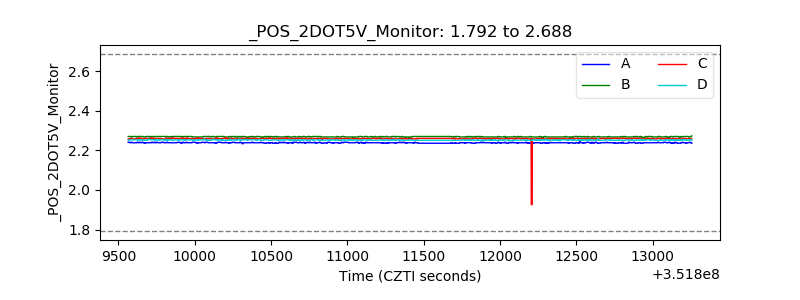 |
| +5 Volts monitor |  |
| _ROLL_ROT | 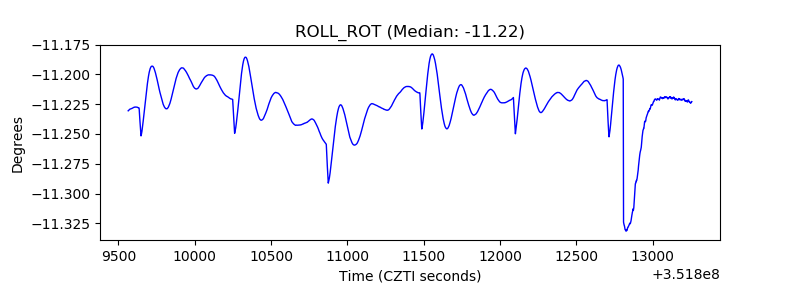 |
| _Roll_DEC | 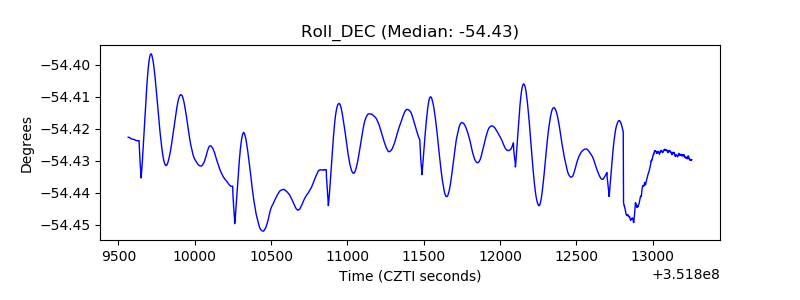 |
| _Roll_RA | 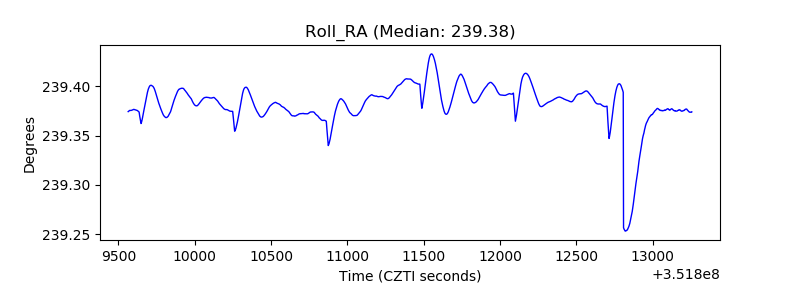 |
| Veto Counter | 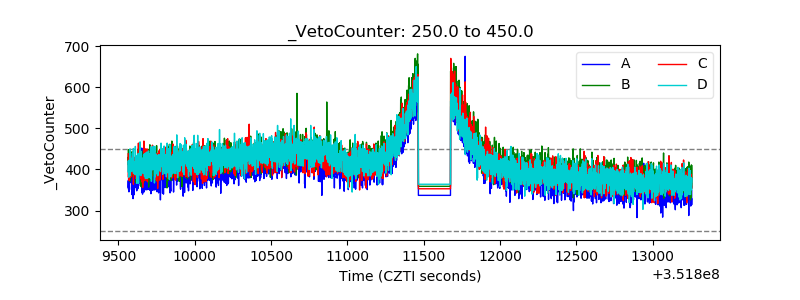 |