| Param | Original file | Final file |
|---|---|---|
| Filename | modeM0/AS1T03_272T01_9000004204_29245cztM0_level2.evt | modeM0/AS1T03_272T01_9000004204_29245cztM0_level2_quad_clean.evt |
| Size (bytes) | 909,812,160 | 102,804,480 |
| Size | 867.7 MB | 98.0 MB |
| Events in quadrant A | 3,469,394 | 704,929 |
| Events in quadrant B | 4,392,394 | 710,938 |
| Events in quadrant C | 9,714,880 | 632,546 |
| Events in quadrant D | 9,472,707 | 543,098 |
| Mode M9 | |||
|---|---|---|---|
| Quadrant | BADHDUFLAG | Total packets | Discarded packets |
| A | 0 | 4 | 0 |
| B | 0 | 4 | 0 |
| C | 0 | 4 | 0 |
| D | 0 | 4 | 0 |
| Mode SS | |||
|---|---|---|---|
| Quadrant | BADHDUFLAG | Total packets | Discarded packets |
| A | 0 | 150 | 0 |
| B | 0 | 150 | 0 |
| C | 0 | 150 | 0 |
| D | 0 | 150 | 0 |
| Mode M0 | |||
|---|---|---|---|
| Quadrant | BADHDUFLAG | Total packets | Discarded packets |
| A | 0 | 15236 | 1 |
| B | 0 | 17986 | 1 |
| C | 0 | 34182 | 1 |
| D | 0 | 33254 | 1 |
| Quadrant | Total seconds | Saturated seconds | Saturation percentage |
|---|---|---|---|
| A | 7492 | 29 | 0.387080% |
| B | 7492 | 146 | 1.948745% |
| C | 7492 | 1557 | 20.782168% |
| D | 7493 | 1993 | 26.598158% |
Noise dominated data is calculated using 1-second bins in cleaned event files. If a bin has >2000 counts, and if more than 50% of those come from <1% of pixels, then it is considered to be noise-dominated and hence unusable.
| Quadrant | # 1 sec bins | Bins with >0 counts | Bins with >2000 counts | High rate bins dominated by noise | Noise dominated (total time) | Noise dominated (detector-on time) | Marked lightcurve |
|---|---|---|---|---|---|---|---|
| A | 7882 | 7493 | 0 | 0 | 0.00% | 0.00% | 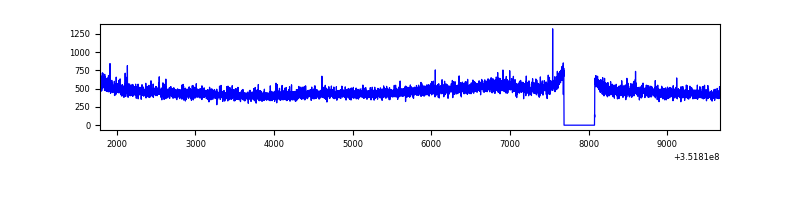 |
| B | 7882 | 7493 | 27 | 27 | 0.34% | 0.36% | 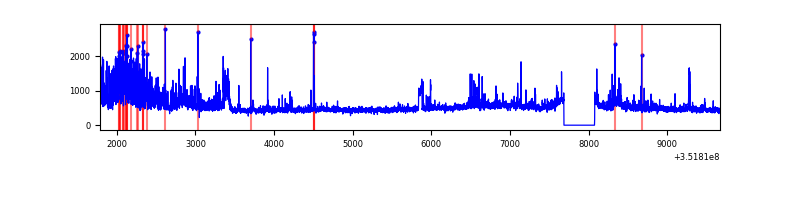 |
| C | 7882 | 7493 | 796 | 796 | 10.10% | 10.62% | 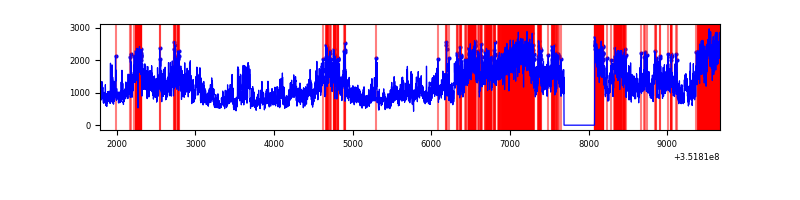 |
| D | 7883 | 7494 | 1772 | 1772 | 22.48% | 23.65% | 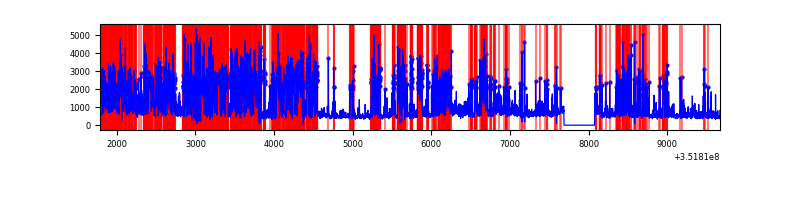 |
Top three noisy pixels from each quadrant. If the there are fewer than three noisy pixels in the level2.evt file, extra rows are filled as -1
| Pixel properties | Quadrant properties | ||||||
|---|---|---|---|---|---|---|---|
| Quadrant | DetID | PixID | Counts | Sigma | Mean | Median | Sigma |
| A | 13 | 254 | 16354 | 85.68 | 895 | 877 | 180.6 |
| A | 0 | 13 | 10388 | 52.65 | 895 | 877 | 180.6 |
| A | 3 | 137 | 8614 | 42.83 | 895 | 877 | 180.6 |
| B | 10 | 245 | 572415 | 3373.27 | 889 | 867 | 169.4 |
| B | 0 | 229 | 211037 | 1240.42 | 889 | 867 | 169.4 |
| B | 0 | 183 | 57816 | 336.11 | 889 | 867 | 169.4 |
| C | 3 | 233 | 6394576 | 33554.89 | 814 | 818 | 190.5 |
| C | 14 | 238 | 130805 | 682.18 | 814 | 818 | 190.5 |
| C | 2 | 114 | 16972 | 84.78 | 814 | 818 | 190.5 |
| D | 1 | 52 | 5901628 | 32680.85 | 750 | 729 | 180.6 |
| D | 8 | 195 | 369965 | 2044.93 | 750 | 729 | 180.6 |
| D | 13 | 153 | 160624 | 885.54 | 750 | 729 | 180.6 |
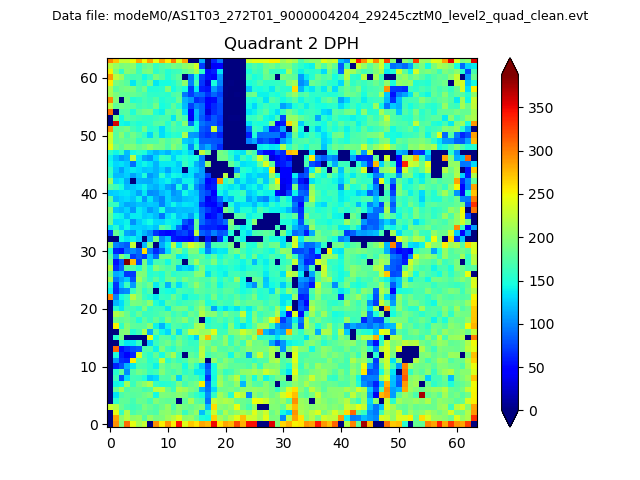
Histogram calculated using DETX and DETY for each event in the final _common_clean file
| Quadrant A |  |
 |
Quadrant B |
|---|---|---|---|
| Quadrant D | 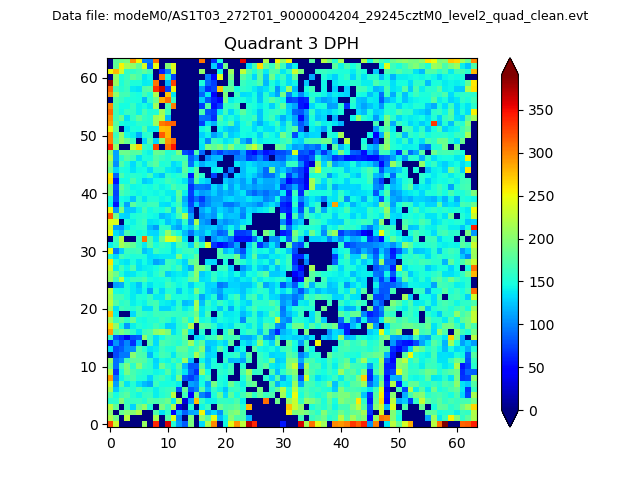 |
 |
Quadrant C |
| Plot type | Count rate plots | Images |
|---|---|---|
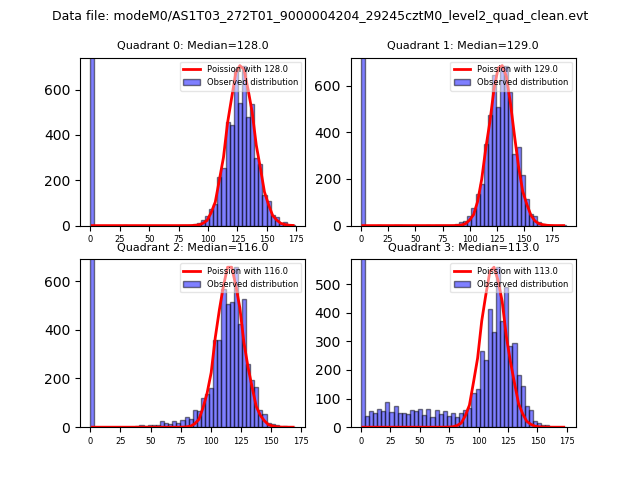
| Comparison with Poisson distribution Blue bars denote a histogram of data divided into 1 sec bins. Red curve is a Poisson curve with rate = median count rate of data. |
 |
 |
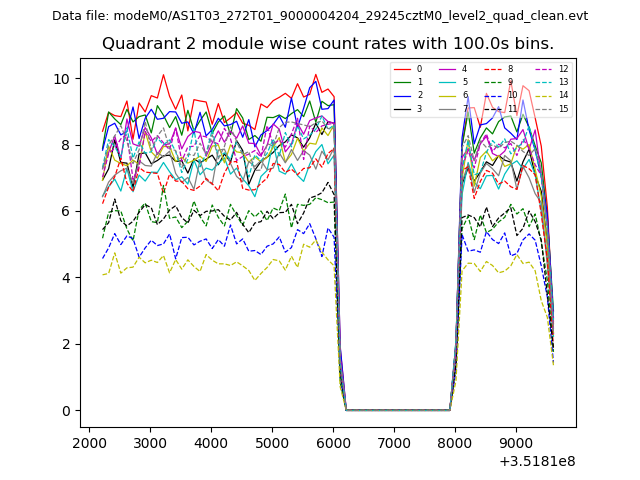
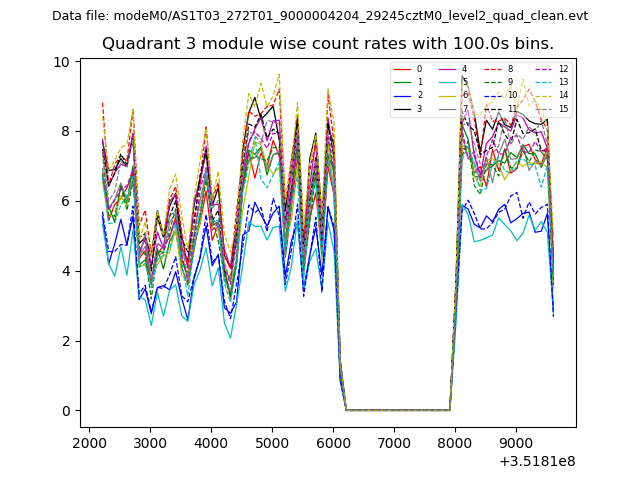
| Quadrant-wise count rates Data is divided into 100 sec bins |
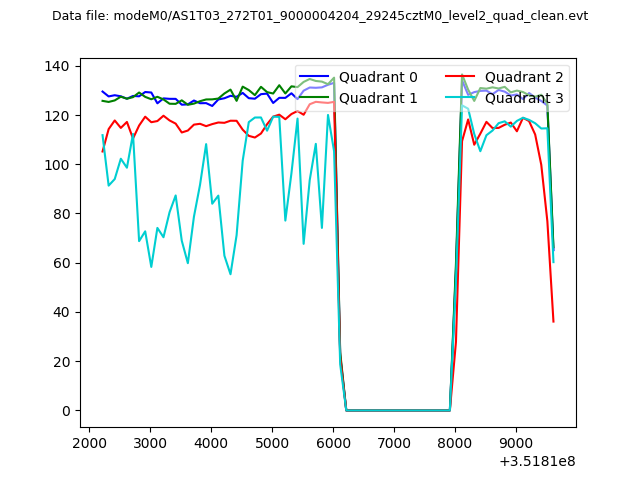 |
|
| Module-wise count rates for Quadrant A Data is divided into 100 sec bins |
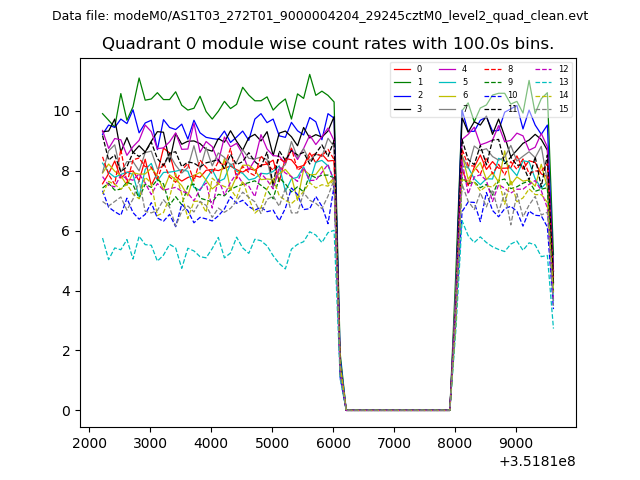 |
 |
| Module-wise count rates for Quadrant B Data is divided into 100 sec bins |
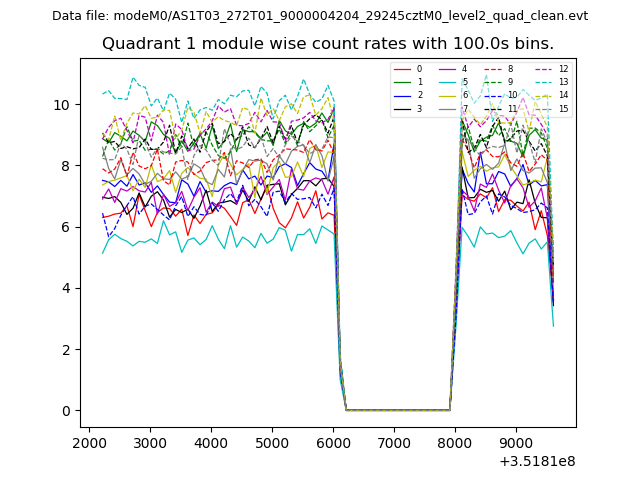 |
 |
| Module-wise count rates for Quadrant C Data is divided into 100 sec bins |
 |
 |
| Module-wise count rates for Quadrant D Data is divided into 100 sec bins |
 |
 |
| Parameter | Plot |
|---|---|
| CZT HV Monitor | 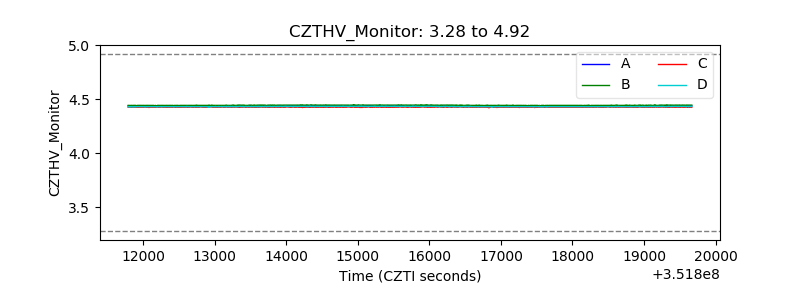 |
| D_VDD | 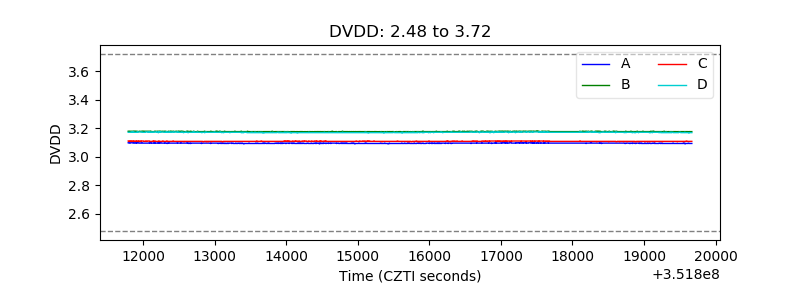 |
| Temperature 1 | 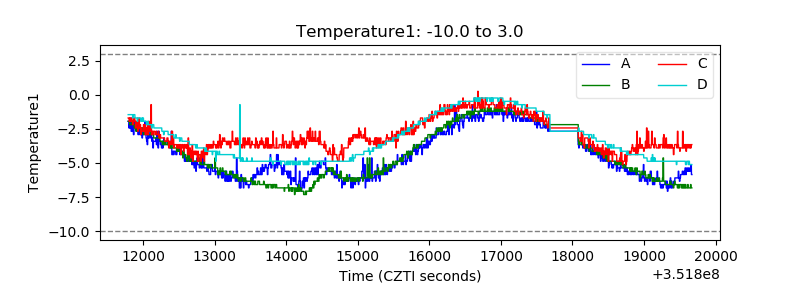 |
| Veto HV Monitor | 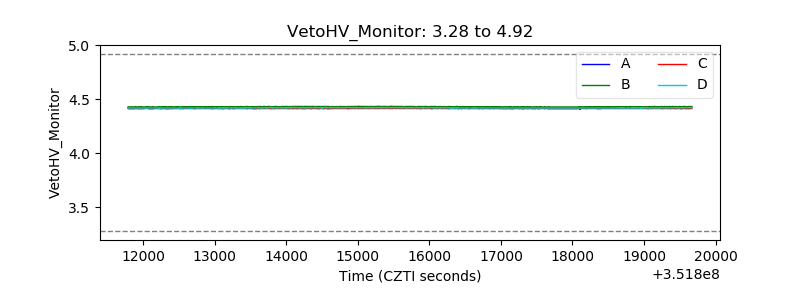 |
| Veto LLD | 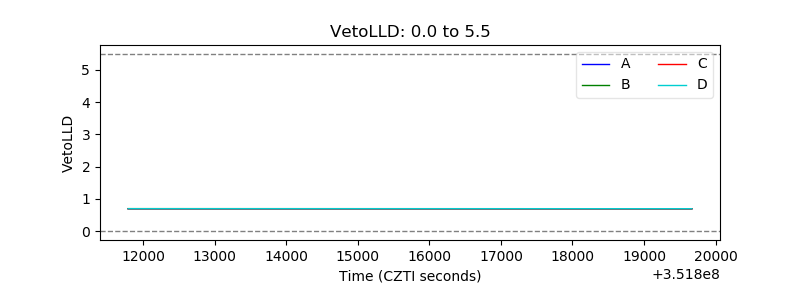 |
| Alpha Counter | 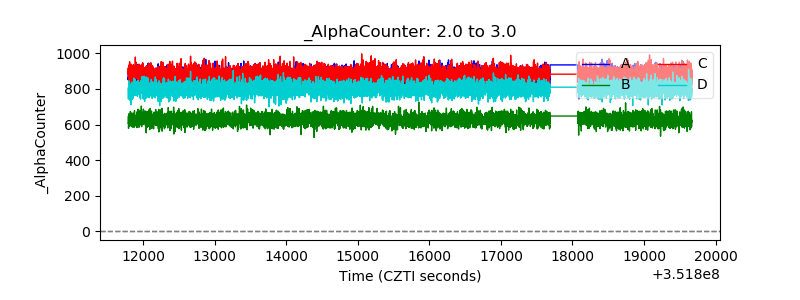 |
| _CPM_Rate | 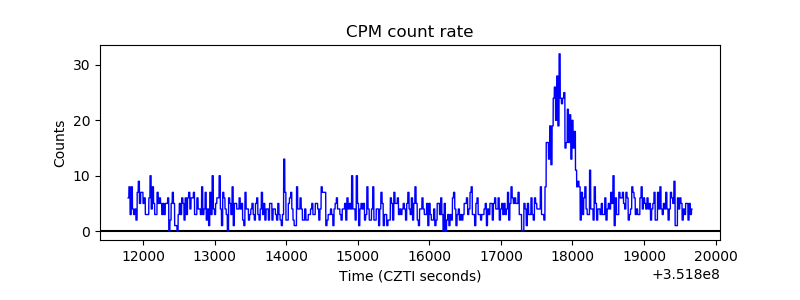 |
| CZT Counter | 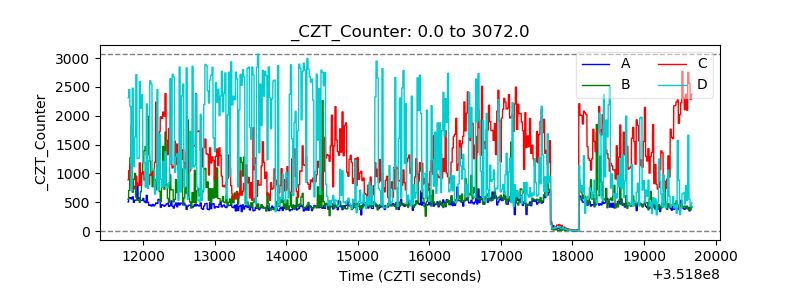 |
| +2.5 Volts monitor | 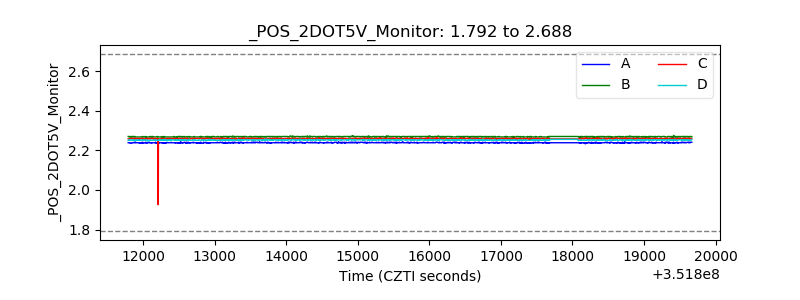 |
| +5 Volts monitor | 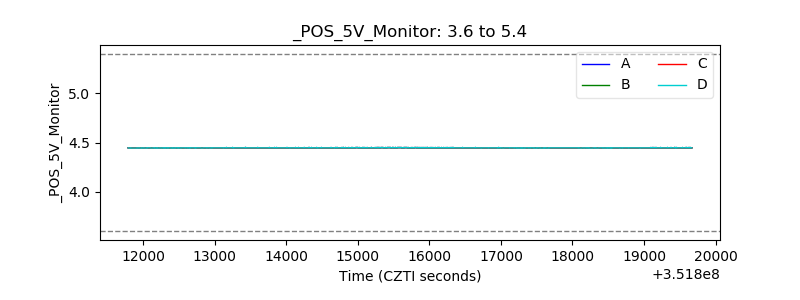 |
| _ROLL_ROT | 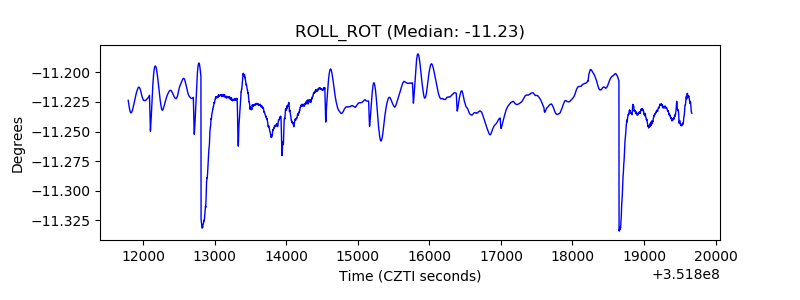 |
| _Roll_DEC | 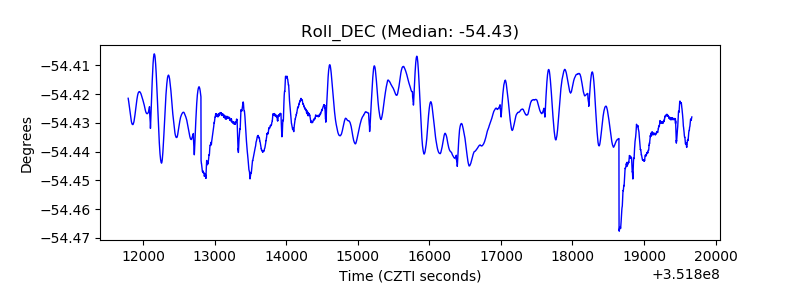 |
| _Roll_RA | 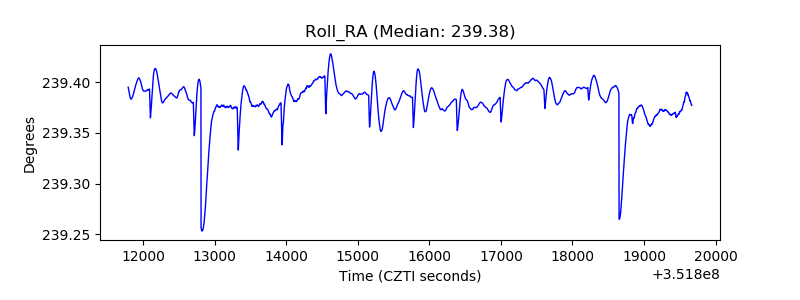 |
| Veto Counter | 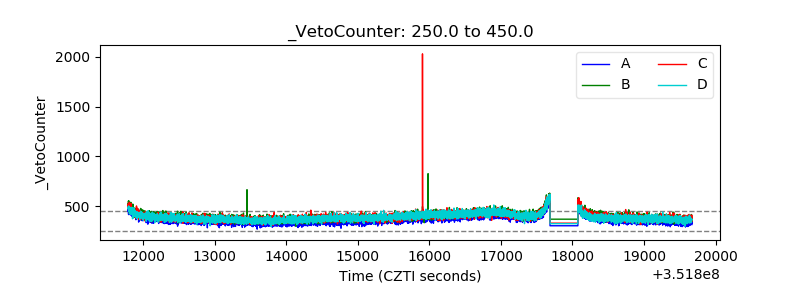 |