| Param | Original file | Final file |
|---|---|---|
| Filename | modeM0/AS1T03_272T01_9000004204_29249cztM0_level2.evt | modeM0/AS1T03_272T01_9000004204_29249cztM0_level2_quad_clean.evt |
| Size (bytes) | 2,328,963,840 | 236,592,000 |
| Size | 2.2 GB | 225.6 MB |
| Events in quadrant A | 8,533,828 | 1,620,234 |
| Events in quadrant B | 10,055,396 | 1,641,389 |
| Events in quadrant C | 35,806,892 | 1,162,649 |
| Events in quadrant D | 14,901,026 | 1,471,803 |
| Mode M9 | |||
|---|---|---|---|
| Quadrant | BADHDUFLAG | Total packets | Discarded packets |
| A | 0 | 21 | 0 |
| B | 0 | 22 | 0 |
| C | 0 | 22 | 0 |
| D | 0 | 22 | 0 |
| Mode SS | |||
|---|---|---|---|
| Quadrant | BADHDUFLAG | Total packets | Discarded packets |
| A | 0 | 374 | 0 |
| B | 0 | 374 | 0 |
| C | 0 | 374 | 0 |
| D | 0 | 374 | 0 |
| Mode M0 | |||
|---|---|---|---|
| Quadrant | BADHDUFLAG | Total packets | Discarded packets |
| A | 0 | 37259 | 4 |
| B | 0 | 41828 | 4 |
| C | 0 | 118937 | 4 |
| D | 0 | 56719 | 4 |
| Quadrant | Total seconds | Saturated seconds | Saturation percentage |
|---|---|---|---|
| A | 18362 | 70 | 0.381222% |
| B | 18362 | 299 | 1.628363% |
| C | 18362 | 13434 | 73.161965% |
| D | 18362 | 1393 | 7.586320% |
Noise dominated data is calculated using 1-second bins in cleaned event files. If a bin has >2000 counts, and if more than 50% of those come from <1% of pixels, then it is considered to be noise-dominated and hence unusable.
| Quadrant | # 1 sec bins | Bins with >0 counts | Bins with >2000 counts | High rate bins dominated by noise | Noise dominated (total time) | Noise dominated (detector-on time) | Marked lightcurve |
|---|---|---|---|---|---|---|---|
| A | 20357 | 18365 | 0 | 0 | 0.00% | 0.00% | 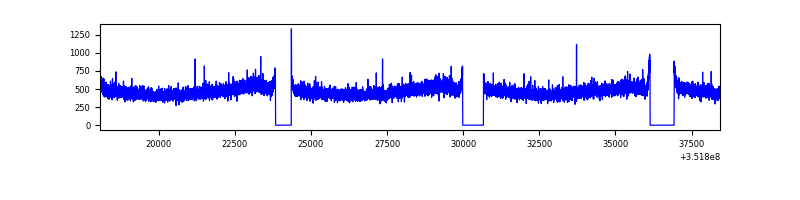 |
| B | 20357 | 18365 | 66 | 66 | 0.32% | 0.36% | 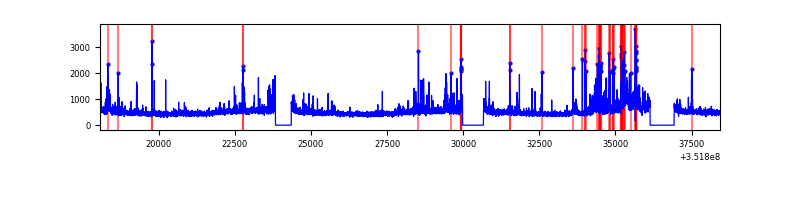 |
| C | 20357 | 18365 | 9919 | 9919 | 48.73% | 54.01% | 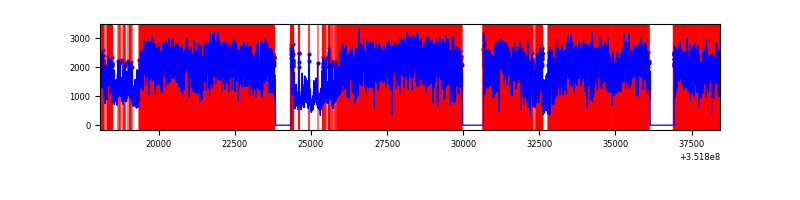 |
| D | 20357 | 18365 | 1007 | 1007 | 4.95% | 5.48% | 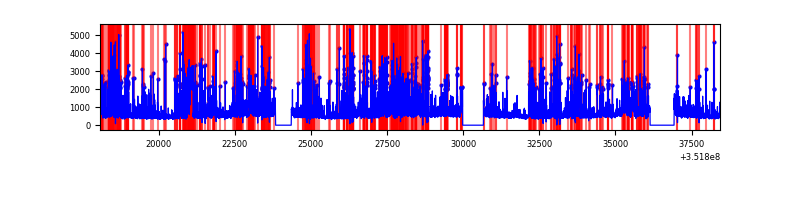 |
Top three noisy pixels from each quadrant. If the there are fewer than three noisy pixels in the level2.evt file, extra rows are filled as -1
| Pixel properties | Quadrant properties | ||||||
|---|---|---|---|---|---|---|---|
| Quadrant | DetID | PixID | Counts | Sigma | Mean | Median | Sigma |
| A | 13 | 254 | 36593 | 78.23 | 2203 | 2158 | 440.2 |
| A | 0 | 13 | 23959 | 49.53 | 2203 | 2158 | 440.2 |
| A | 3 | 137 | 21658 | 44.3 | 2203 | 2158 | 440.2 |
| B | 10 | 245 | 642849 | 1549.38 | 2185 | 2125 | 413.5 |
| B | 0 | 229 | 458032 | 1102.46 | 2185 | 2125 | 413.5 |
| B | 0 | 183 | 149715 | 356.9 | 2185 | 2125 | 413.5 |
| C | 3 | 233 | 28760833 | 77596.54 | 1596 | 1604 | 370.6 |
| C | 14 | 238 | 461462 | 1240.76 | 1596 | 1604 | 370.6 |
| C | 14 | 254 | 330835 | 888.31 | 1596 | 1604 | 370.6 |
| D | 1 | 52 | 4615878 | 9299.83 | 2079 | 2022 | 496.1 |
| D | 7 | 80 | 870813 | 1751.16 | 2079 | 2022 | 496.1 |
| D | 8 | 195 | 564748 | 1134.25 | 2079 | 2022 | 496.1 |
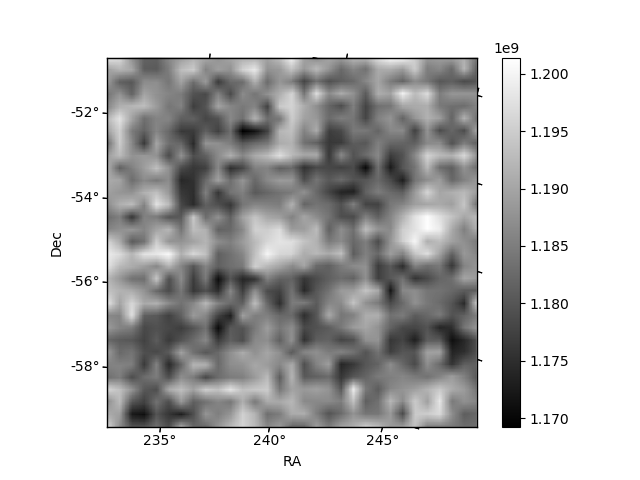
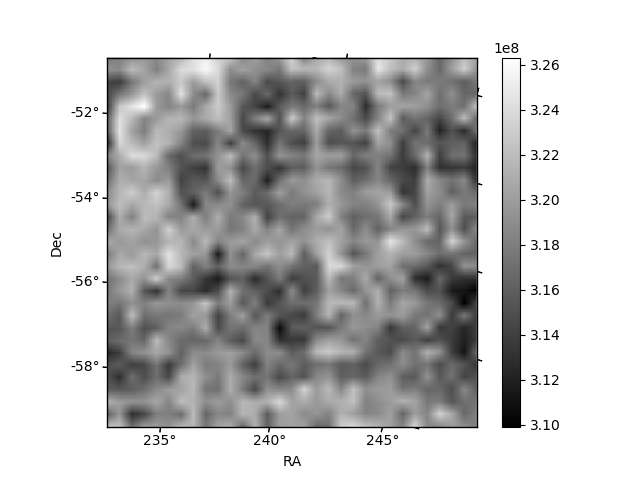
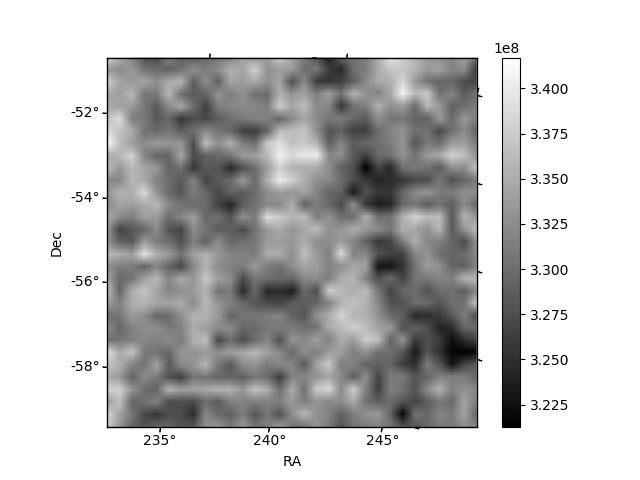
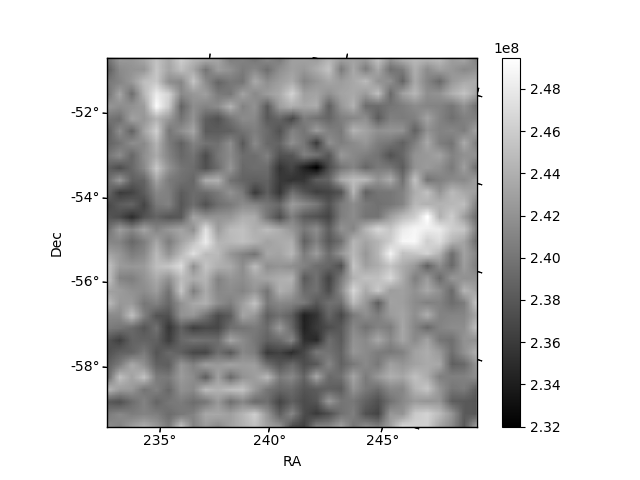
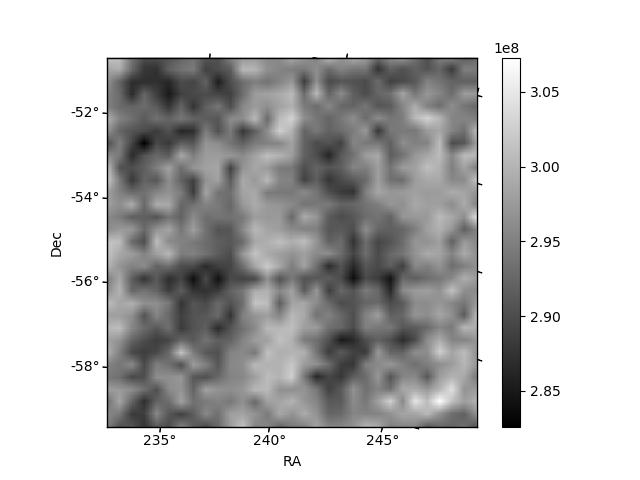
Histogram calculated using DETX and DETY for each event in the final _common_clean file
| Quadrant A | 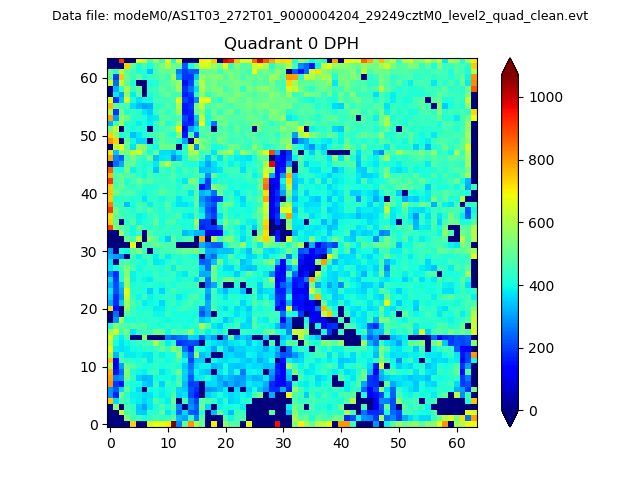 |
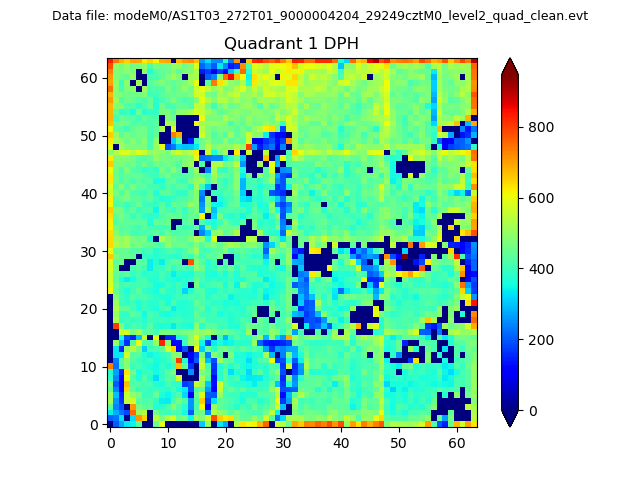 |
Quadrant B |
|---|---|---|---|
| Quadrant D | 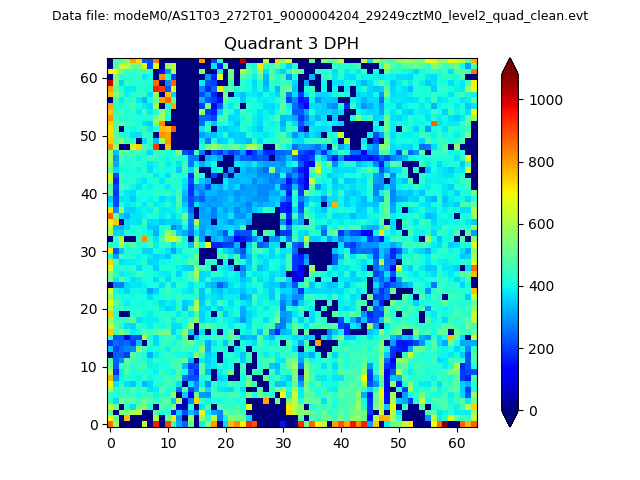 |
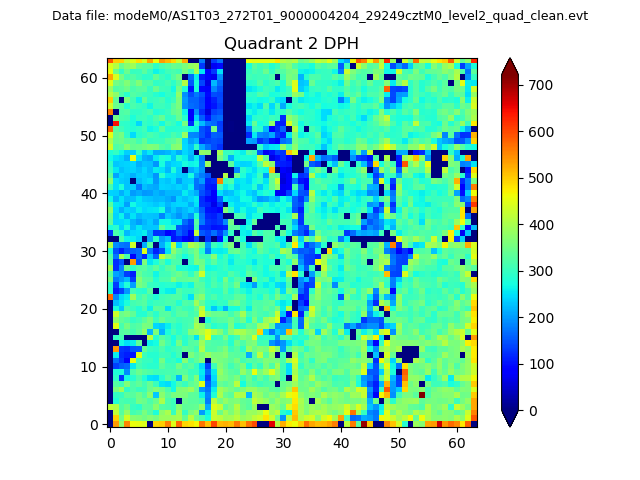 |
Quadrant C |
| Plot type | Count rate plots | Images |
|---|---|---|
| Comparison with Poisson distribution Blue bars denote a histogram of data divided into 1 sec bins. Red curve is a Poisson curve with rate = median count rate of data. |
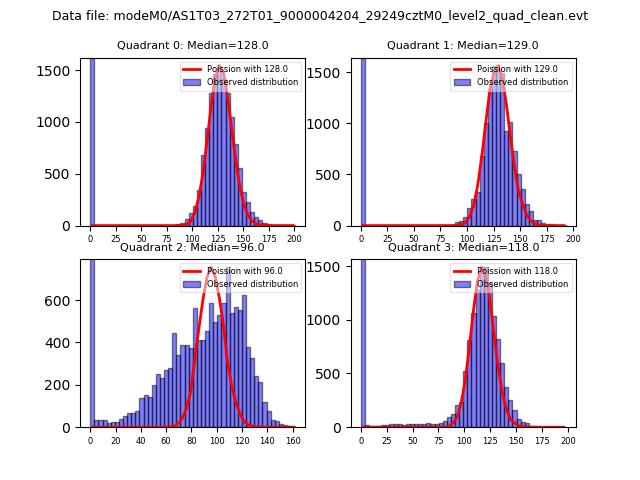 |
 |
| Quadrant-wise count rates Data is divided into 100 sec bins |
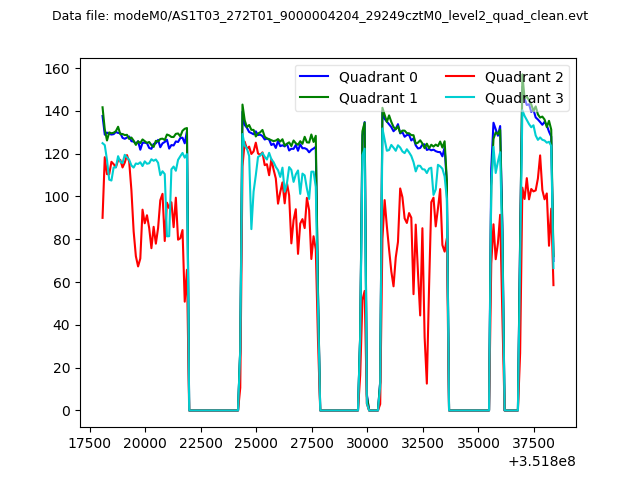 |
|
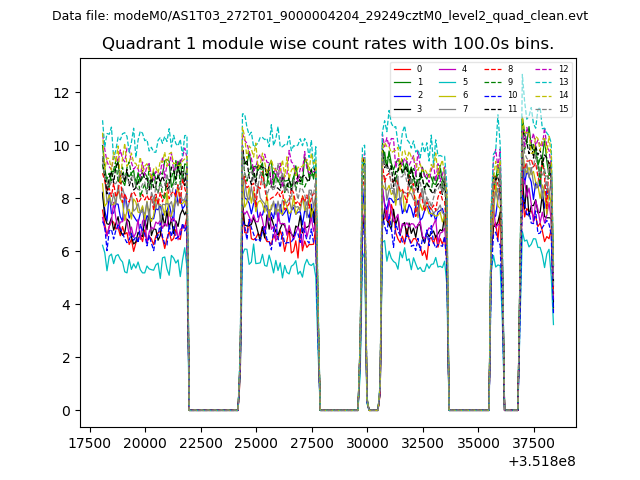
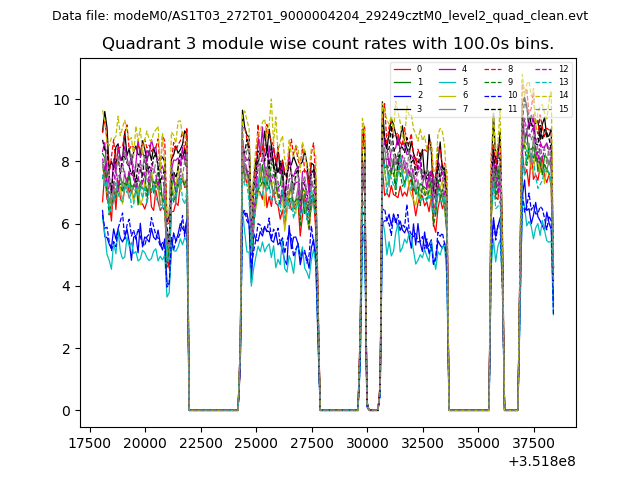
| Module-wise count rates for Quadrant A Data is divided into 100 sec bins |
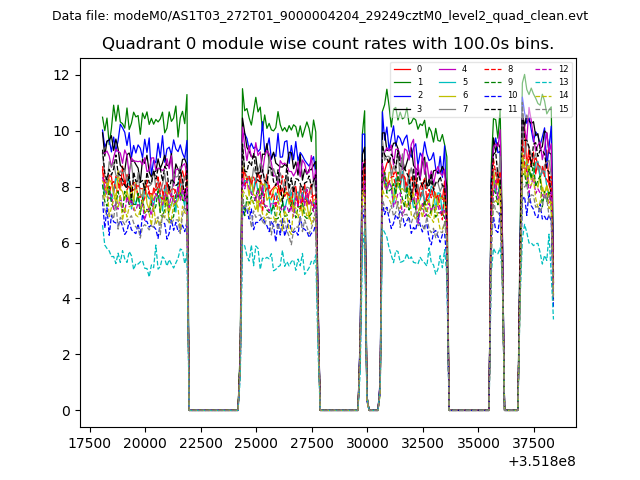 |
 |
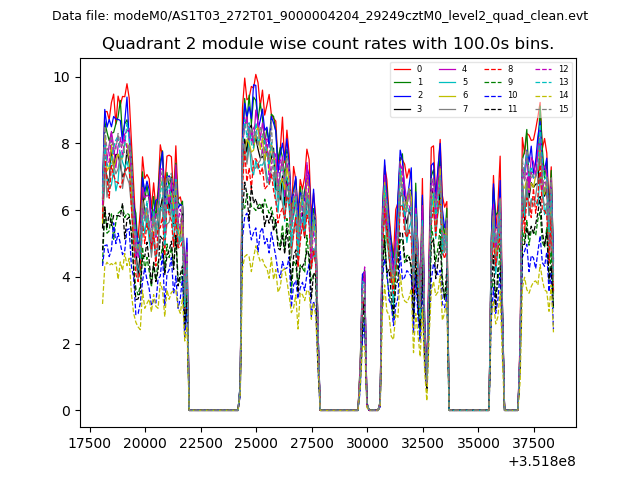
| Module-wise count rates for Quadrant B Data is divided into 100 sec bins |
 |
 |
| Module-wise count rates for Quadrant C Data is divided into 100 sec bins |
 |
 |
| Module-wise count rates for Quadrant D Data is divided into 100 sec bins |
 |
 |
| Parameter | Plot |
|---|---|
| CZT HV Monitor | 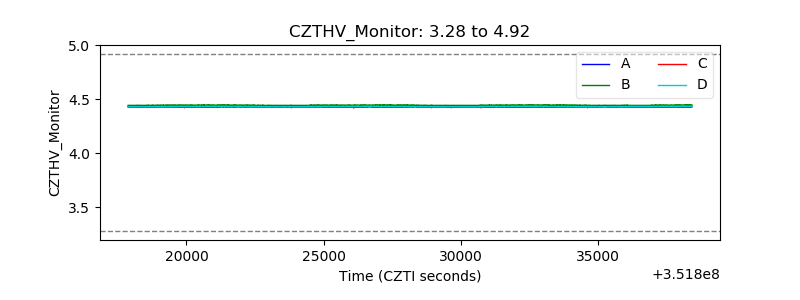 |
| D_VDD | 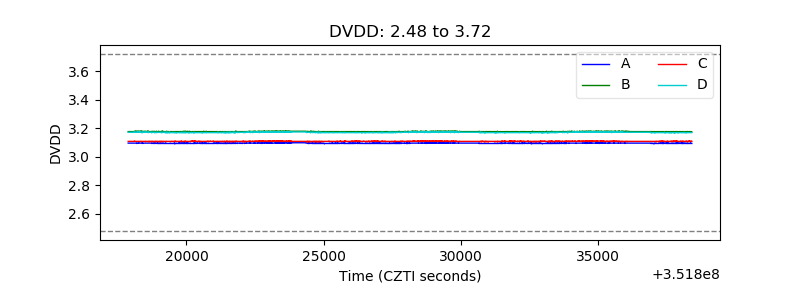 |
| Temperature 1 | 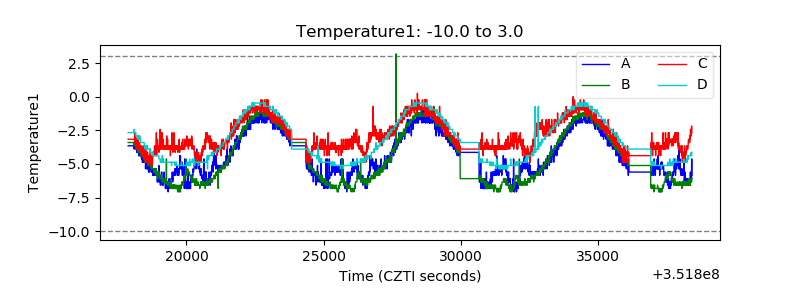 |
| Veto HV Monitor | 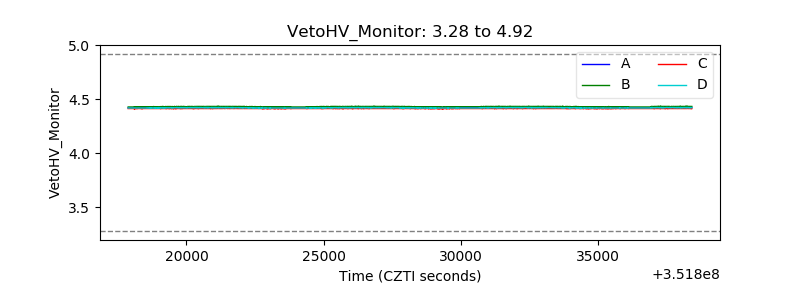 |
| Veto LLD | 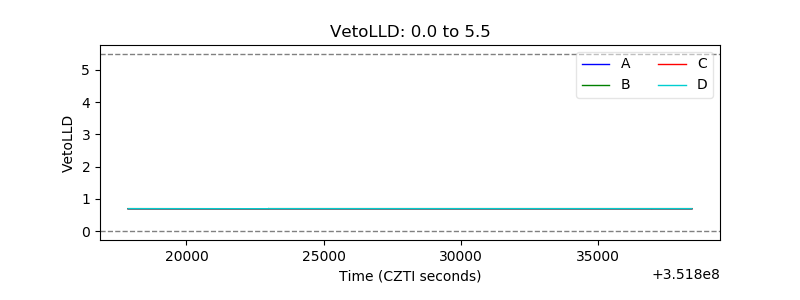 |
| Alpha Counter | 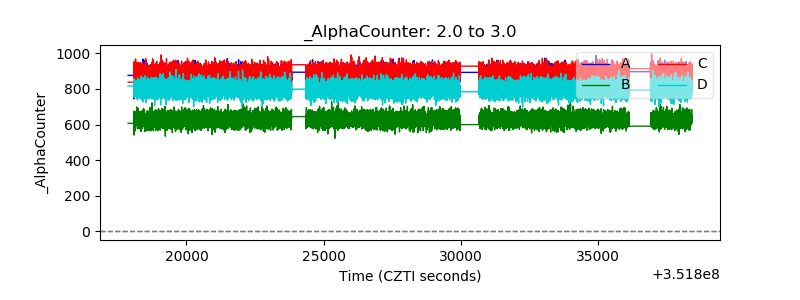 |
| _CPM_Rate | 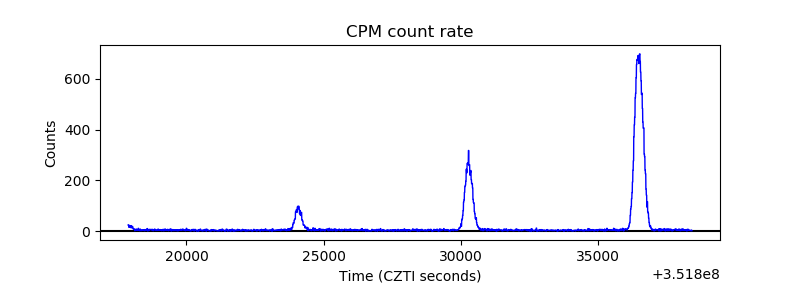 |
| CZT Counter | 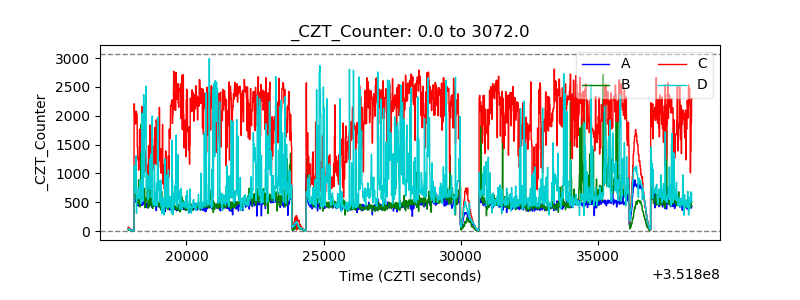 |
| +2.5 Volts monitor |  |
| +5 Volts monitor |  |
| _ROLL_ROT | 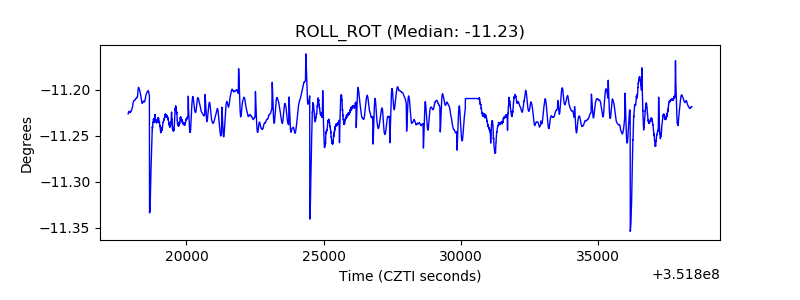 |
| _Roll_DEC | 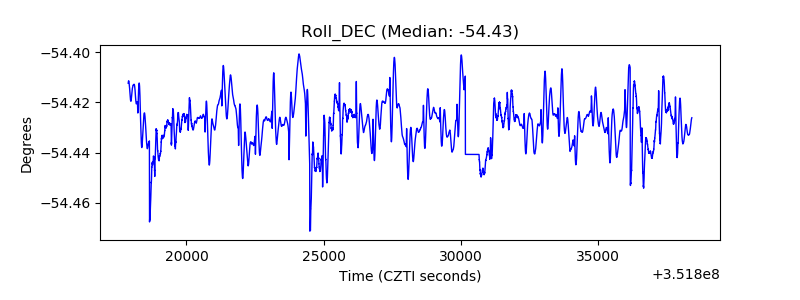 |
| _Roll_RA | 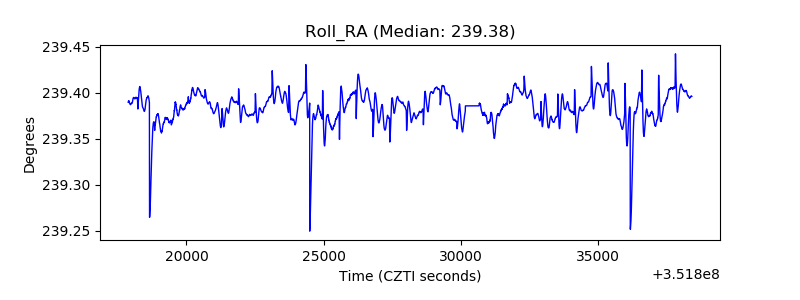 |
| Veto Counter | 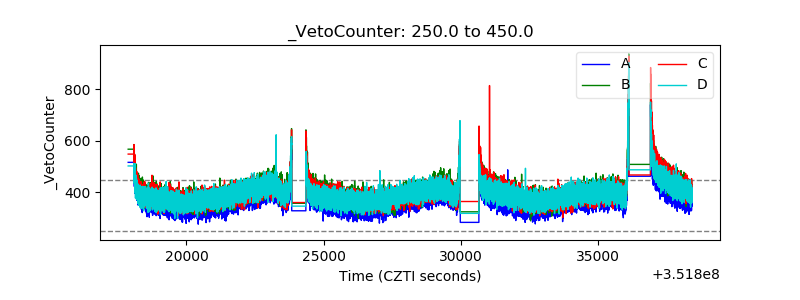 |