| Param | Original file | Final file |
|---|---|---|
| Filename | modeM0/AS1A10_045T08_9000004208cztM0_level2.fits | modeM0/AS1A10_045T08_9000004208cztM0_level2_quad_clean.evt |
| Size (bytes) | 562,763,520 | 464,820,480 |
| Size | 536.7 MB | 443.3 MB |
| Events in quadrant A | 3,564,438 | 2,672,606 |
| Events in quadrant B | 3,353,569 | 2,686,224 |
| Events in quadrant C | 3,221,062 | 2,436,493 |
| Events in quadrant D | 2,966,662 | 2,348,051 |
| Mode SS | |||
|---|---|---|---|
| Quadrant | BADHDUFLAG | Total packets | Discarded packets |
| A | 0 | 1168 | 0 |
| B | 0 | 1174 | 0 |
| C | 0 | 1168 | 0 |
| D | 0 | 1170 | 0 |
| Mode M0 | |||
|---|---|---|---|
| Quadrant | BADHDUFLAG | Total packets | Discarded packets |
| A | 0 | 120513 | 0 |
| B | 0 | 137329 | 0 |
| C | 0 | 206992 | 0 |
| D | 0 | 175872 | 0 |
| Mode M9 | |||
|---|---|---|---|
| Quadrant | BADHDUFLAG | Total packets | Discarded packets |
| A | 0 | 94 | 0 |
| B | 0 | 93 | 0 |
| C | 0 | 94 | 0 |
| D | 0 | 95 | 0 |
| Quadrant | Total seconds | Saturated seconds | Saturation percentage |
|---|---|---|---|
| A | 57339 | 671 | 1.170233% |
| B | 57367 | 1897 | 3.306779% |
| C | 57300 | 7556 | 13.186736% |
| D | 57303 | 3821 | 6.668063% |
Noise dominated data is calculated using 1-second bins in cleaned event files. If a bin has >2000 counts, and if more than 50% of those come from <1% of pixels, then it is considered to be noise-dominated and hence unusable.
| Quadrant | # 1 sec bins | Bins with >0 counts | Bins with >2000 counts | High rate bins dominated by noise | Noise dominated (total time) | Noise dominated (detector-on time) | Marked lightcurve |
|---|---|---|---|---|---|---|---|
| A | 65561 | 56461 | 0 | 0 | 0.00% | 0.00% |  |
| B | 65561 | 56459 | 0 | 0 | 0.00% | 0.00% |  |
| C | 65560 | 56417 | 0 | 0 | 0.00% | 0.00% |  |
| D | 65560 | 56435 | 0 | 0 | 0.00% | 0.00% |  |
Top three noisy pixels from each quadrant. If the there are fewer than three noisy pixels in the level2.evt file, extra rows are filled as -1
| Pixel properties | Quadrant properties | ||||||
|---|---|---|---|---|---|---|---|
| Quadrant | DetID | PixID | Counts | Sigma | Mean | Median | Sigma |
| A | 0 | 29 | 2929 | 9.12 | 927 | 868 | 226.0 |
| A | 7 | 110 | 2820 | 8.64 | 927 | 868 | 226.0 |
| A | 0 | 30 | 2577 | 7.56 | 927 | 868 | 226.0 |
| B | 2 | 9 | 2781 | 10.96 | 887 | 846 | 176.6 |
| B | 2 | 8 | 2258 | 7.99 | 887 | 846 | 176.6 |
| B | 3 | 17 | 2225 | 7.81 | 887 | 846 | 176.6 |
| C | 12 | 241 | 2251 | 6.75 | 851 | 796 | 215.6 |
| C | 3 | 126 | 2174 | 6.39 | 851 | 796 | 215.6 |
| C | 3 | 187 | 2127 | 6.17 | 851 | 796 | 215.6 |
| D | 15 | 46 | 2195 | 6.33 | 846 | 772 | 224.8 |
| D | 3 | 14 | 2140 | 6.09 | 846 | 772 | 224.8 |
| D | 10 | 189 | 2118 | 5.99 | 846 | 772 | 224.8 |
Histogram calculated using DETX and DETY for each event in the final _common_clean file
| Quadrant A | 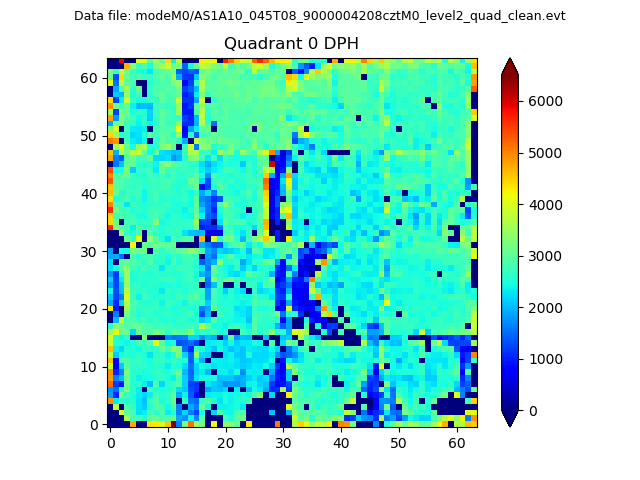 |
 |
Quadrant B |
|---|---|---|---|
| Quadrant D | 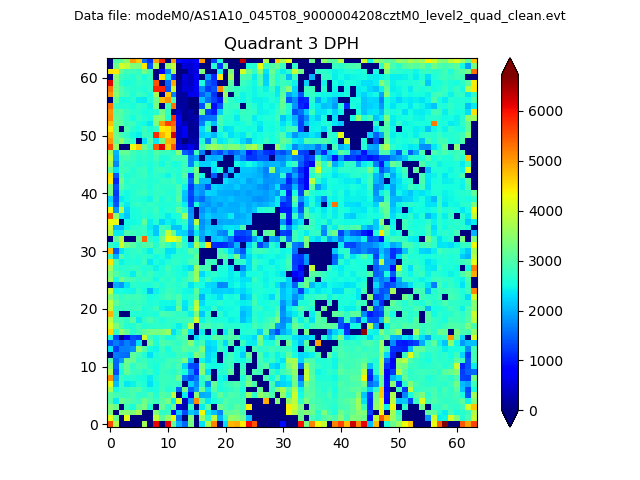 |
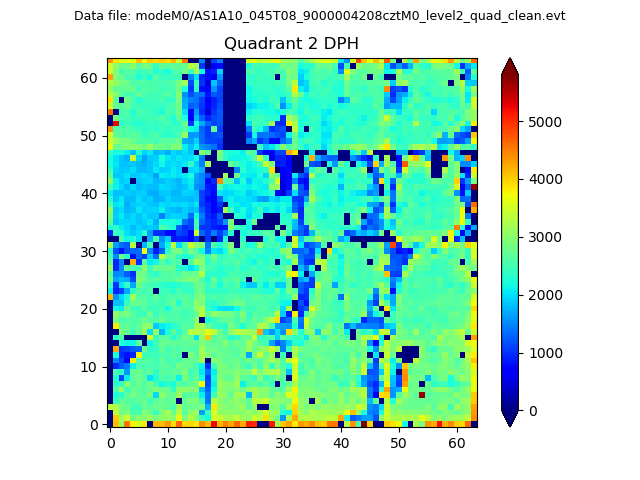 |
Quadrant C |
| Plot type | Count rate plots | Images |
|---|---|---|
| Comparison with Poisson distribution Blue bars denote a histogram of data divided into 1 sec bins. Red curve is a Poisson curve with rate = median count rate of data. |
 |
 |
| Quadrant-wise count rates Data is divided into 100 sec bins |
 |
|
| Module-wise count rates for Quadrant A Data is divided into 100 sec bins |
 |
 |
| Module-wise count rates for Quadrant B Data is divided into 100 sec bins |
 |
 |
| Module-wise count rates for Quadrant C Data is divided into 100 sec bins |
 |
 |
| Module-wise count rates for Quadrant D Data is divided into 100 sec bins |
 |
 |
| Parameter | Plot |
|---|---|
| CZT HV Monitor |  |
| D_VDD |  |
| Temperature 1 |  |
| Veto HV Monitor |  |
| Veto LLD |  |
| Alpha Counter |  |
| _CPM_Rate |  |
| CZT Counter |  |
| +2.5 Volts monitor |  |
| +5 Volts monitor |  |
| _ROLL_ROT |  |
| _Roll_DEC |  |
| _Roll_RA |  |
| Veto Counter |  |