| Param | Original file | Final file |
|---|---|---|
| Filename | modeM0/AS1A10_045T08_9000004208_29255cztM0_level2.evt | modeM0/AS1A10_045T08_9000004208_29255cztM0_level2_quad_clean.evt |
| Size (bytes) | 234,221,760 | 9,673,920 |
| Size | 223.4 MB | 9.2 MB |
| Events in quadrant A | 1,083,850 | 42,964 |
| Events in quadrant B | 1,189,909 | 44,064 |
| Events in quadrant C | 3,371,920 | 31,437 |
| Events in quadrant D | 1,323,856 | 42,554 |
| Mode SS | |||
|---|---|---|---|
| Quadrant | BADHDUFLAG | Total packets | Discarded packets |
| A | 0 | 38 | 0 |
| B | 0 | 38 | 0 |
| C | 0 | 38 | 0 |
| D | 0 | 38 | 0 |
| Mode M0 | |||
|---|---|---|---|
| Quadrant | BADHDUFLAG | Total packets | Discarded packets |
| A | 0 | 4324 | 1 |
| B | 0 | 4756 | 2 |
| C | 0 | 11235 | 1 |
| D | 0 | 5226 | 1 |
| Mode M9 | |||
|---|---|---|---|
| Quadrant | BADHDUFLAG | Total packets | Discarded packets |
| A | 0 | 12 | 0 |
| B | 0 | 12 | 0 |
| C | 0 | 12 | 0 |
| D | 0 | 12 | 0 |
| Quadrant | Total seconds | Saturated seconds | Saturation percentage |
|---|---|---|---|
| A | 1789 | 102 | 5.701509% |
| B | 1788 | 119 | 6.655481% |
| C | 1788 | 1470 | 82.214765% |
| D | 1788 | 136 | 7.606264% |
Noise dominated data is calculated using 1-second bins in cleaned event files. If a bin has >2000 counts, and if more than 50% of those come from <1% of pixels, then it is considered to be noise-dominated and hence unusable.
| Quadrant | # 1 sec bins | Bins with >0 counts | Bins with >2000 counts | High rate bins dominated by noise | Noise dominated (total time) | Noise dominated (detector-on time) | Marked lightcurve |
|---|---|---|---|---|---|---|---|
| A | 3029 | 1790 | 0 | 0 | 0.00% | 0.00% | 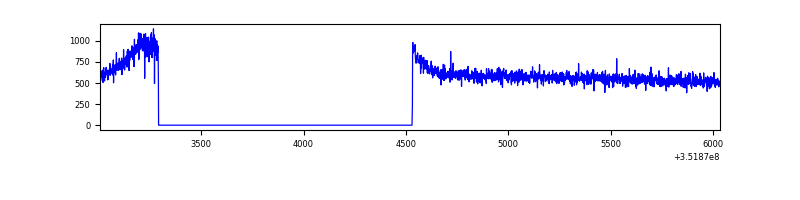 |
| B | 3028 | 1789 | 0 | 0 | 0.00% | 0.00% | 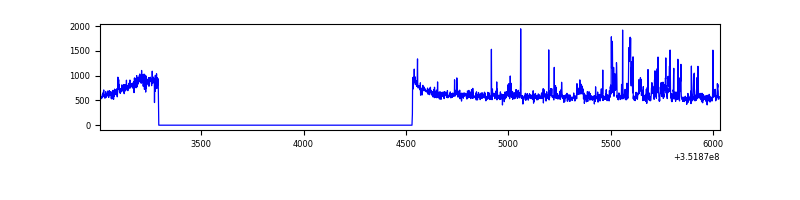 |
| C | 3028 | 1789 | 719 | 719 | 23.75% | 40.19% | 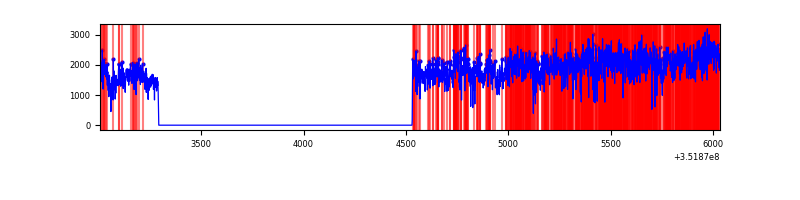 |
| D | 3028 | 1789 | 17 | 17 | 0.56% | 0.95% | 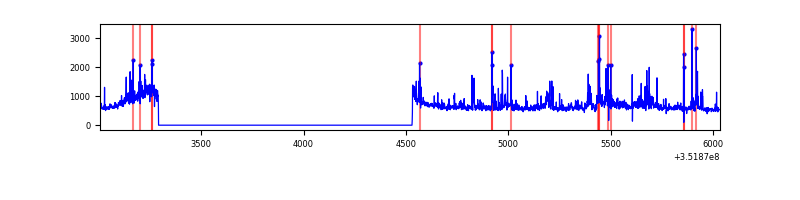 |
Top three noisy pixels from each quadrant. If the there are fewer than three noisy pixels in the level2.evt file, extra rows are filled as -1
| Pixel properties | Quadrant properties | ||||||
|---|---|---|---|---|---|---|---|
| Quadrant | DetID | PixID | Counts | Sigma | Mean | Median | Sigma |
| A | 0 | 13 | 4819 | 78.13 | 279 | 274 | 58.2 |
| A | 13 | 254 | 3703 | 58.95 | 279 | 274 | 58.2 |
| A | 3 | 137 | 2730 | 42.22 | 279 | 274 | 58.2 |
| B | 0 | 183 | 49767 | 917.65 | 271 | 265 | 53.9 |
| B | 0 | 229 | 39856 | 733.93 | 271 | 265 | 53.9 |
| B | 0 | 189 | 11757 | 213.04 | 271 | 265 | 53.9 |
| C | 3 | 233 | 2499845 | 51474.2 | 202 | 203 | 48.6 |
| C | 14 | 238 | 50288 | 1031.38 | 202 | 203 | 48.6 |
| C | 14 | 254 | 28343 | 579.48 | 202 | 203 | 48.6 |
| D | 1 | 52 | 183116 | 2761.1 | 271 | 263 | 66.2 |
| D | 8 | 195 | 38927 | 583.83 | 271 | 263 | 66.2 |
| D | 13 | 153 | 24758 | 369.88 | 271 | 263 | 66.2 |
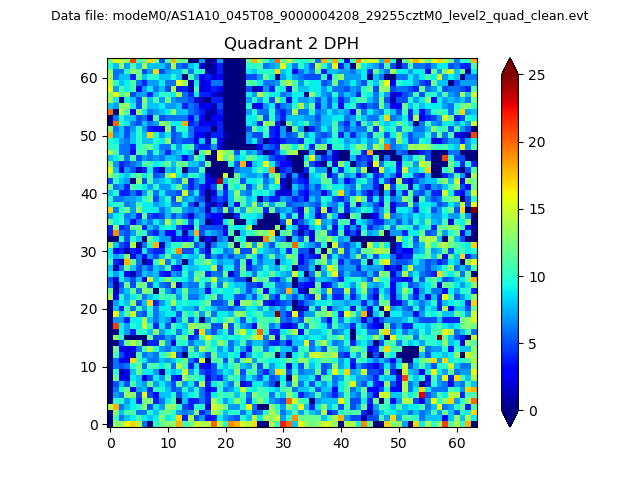
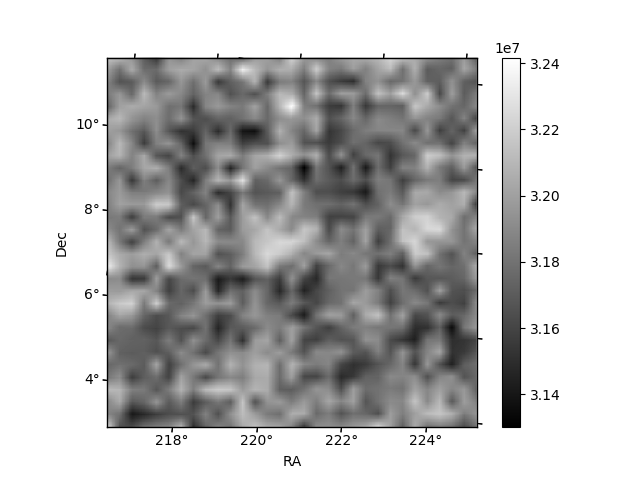
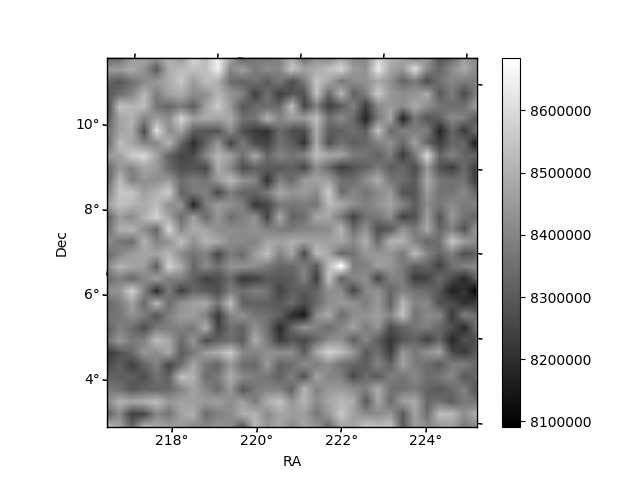
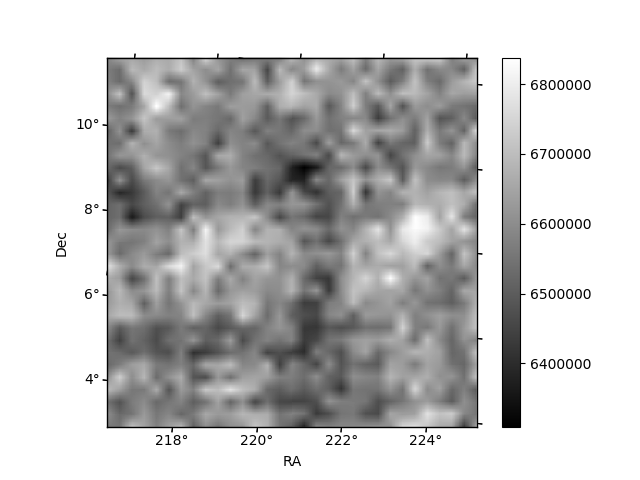
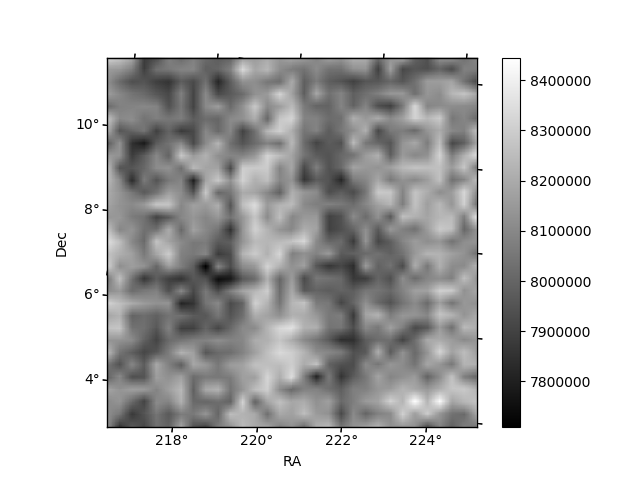
Histogram calculated using DETX and DETY for each event in the final _common_clean file
| Quadrant A | 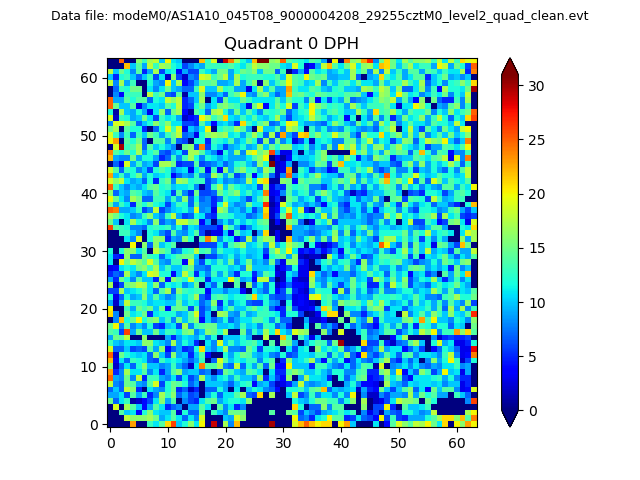 |
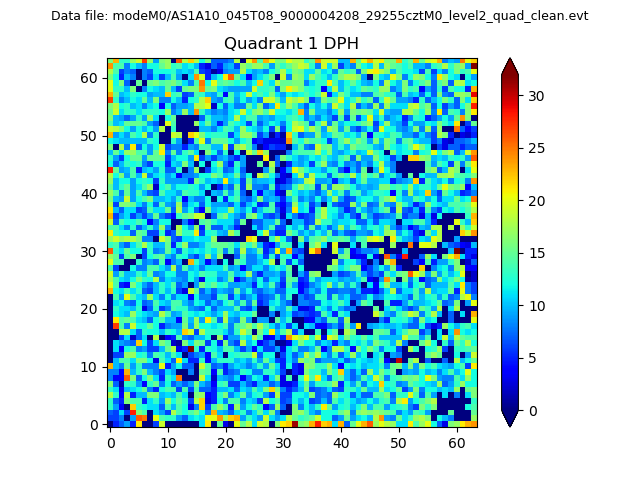 |
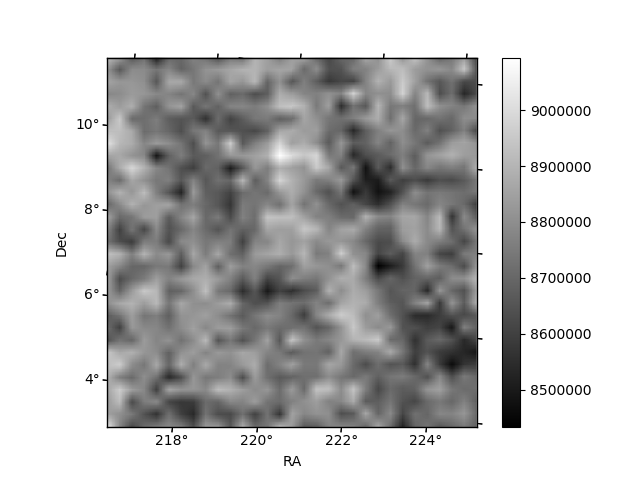
Quadrant B |
|---|---|---|---|
| Quadrant D | 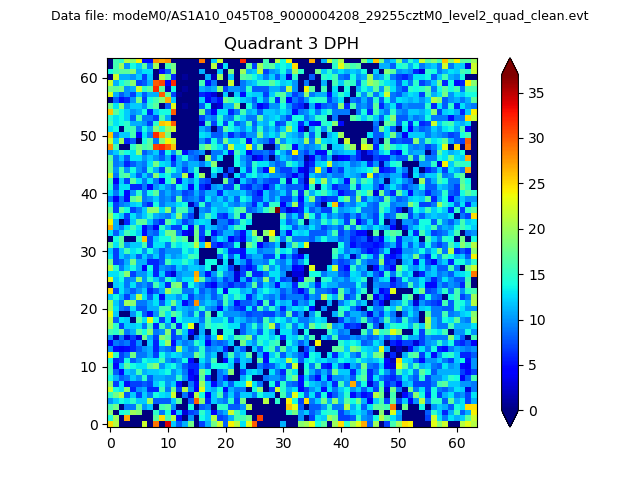 |
 |
Quadrant C |
| Plot type | Count rate plots | Images |
|---|---|---|
| Comparison with Poisson distribution Blue bars denote a histogram of data divided into 1 sec bins. Red curve is a Poisson curve with rate = median count rate of data. |
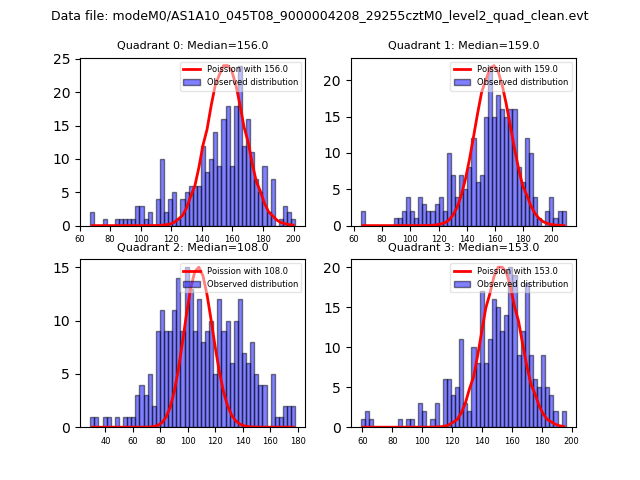 |
 |
| Quadrant-wise count rates Data is divided into 100 sec bins |
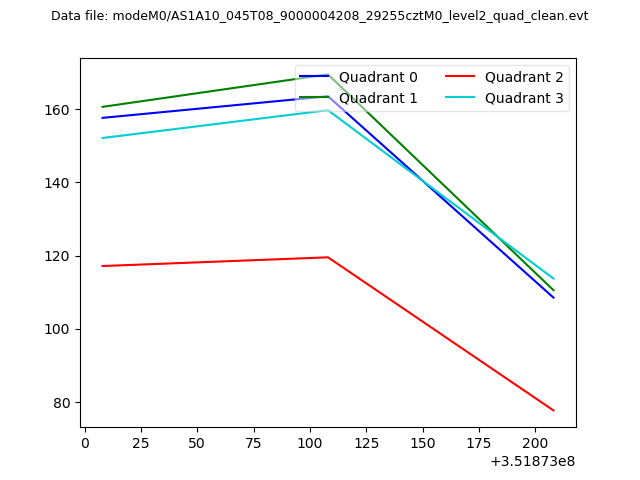 |
|
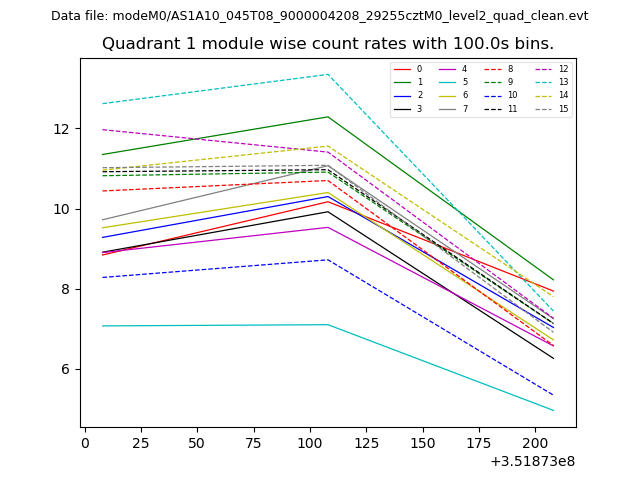
| Module-wise count rates for Quadrant A Data is divided into 100 sec bins |
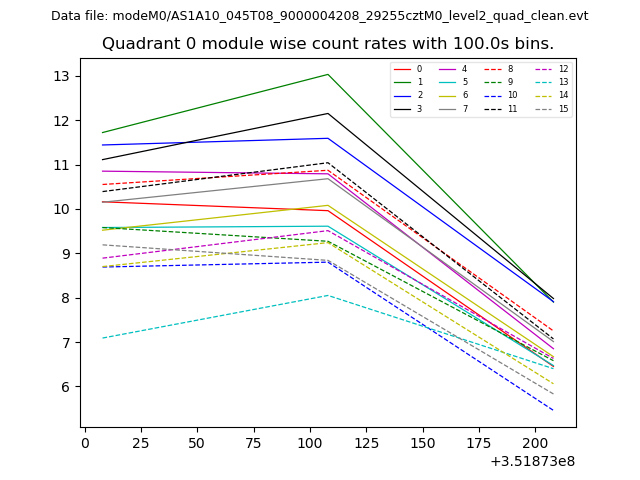 |
 |
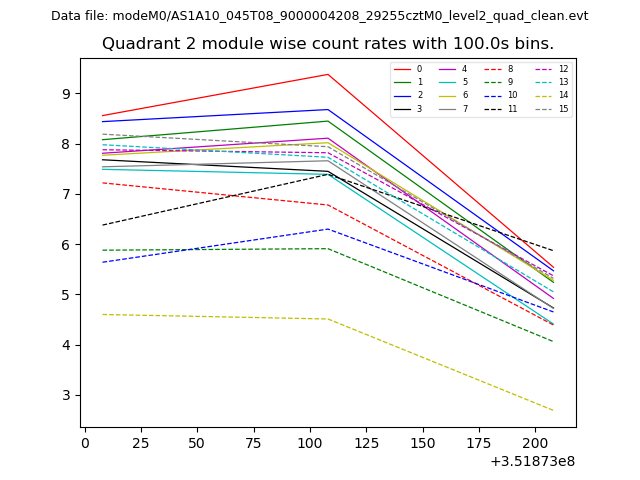
| Module-wise count rates for Quadrant B Data is divided into 100 sec bins |
 |
 |
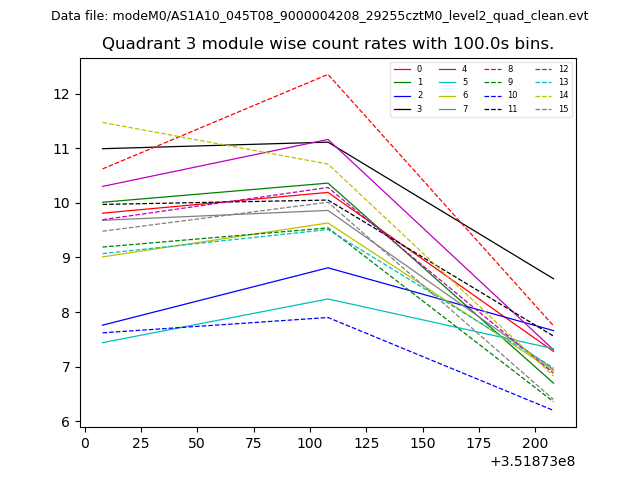
| Module-wise count rates for Quadrant C Data is divided into 100 sec bins |
 |
 |
| Module-wise count rates for Quadrant D Data is divided into 100 sec bins |
 |
 |
| Parameter | Plot |
|---|---|
| CZT HV Monitor | 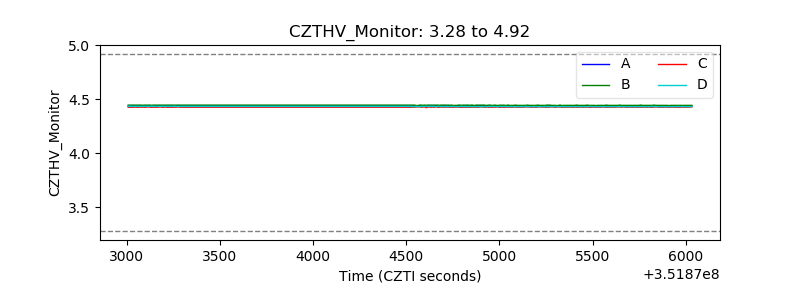 |
| D_VDD | 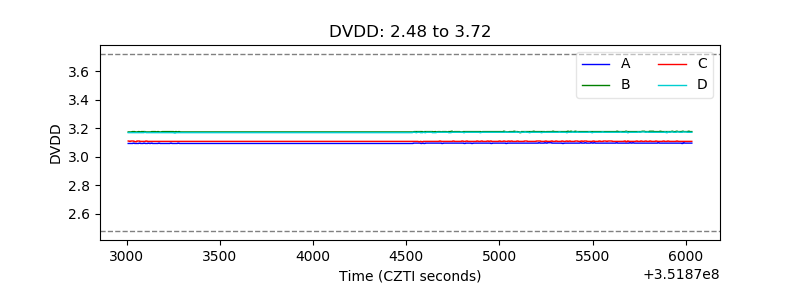 |
| Temperature 1 | 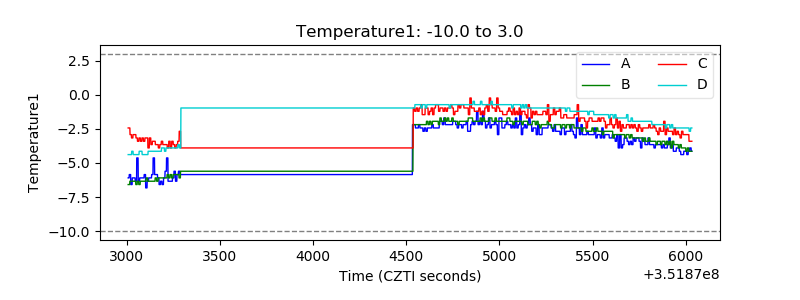 |
| Veto HV Monitor |  |
| Veto LLD | 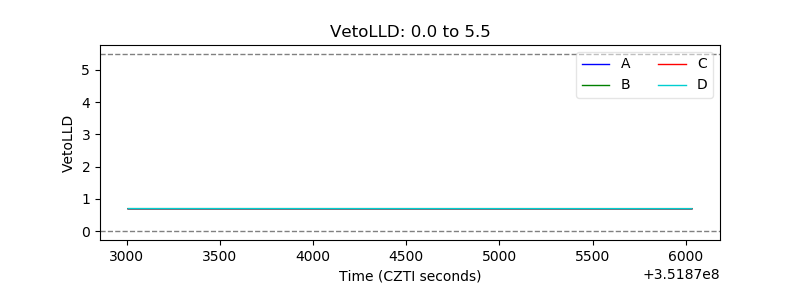 |
| Alpha Counter | 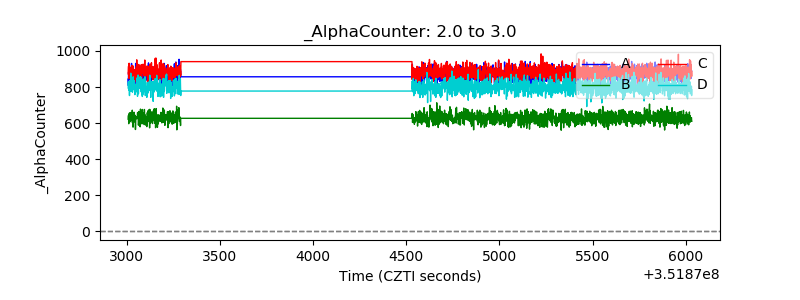 |
| _CPM_Rate | 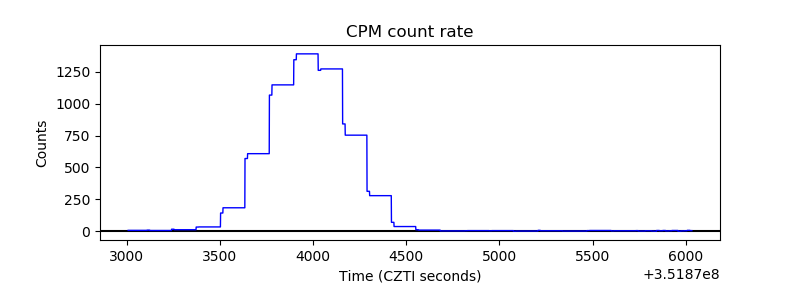 |
| CZT Counter | 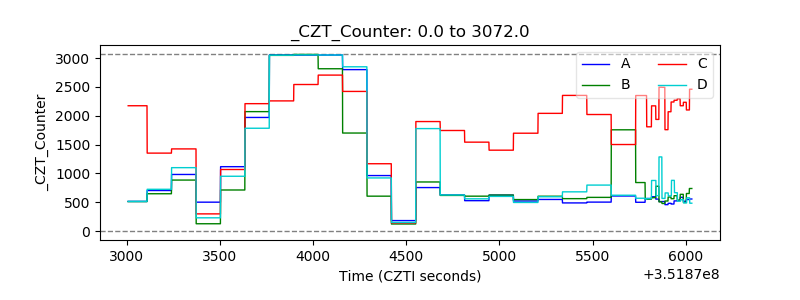 |
| +2.5 Volts monitor |  |
| +5 Volts monitor |  |
| _ROLL_ROT | 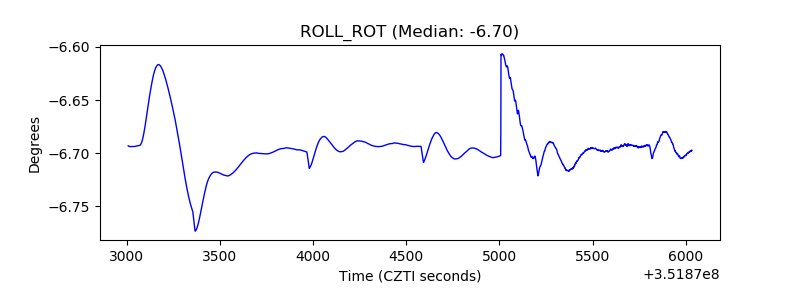 |
| _Roll_DEC | 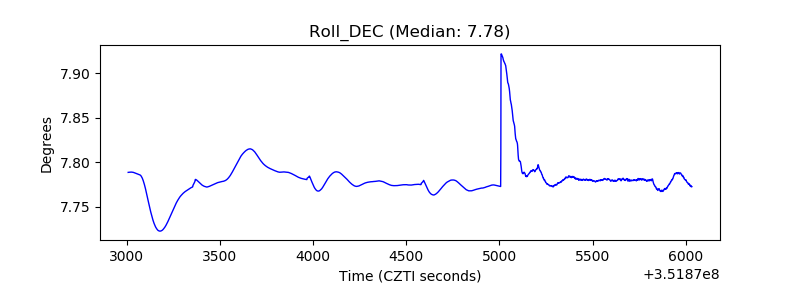 |
| _Roll_RA | 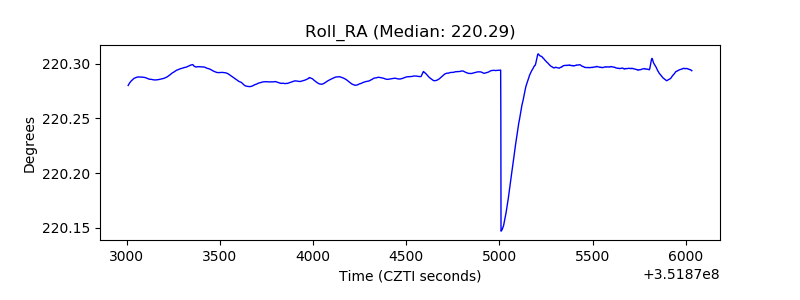 |
| Veto Counter | 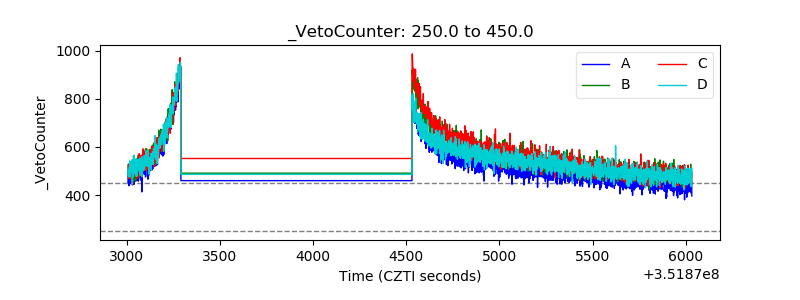 |