| Param | Original file | Final file |
|---|---|---|
| Filename | modeM0/AS1A10_045T08_9000004208_29256cztM0_level2.evt | modeM0/AS1A10_045T08_9000004208_29256cztM0_level2_quad_clean.evt |
| Size (bytes) | 795,263,040 | 76,282,560 |
| Size | 758.4 MB | 72.7 MB |
| Events in quadrant A | 3,423,907 | 480,771 |
| Events in quadrant B | 4,699,504 | 487,172 |
| Events in quadrant C | 11,081,357 | 416,411 |
| Events in quadrant D | 4,435,187 | 465,588 |
| Mode SS | |||
|---|---|---|---|
| Quadrant | BADHDUFLAG | Total packets | Discarded packets |
| A | 0 | 134 | 0 |
| B | 0 | 134 | 0 |
| C | 0 | 134 | 0 |
| D | 0 | 134 | 0 |
| Mode M0 | |||
|---|---|---|---|
| Quadrant | BADHDUFLAG | Total packets | Discarded packets |
| A | 0 | 14217 | 2 |
| B | 0 | 18262 | 2 |
| C | 0 | 37505 | 2 |
| D | 0 | 17585 | 2 |
| Mode M9 | |||
|---|---|---|---|
| Quadrant | BADHDUFLAG | Total packets | Discarded packets |
| A | 0 | 15 | 0 |
| B | 0 | 16 | 0 |
| C | 0 | 16 | 0 |
| D | 0 | 16 | 0 |
| Quadrant | Total seconds | Saturated seconds | Saturation percentage |
|---|---|---|---|
| A | 6588 | 103 | 1.563449% |
| B | 6587 | 439 | 6.664642% |
| C | 6587 | 2944 | 44.694094% |
| D | 6587 | 206 | 3.127372% |
Noise dominated data is calculated using 1-second bins in cleaned event files. If a bin has >2000 counts, and if more than 50% of those come from <1% of pixels, then it is considered to be noise-dominated and hence unusable.
| Quadrant | # 1 sec bins | Bins with >0 counts | Bins with >2000 counts | High rate bins dominated by noise | Noise dominated (total time) | Noise dominated (detector-on time) | Marked lightcurve |
|---|---|---|---|---|---|---|---|
| A | 7608 | 6589 | 0 | 0 | 0.00% | 0.00% |  |
| B | 7607 | 6588 | 141 | 141 | 1.85% | 2.14% |  |
| C | 7607 | 6588 | 1784 | 1784 | 23.45% | 27.08% |  |
| D | 7607 | 6588 | 91 | 91 | 1.20% | 1.38% |  |
Top three noisy pixels from each quadrant. If the there are fewer than three noisy pixels in the level2.evt file, extra rows are filled as -1
| Pixel properties | Quadrant properties | ||||||
|---|---|---|---|---|---|---|---|
| Quadrant | DetID | PixID | Counts | Sigma | Mean | Median | Sigma |
| A | 0 | 13 | 15989 | 85.58 | 882 | 866 | 176.7 |
| A | 13 | 254 | 12712 | 67.03 | 882 | 866 | 176.7 |
| A | 3 | 137 | 8443 | 42.88 | 882 | 866 | 176.7 |
| B | 10 | 247 | 637908 | 3921.02 | 859 | 838 | 162.5 |
| B | 0 | 183 | 302806 | 1858.54 | 859 | 838 | 162.5 |
| B | 5 | 255 | 184294 | 1129.13 | 859 | 838 | 162.5 |
| C | 3 | 233 | 7949020 | 45854.85 | 749 | 757 | 173.3 |
| C | 14 | 238 | 150284 | 862.65 | 749 | 757 | 173.3 |
| C | 14 | 254 | 48500 | 275.44 | 749 | 757 | 173.3 |
| D | 1 | 52 | 792803 | 3545.39 | 848 | 835 | 223.4 |
| D | 8 | 195 | 226677 | 1011.02 | 848 | 835 | 223.4 |
| D | 13 | 153 | 79352 | 351.5 | 848 | 835 | 223.4 |
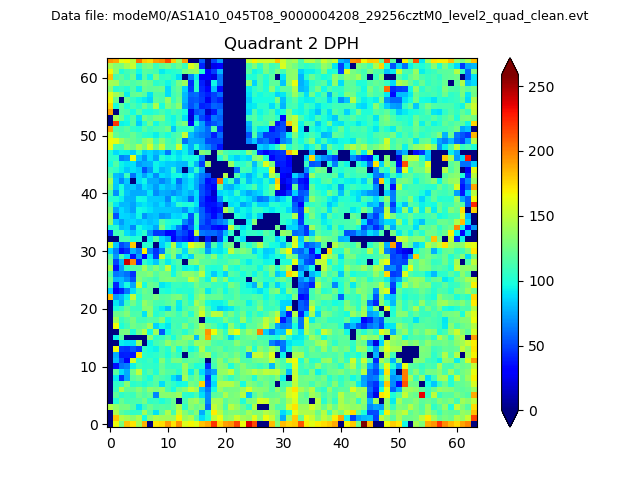
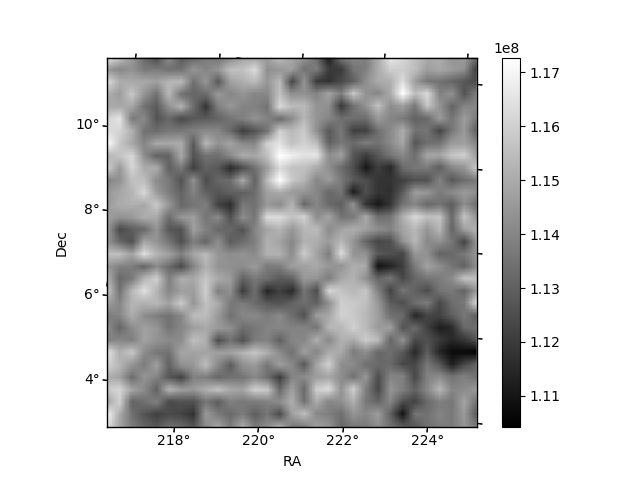
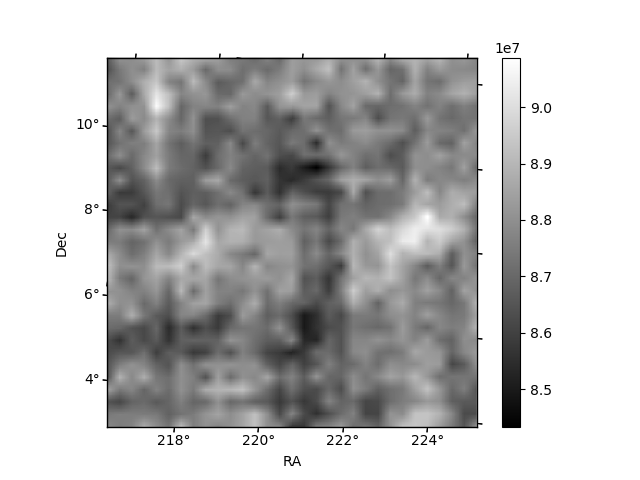
Histogram calculated using DETX and DETY for each event in the final _common_clean file
| Quadrant A | 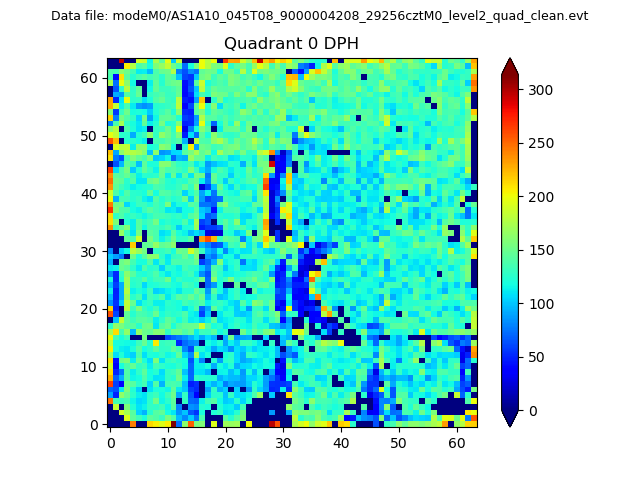 |
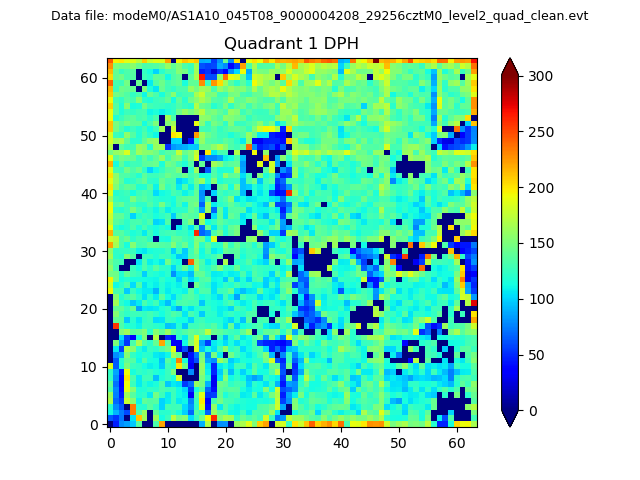 |
Quadrant B |
|---|---|---|---|
| Quadrant D | 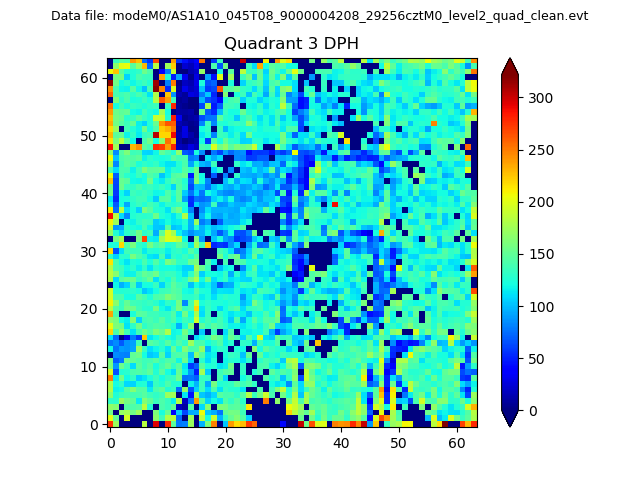 |
 |
Quadrant C |
| Plot type | Count rate plots | Images |
|---|---|---|
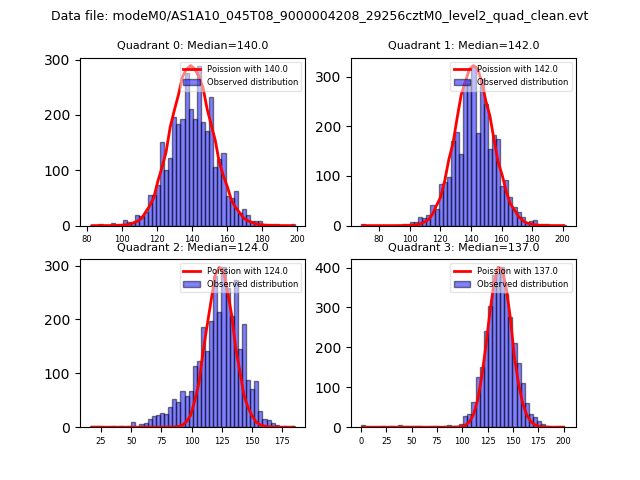
| Comparison with Poisson distribution Blue bars denote a histogram of data divided into 1 sec bins. Red curve is a Poisson curve with rate = median count rate of data. |
 |
 |
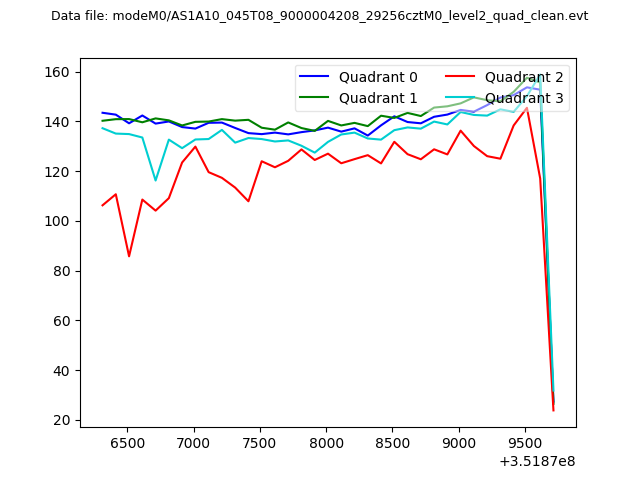
| Quadrant-wise count rates Data is divided into 100 sec bins |
 |
|
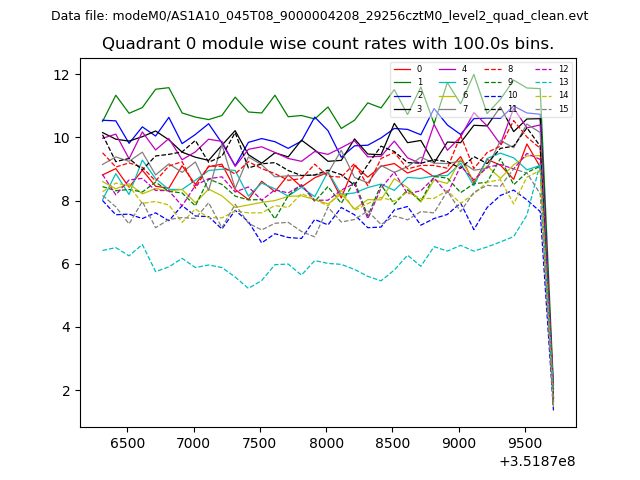
| Module-wise count rates for Quadrant A Data is divided into 100 sec bins |
 |
 |
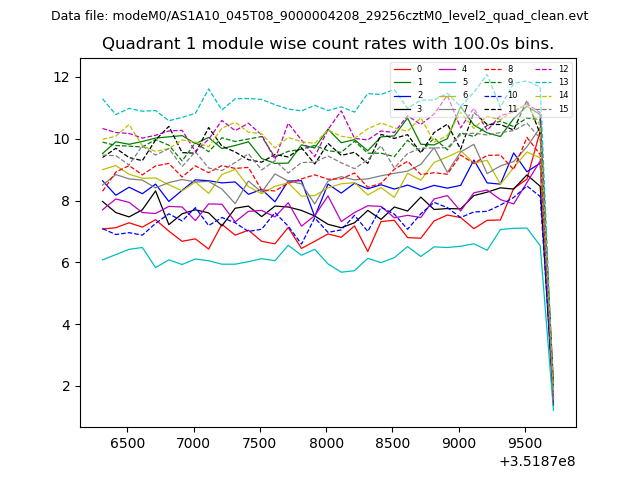
| Module-wise count rates for Quadrant B Data is divided into 100 sec bins |
 |
 |
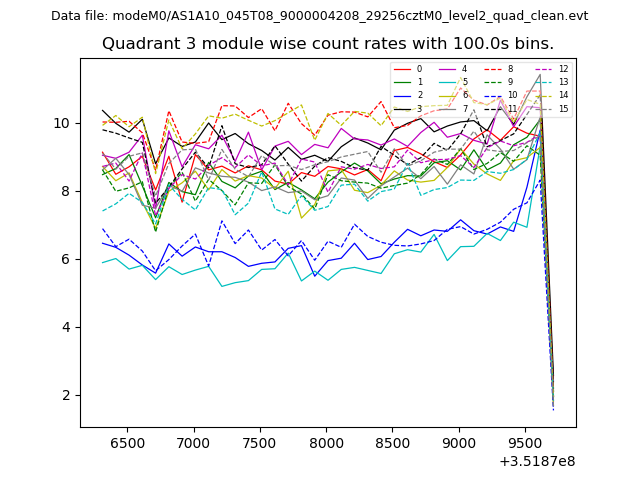
| Module-wise count rates for Quadrant C Data is divided into 100 sec bins |
 |
 |
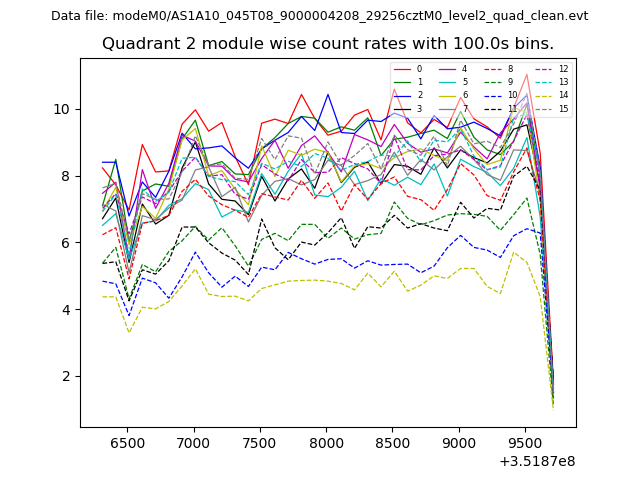
| Module-wise count rates for Quadrant D Data is divided into 100 sec bins |
 |
 |
| Parameter | Plot |
|---|---|
| CZT HV Monitor | 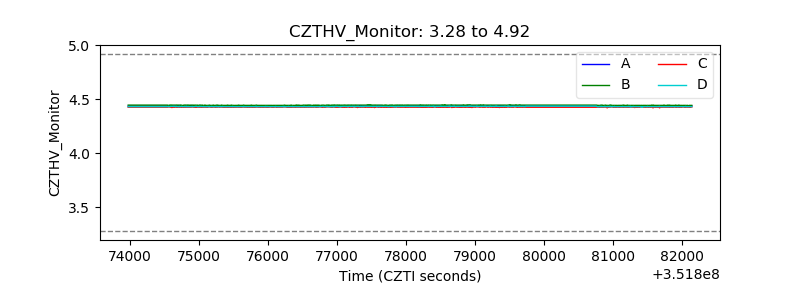 |
| D_VDD | 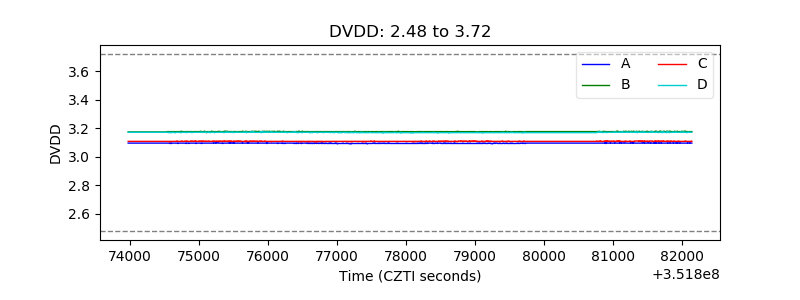 |
| Temperature 1 | 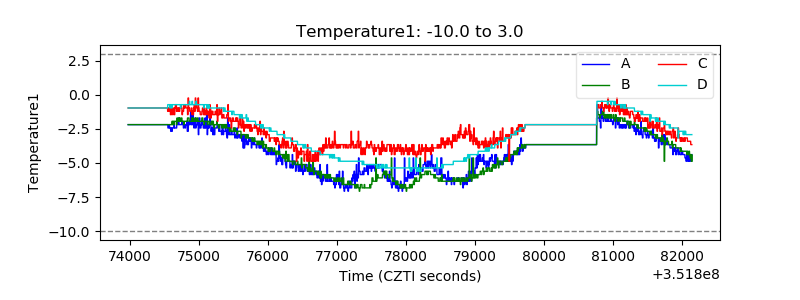 |
| Veto HV Monitor | 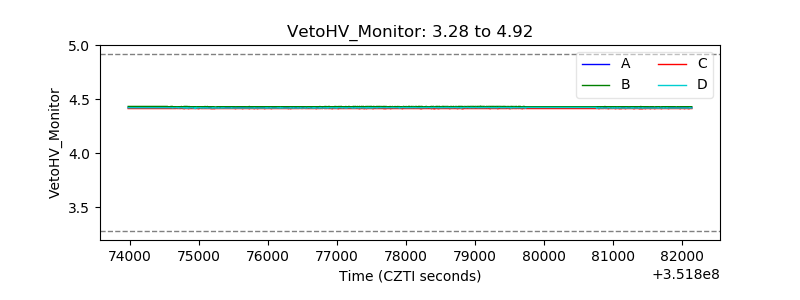 |
| Veto LLD | 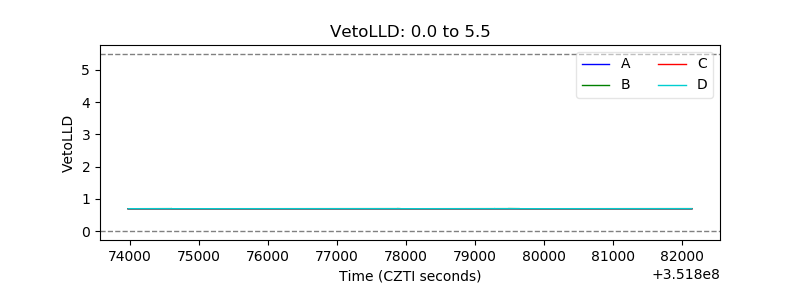 |
| Alpha Counter | 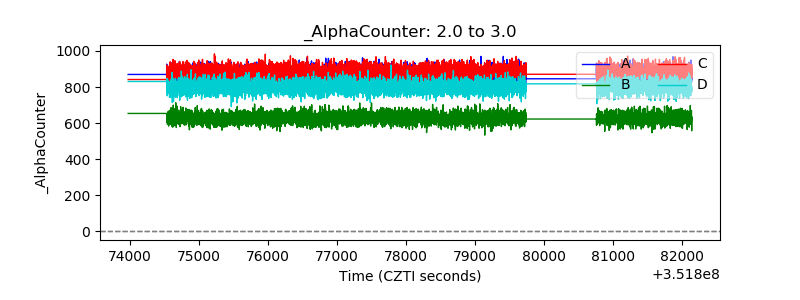 |
| _CPM_Rate | 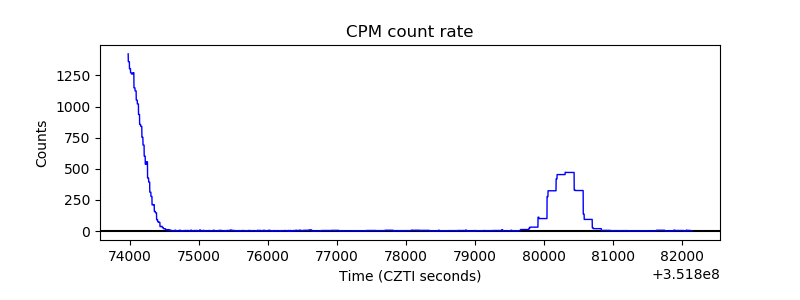 |
| CZT Counter | 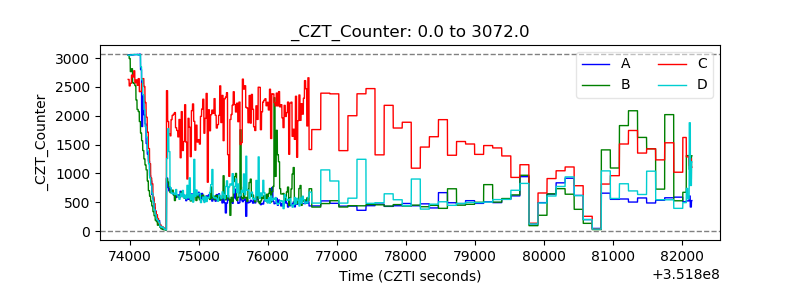 |
| +2.5 Volts monitor |  |
| +5 Volts monitor |  |
| _ROLL_ROT | 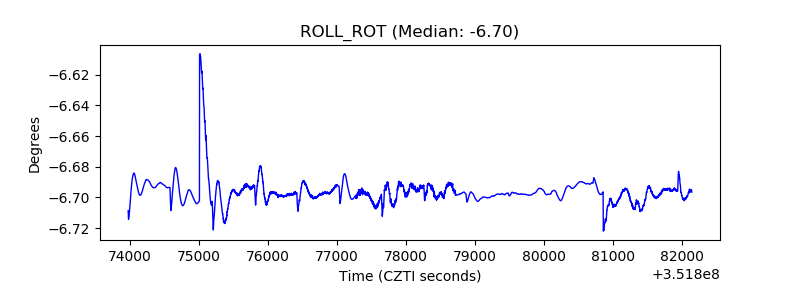 |
| _Roll_DEC | 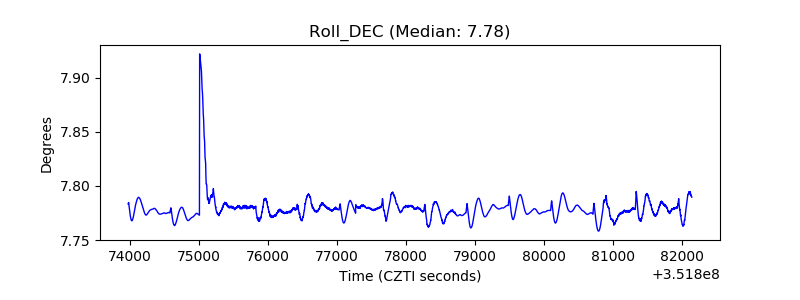 |
| _Roll_RA |  |
| Veto Counter | 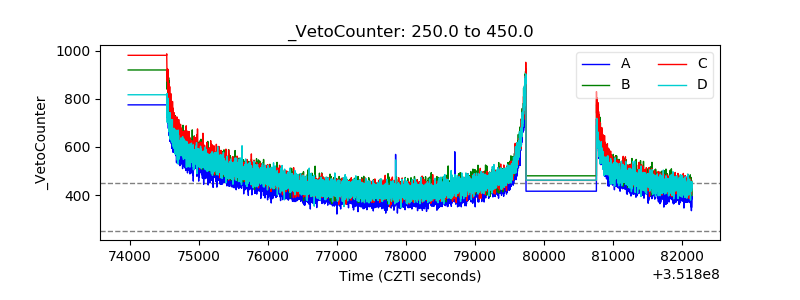 |