| Param | Original file | Final file |
|---|---|---|
| Filename | modeM0/AS1A10_045T08_9000004208_29257cztM0_level2.evt | modeM0/AS1A10_045T08_9000004208_29257cztM0_level2_quad_clean.evt |
| Size (bytes) | 685,624,320 | 85,046,400 |
| Size | 653.9 MB | 81.1 MB |
| Events in quadrant A | 3,290,271 | 533,325 |
| Events in quadrant B | 5,704,511 | 539,501 |
| Events in quadrant C | 6,726,838 | 515,355 |
| Events in quadrant D | 4,587,924 | 518,023 |
| Mode SS | |||
|---|---|---|---|
| Quadrant | BADHDUFLAG | Total packets | Discarded packets |
| A | 0 | 134 | 0 |
| B | 0 | 134 | 0 |
| C | 0 | 134 | 0 |
| D | 0 | 134 | 0 |
| Mode M0 | |||
|---|---|---|---|
| Quadrant | BADHDUFLAG | Total packets | Discarded packets |
| A | 0 | 13940 | 1 |
| B | 0 | 21523 | 1 |
| C | 0 | 24909 | 1 |
| D | 0 | 18182 | 1 |
| Mode M9 | |||
|---|---|---|---|
| Quadrant | BADHDUFLAG | Total packets | Discarded packets |
| A | 0 | 8 | 0 |
| B | 0 | 8 | 0 |
| C | 0 | 8 | 0 |
| D | 0 | 8 | 0 |
| Quadrant | Total seconds | Saturated seconds | Saturation percentage |
|---|---|---|---|
| A | 6738 | 34 | 0.504601% |
| B | 6739 | 760 | 11.277638% |
| C | 6739 | 691 | 10.253747% |
| D | 6739 | 258 | 3.828461% |
Noise dominated data is calculated using 1-second bins in cleaned event files. If a bin has >2000 counts, and if more than 50% of those come from <1% of pixels, then it is considered to be noise-dominated and hence unusable.
| Quadrant | # 1 sec bins | Bins with >0 counts | Bins with >2000 counts | High rate bins dominated by noise | Noise dominated (total time) | Noise dominated (detector-on time) | Marked lightcurve |
|---|---|---|---|---|---|---|---|
| A | 7448 | 6739 | 1 | 1 | 0.01% | 0.01% | 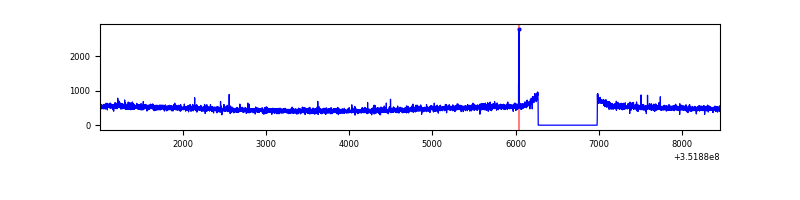 |
| B | 7449 | 6740 | 305 | 305 | 4.09% | 4.53% | 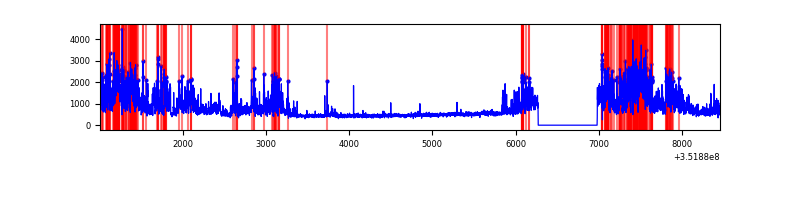 |
| C | 7449 | 6740 | 56 | 56 | 0.75% | 0.83% | 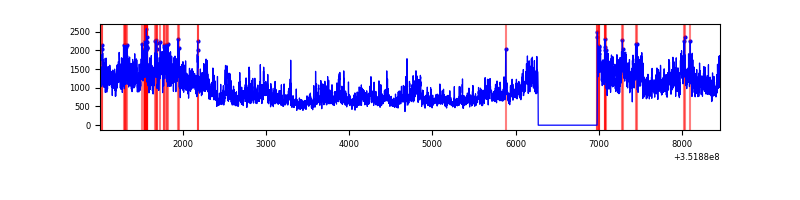 |
| D | 7449 | 6740 | 145 | 145 | 1.95% | 2.15% | 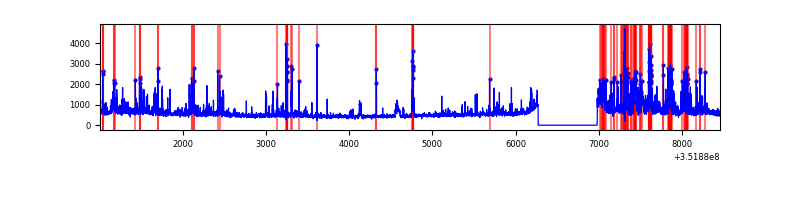 |
Top three noisy pixels from each quadrant. If the there are fewer than three noisy pixels in the level2.evt file, extra rows are filled as -1
| Pixel properties | Quadrant properties | ||||||
|---|---|---|---|---|---|---|---|
| Quadrant | DetID | PixID | Counts | Sigma | Mean | Median | Sigma |
| A | 13 | 254 | 13484 | 73.57 | 848 | 829 | 172.0 |
| A | 0 | 13 | 11658 | 62.95 | 848 | 829 | 172.0 |
| A | 1 | 113 | 8509 | 44.65 | 848 | 829 | 172.0 |
| B | 10 | 247 | 1747322 | 11222.14 | 817 | 798 | 155.6 |
| B | 0 | 183 | 312093 | 2000.2 | 817 | 798 | 155.6 |
| B | 0 | 229 | 195881 | 1253.49 | 817 | 798 | 155.6 |
| C | 3 | 233 | 3449504 | 18482.71 | 797 | 804 | 186.6 |
| C | 14 | 238 | 132198 | 704.18 | 797 | 804 | 186.6 |
| C | 10 | 9 | 16308 | 83.09 | 797 | 804 | 186.6 |
| D | 1 | 52 | 857904 | 4360.45 | 819 | 800 | 196.6 |
| D | 8 | 195 | 263599 | 1336.97 | 819 | 800 | 196.6 |
| D | 13 | 153 | 125249 | 633.12 | 819 | 800 | 196.6 |
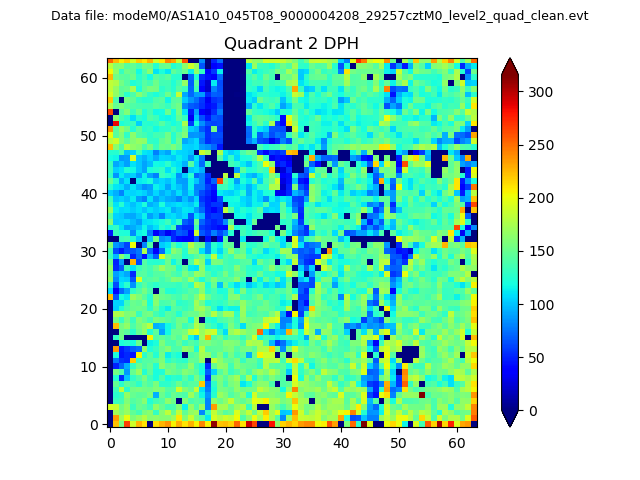
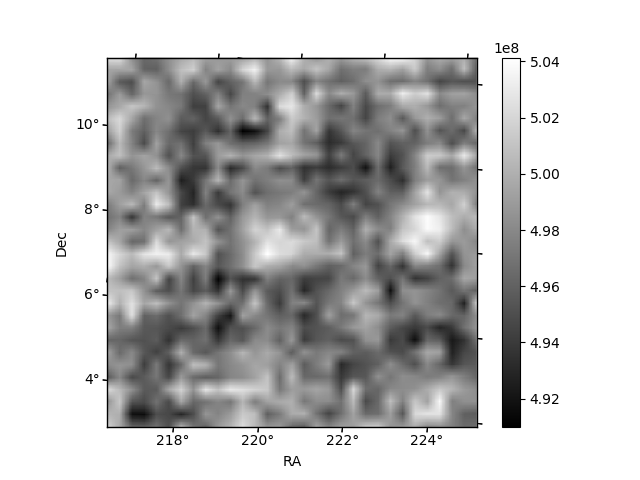
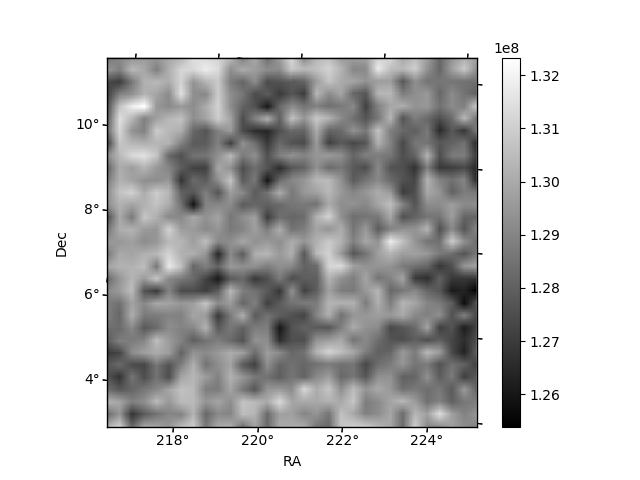
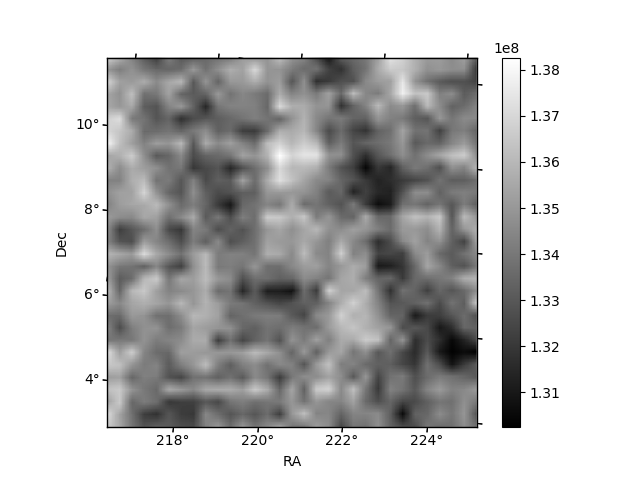
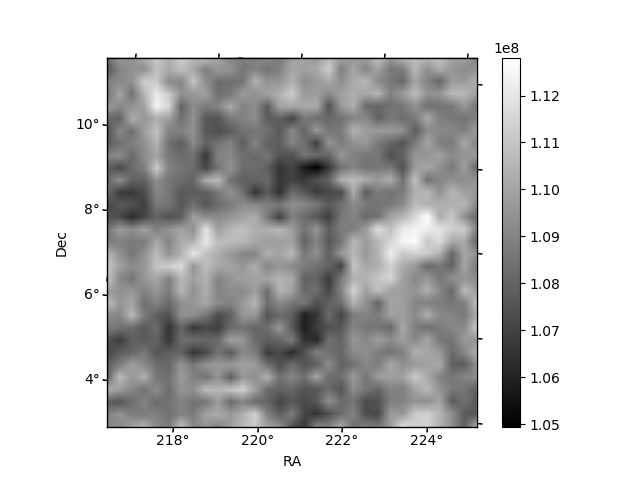
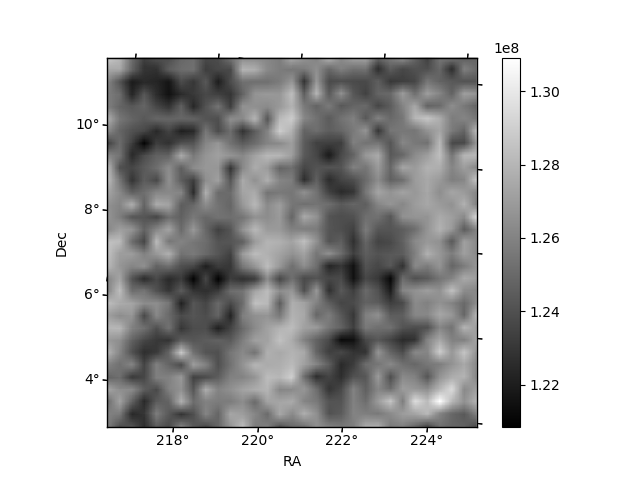
Histogram calculated using DETX and DETY for each event in the final _common_clean file
| Quadrant A | 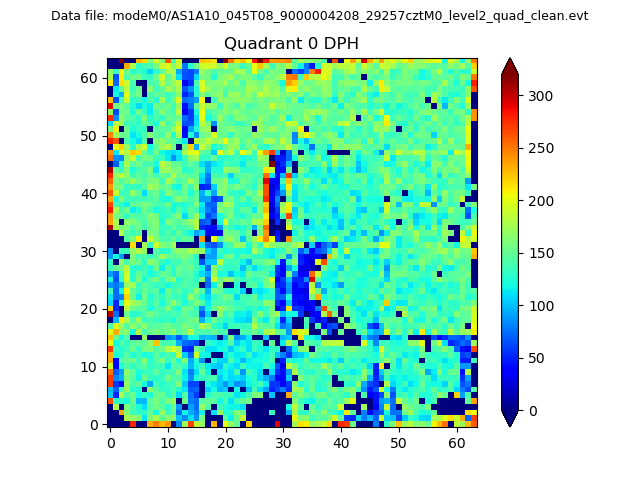 |
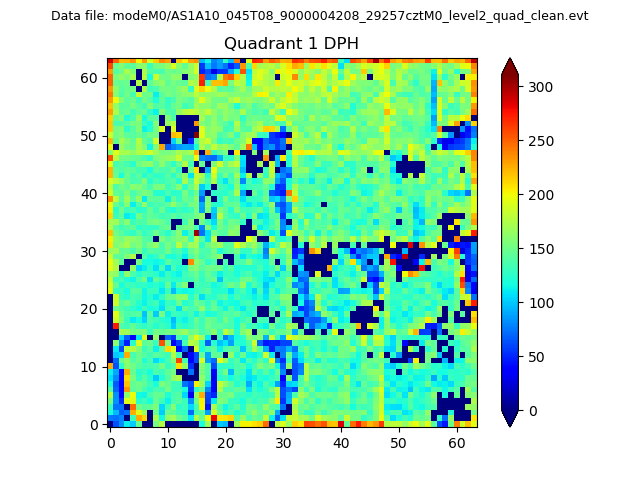 |
Quadrant B |
|---|---|---|---|
| Quadrant D | 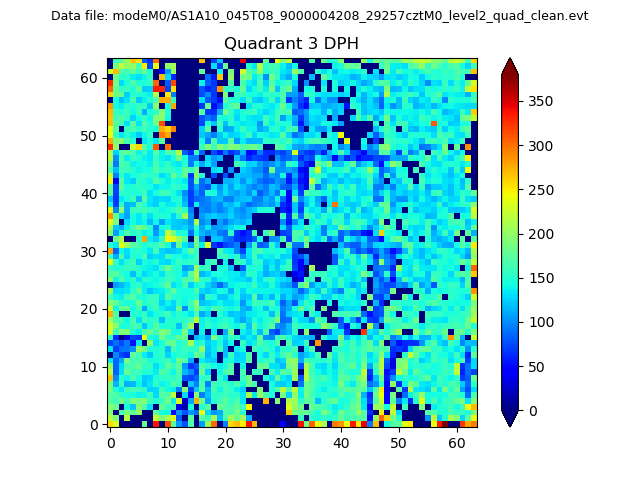 |
 |
Quadrant C |
| Plot type | Count rate plots | Images |
|---|---|---|
| Comparison with Poisson distribution Blue bars denote a histogram of data divided into 1 sec bins. Red curve is a Poisson curve with rate = median count rate of data. |
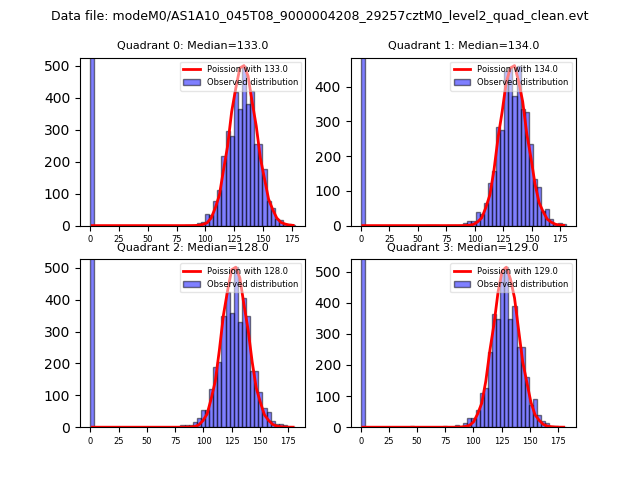 |
 |
| Quadrant-wise count rates Data is divided into 100 sec bins |
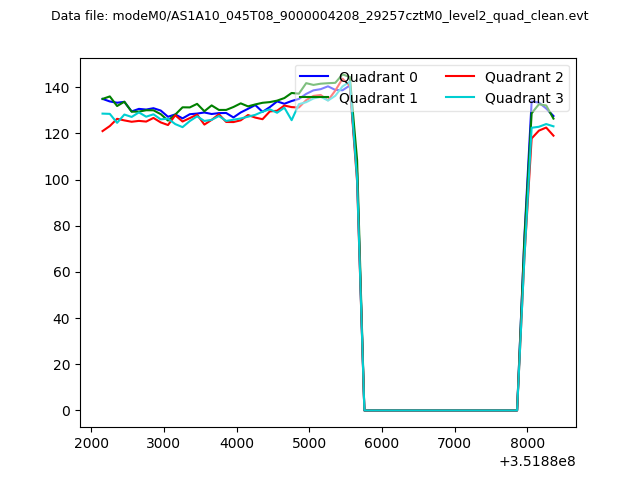 |
|
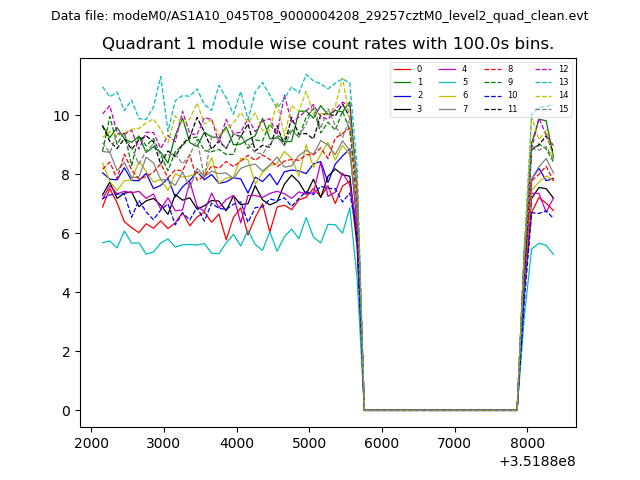
| Module-wise count rates for Quadrant A Data is divided into 100 sec bins |
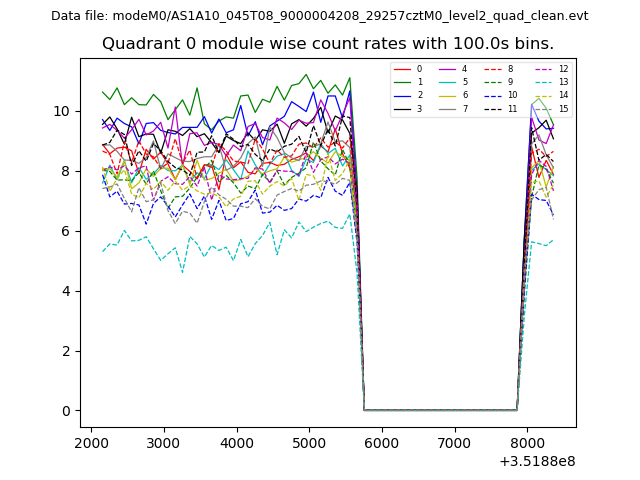 |
 |
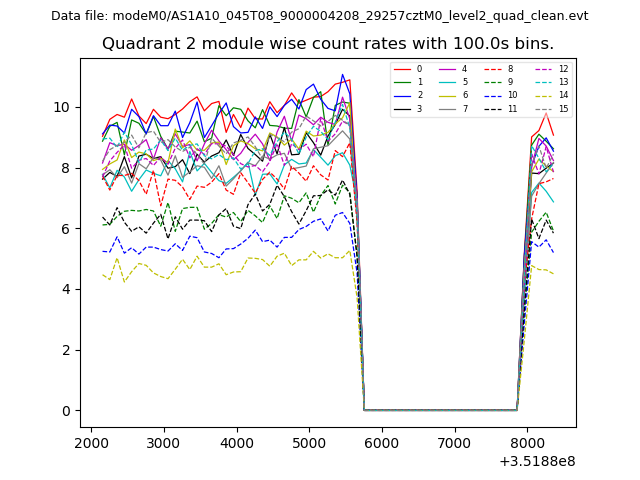
| Module-wise count rates for Quadrant B Data is divided into 100 sec bins |
 |
 |
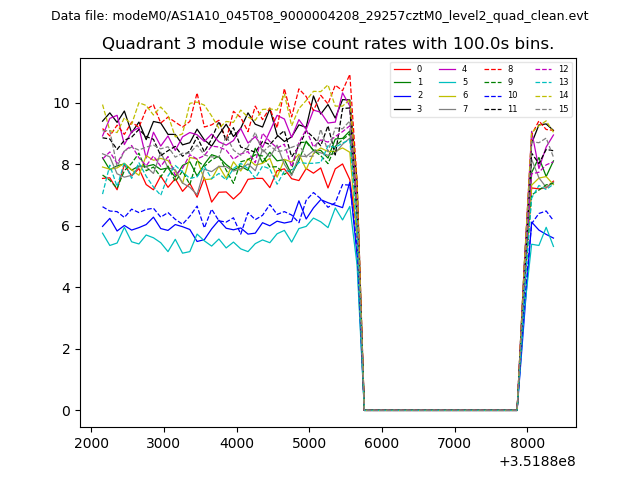
| Module-wise count rates for Quadrant C Data is divided into 100 sec bins |
 |
 |
| Module-wise count rates for Quadrant D Data is divided into 100 sec bins |
 |
 |
| Parameter | Plot |
|---|---|
| CZT HV Monitor | 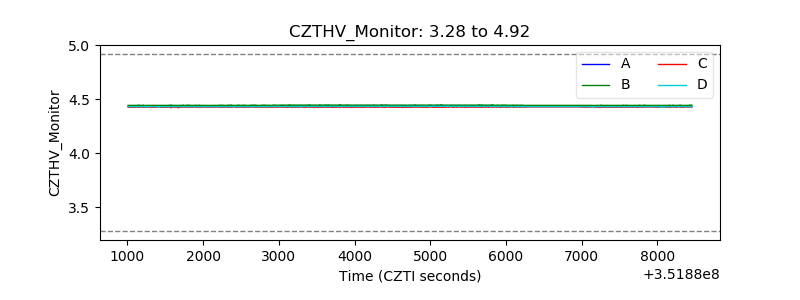 |
| D_VDD | 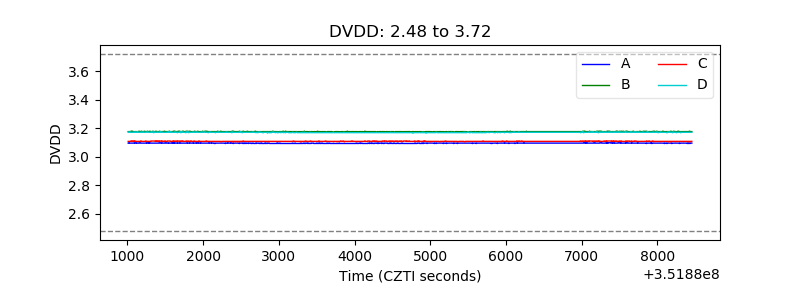 |
| Temperature 1 | 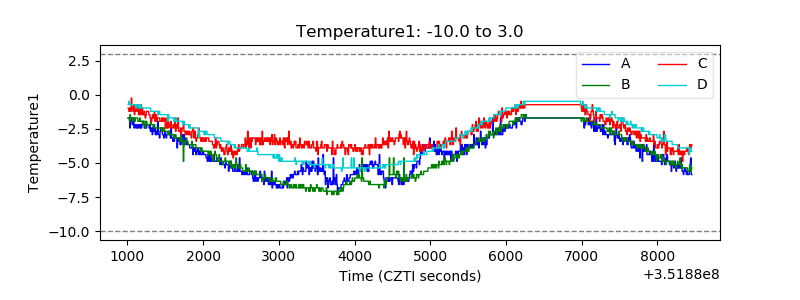 |
| Veto HV Monitor | 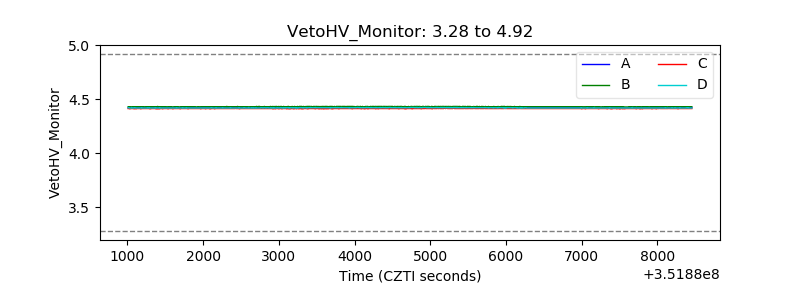 |
| Veto LLD | 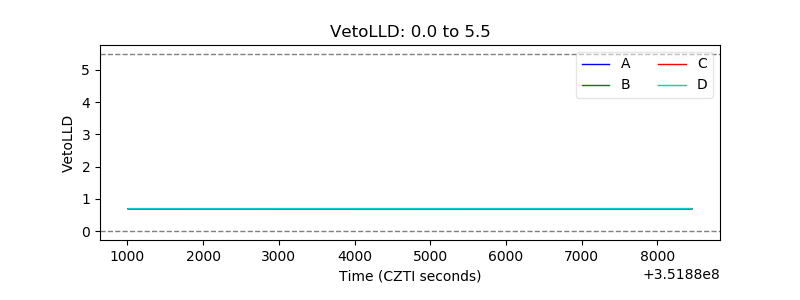 |
| Alpha Counter | 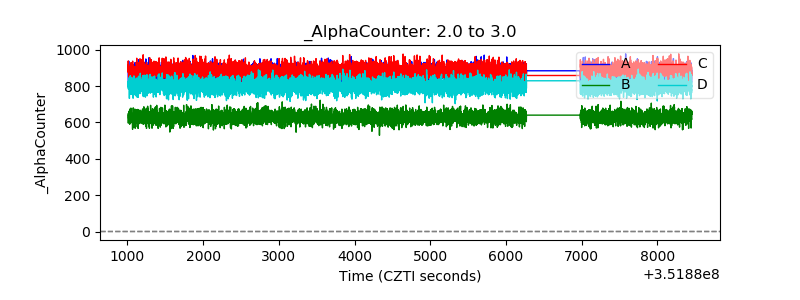 |
| _CPM_Rate | 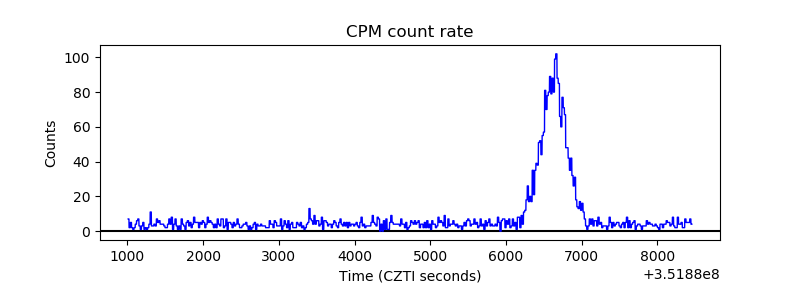 |
| CZT Counter | 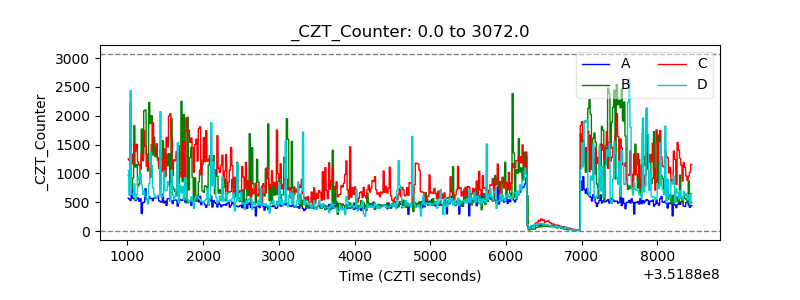 |
| +2.5 Volts monitor |  |
| +5 Volts monitor |  |
| _ROLL_ROT | 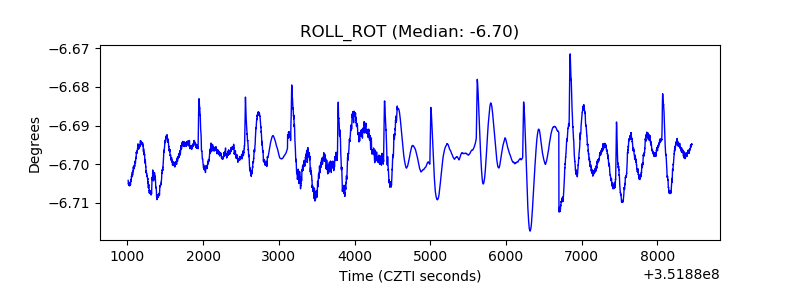 |
| _Roll_DEC | 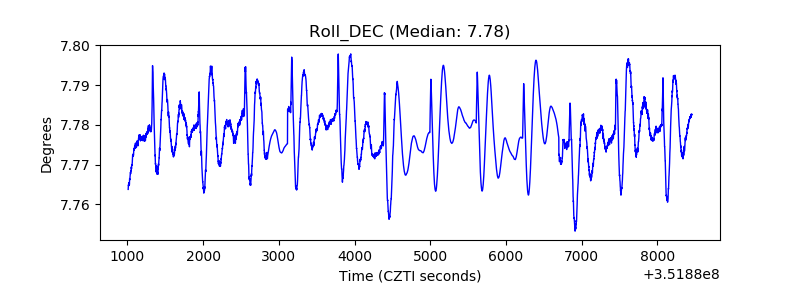 |
| _Roll_RA | 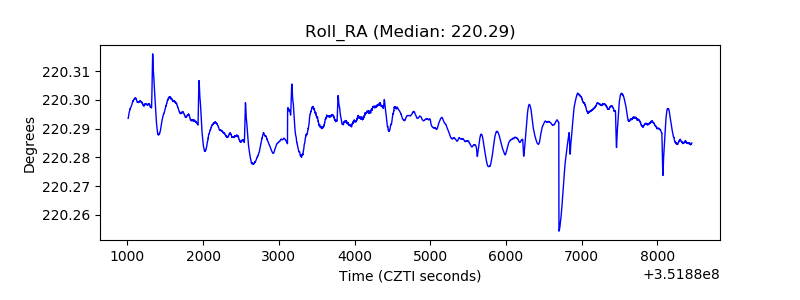 |
| Veto Counter | 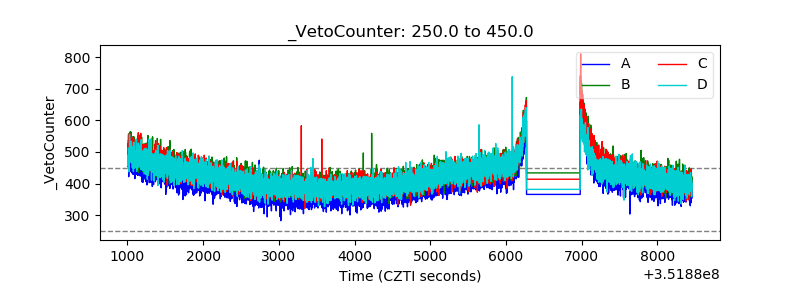 |