| Param | Original file | Final file |
|---|---|---|
| Filename | modeM0/AS1A10_045T08_9000004208_29259cztM0_level2.evt | modeM0/AS1A10_045T08_9000004208_29259cztM0_level2_quad_clean.evt |
| Size (bytes) | 725,230,080 | 97,920,000 |
| Size | 691.6 MB | 93.4 MB |
| Events in quadrant A | 4,090,441 | 610,815 |
| Events in quadrant B | 4,399,378 | 626,461 |
| Events in quadrant C | 7,494,665 | 595,566 |
| Events in quadrant D | 5,453,107 | 591,503 |
| Mode SS | |||
|---|---|---|---|
| Quadrant | BADHDUFLAG | Total packets | Discarded packets |
| A | 0 | 162 | 0 |
| B | 0 | 162 | 0 |
| C | 0 | 162 | 0 |
| D | 0 | 162 | 0 |
| Mode M0 | |||
|---|---|---|---|
| Quadrant | BADHDUFLAG | Total packets | Discarded packets |
| A | 0 | 17182 | 3 |
| B | 0 | 18268 | 3 |
| C | 0 | 27684 | 3 |
| D | 0 | 21661 | 3 |
| Mode M9 | |||
|---|---|---|---|
| Quadrant | BADHDUFLAG | Total packets | Discarded packets |
| A | 0 | 5 | 0 |
| B | 0 | 5 | 0 |
| C | 0 | 5 | 0 |
| D | 0 | 5 | 0 |
| Quadrant | Total seconds | Saturated seconds | Saturation percentage |
|---|---|---|---|
| A | 7775 | 215 | 2.765273% |
| B | 7776 | 313 | 4.025206% |
| C | 7776 | 1298 | 16.692387% |
| D | 7776 | 282 | 3.626543% |
Noise dominated data is calculated using 1-second bins in cleaned event files. If a bin has >2000 counts, and if more than 50% of those come from <1% of pixels, then it is considered to be noise-dominated and hence unusable.
| Quadrant | # 1 sec bins | Bins with >0 counts | Bins with >2000 counts | High rate bins dominated by noise | Noise dominated (total time) | Noise dominated (detector-on time) | Marked lightcurve |
|---|---|---|---|---|---|---|---|
| A | 8340 | 7779 | 77 | 77 | 0.92% | 0.99% | 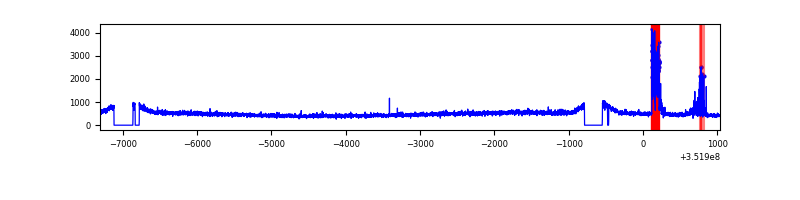 |
| B | 8341 | 7780 | 28 | 28 | 0.34% | 0.36% | 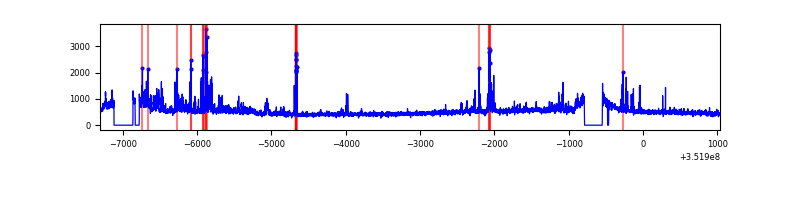 |
| C | 8341 | 7780 | 333 | 333 | 3.99% | 4.28% | 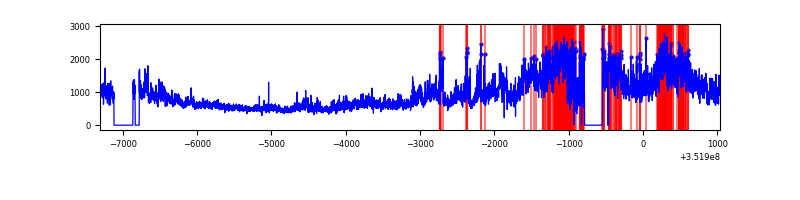 |
| D | 8341 | 7780 | 159 | 159 | 1.91% | 2.04% | 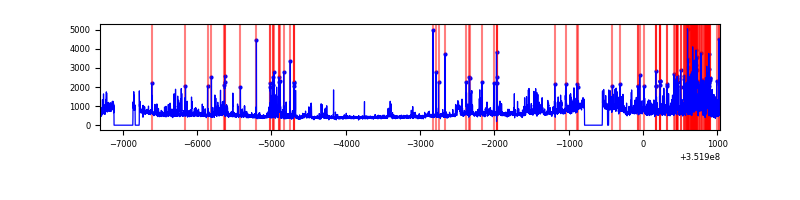 |
Top three noisy pixels from each quadrant. If the there are fewer than three noisy pixels in the level2.evt file, extra rows are filled as -1
| Pixel properties | Quadrant properties | ||||||
|---|---|---|---|---|---|---|---|
| Quadrant | DetID | PixID | Counts | Sigma | Mean | Median | Sigma |
| A | 15 | 174 | 285063 | 1430.06 | 975 | 951 | 198.7 |
| A | 0 | 13 | 35072 | 171.75 | 975 | 951 | 198.7 |
| A | 13 | 254 | 17629 | 83.95 | 975 | 951 | 198.7 |
| B | 0 | 183 | 200716 | 1068.85 | 971 | 946 | 186.9 |
| B | 0 | 229 | 191552 | 1019.82 | 971 | 946 | 186.9 |
| B | 10 | 246 | 109540 | 581.02 | 971 | 946 | 186.9 |
| C | 3 | 233 | 3720171 | 17863.48 | 886 | 893 | 208.2 |
| C | 14 | 238 | 175786 | 840.0 | 886 | 893 | 208.2 |
| C | 10 | 9 | 73058 | 346.6 | 886 | 893 | 208.2 |
| D | 8 | 195 | 714693 | 3205.47 | 943 | 921 | 222.7 |
| D | 1 | 52 | 706126 | 3166.99 | 943 | 921 | 222.7 |
| D | 13 | 153 | 141271 | 630.29 | 943 | 921 | 222.7 |
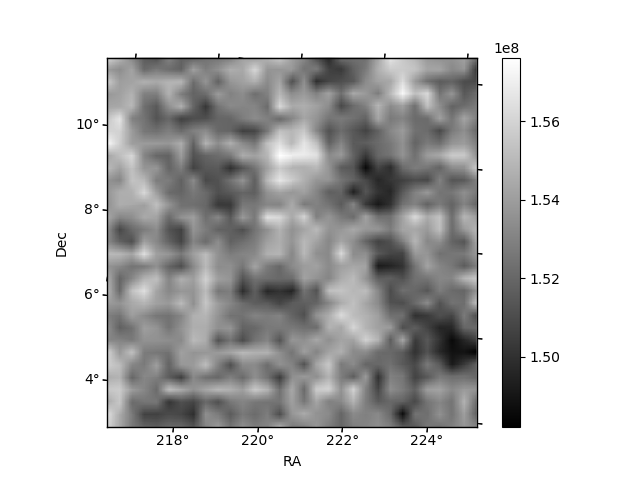
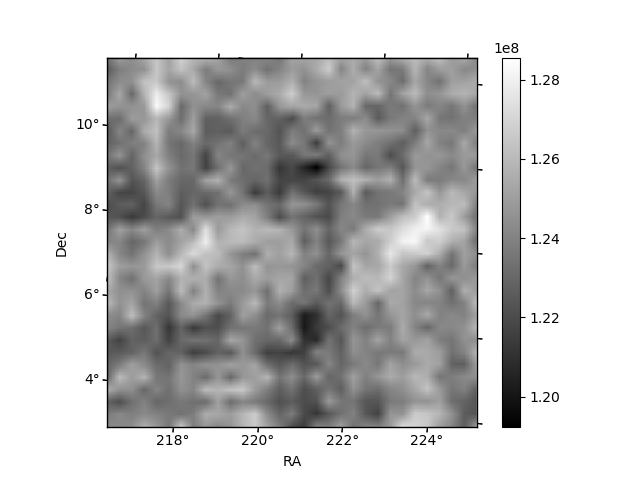
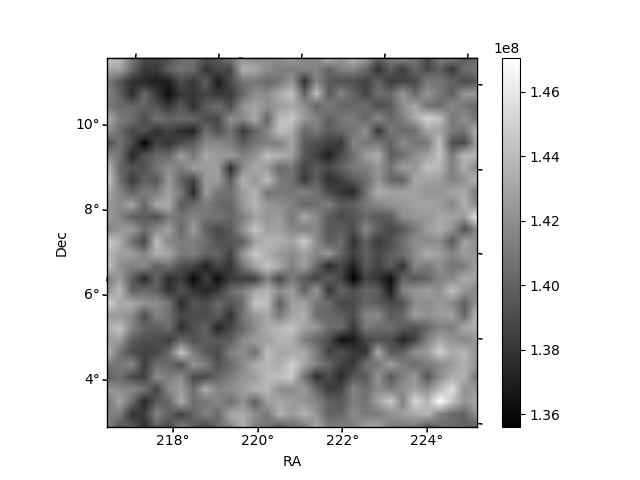
Histogram calculated using DETX and DETY for each event in the final _common_clean file
| Quadrant A | 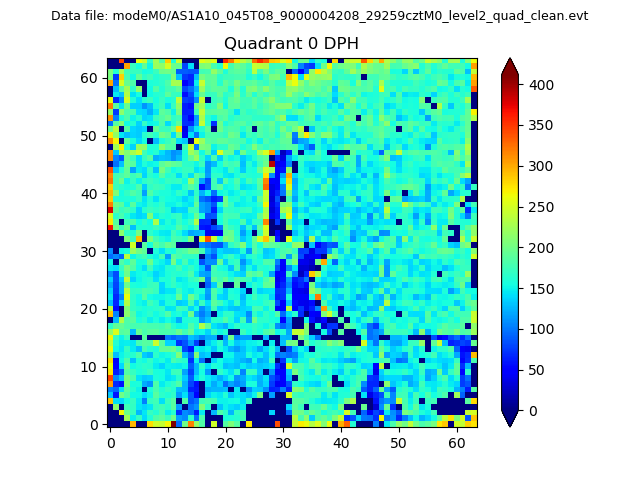 |
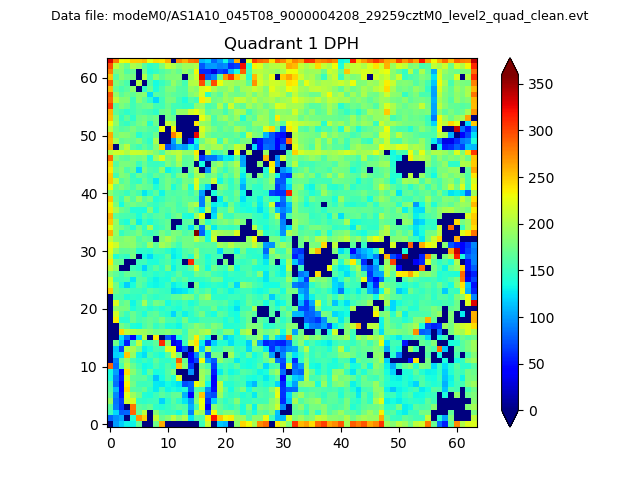 |
Quadrant B |
|---|---|---|---|
| Quadrant D | 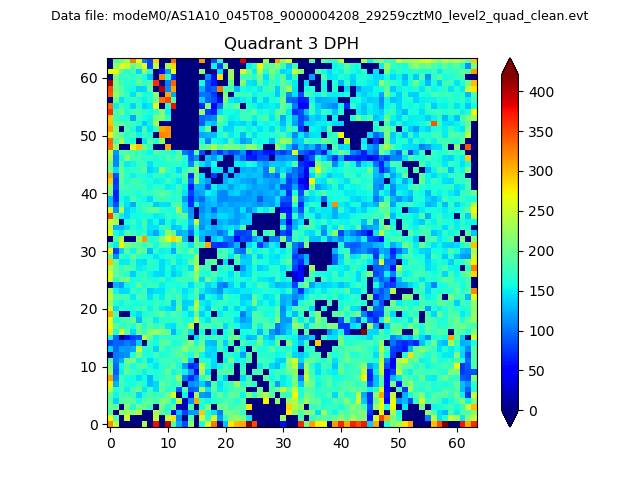 |
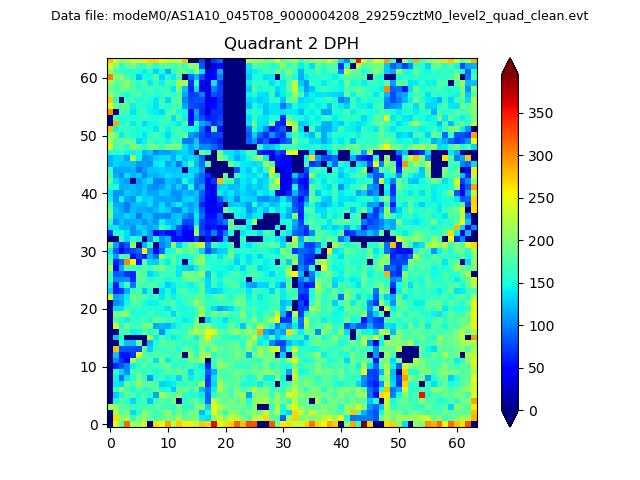 |
Quadrant C |
| Plot type | Count rate plots | Images |
|---|---|---|
| Comparison with Poisson distribution Blue bars denote a histogram of data divided into 1 sec bins. Red curve is a Poisson curve with rate = median count rate of data. |
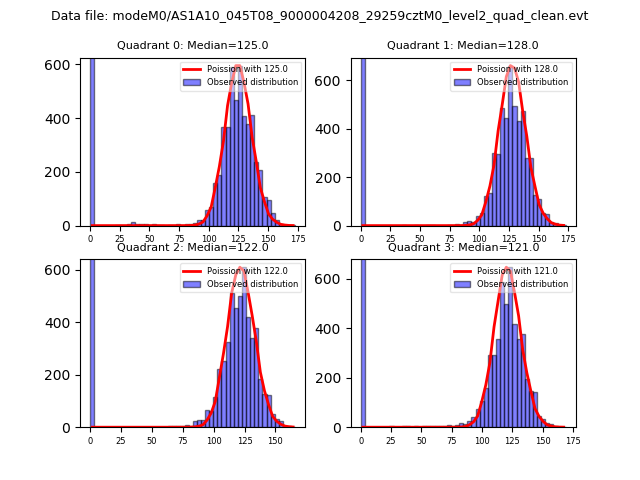 |
 |
| Quadrant-wise count rates Data is divided into 100 sec bins |
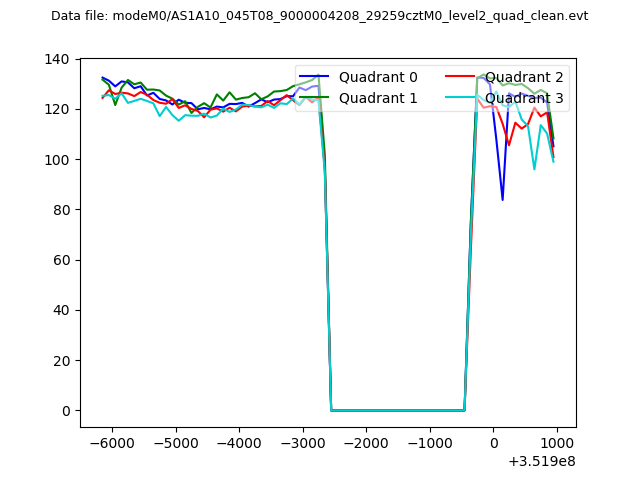 |
|
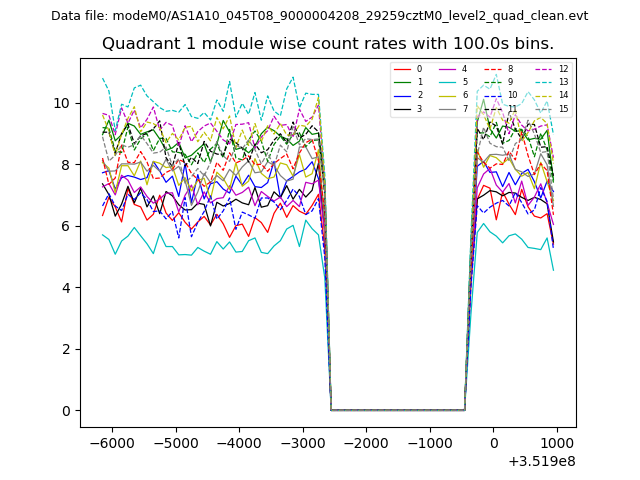
| Module-wise count rates for Quadrant A Data is divided into 100 sec bins |
 |
 |
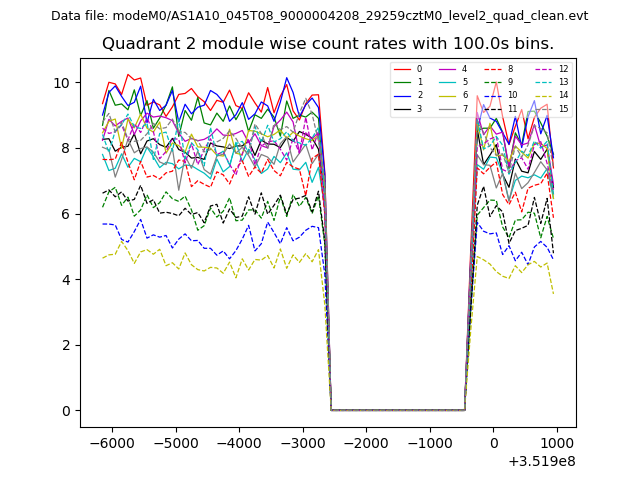
| Module-wise count rates for Quadrant B Data is divided into 100 sec bins |
 |
 |
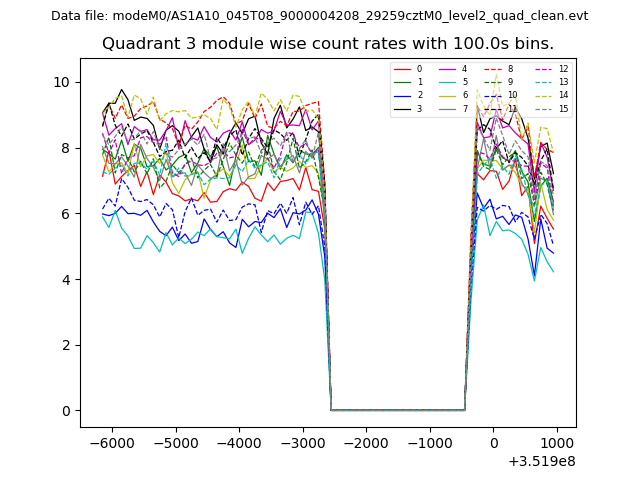
| Module-wise count rates for Quadrant C Data is divided into 100 sec bins |
 |
 |
| Module-wise count rates for Quadrant D Data is divided into 100 sec bins |
 |
 |
| Parameter | Plot |
|---|---|
| CZT HV Monitor | 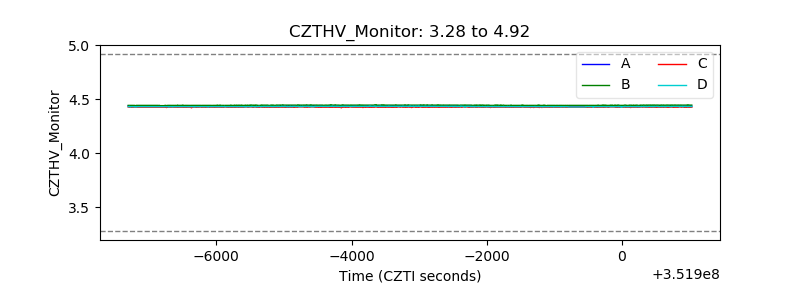 |
| D_VDD | 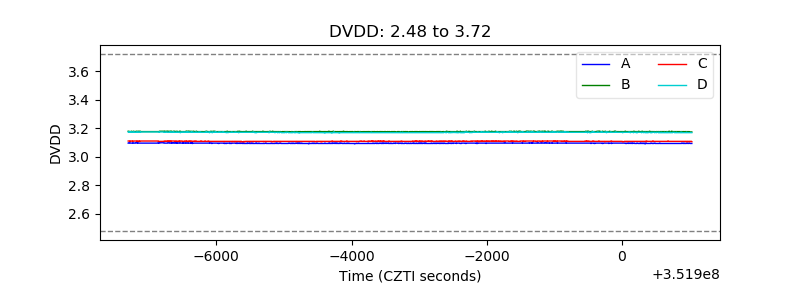 |
| Temperature 1 | 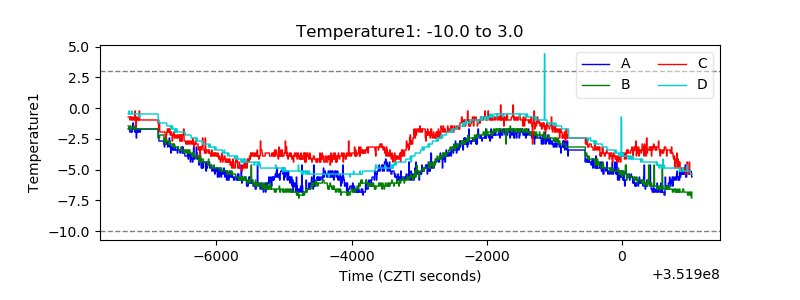 |
| Veto HV Monitor | 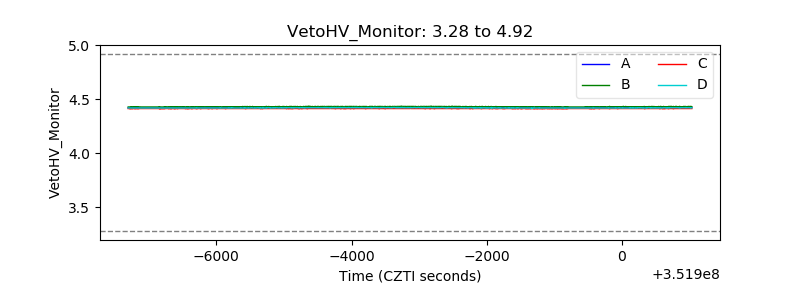 |
| Veto LLD | 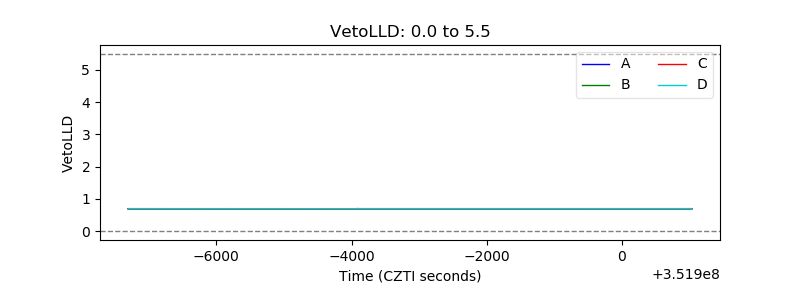 |
| Alpha Counter | 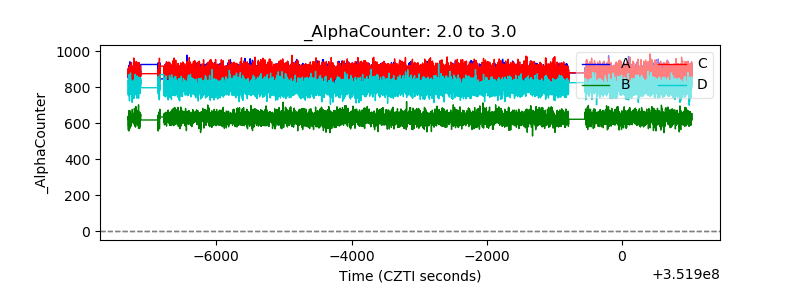 |
| _CPM_Rate | 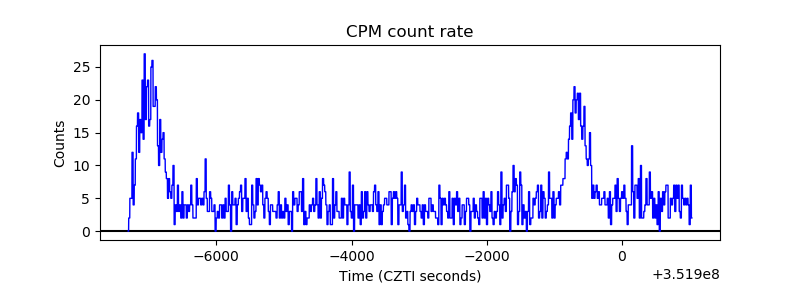 |
| CZT Counter | 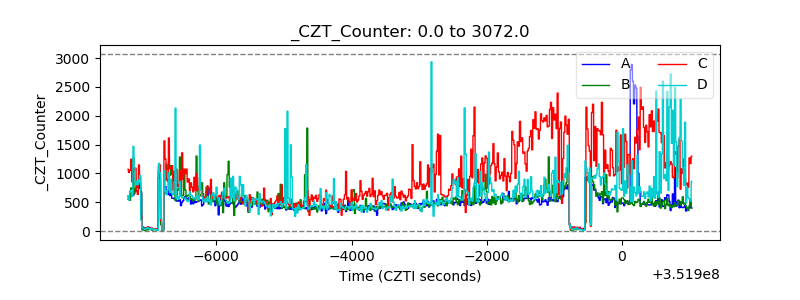 |
| +2.5 Volts monitor |  |
| +5 Volts monitor |  |
| _ROLL_ROT | 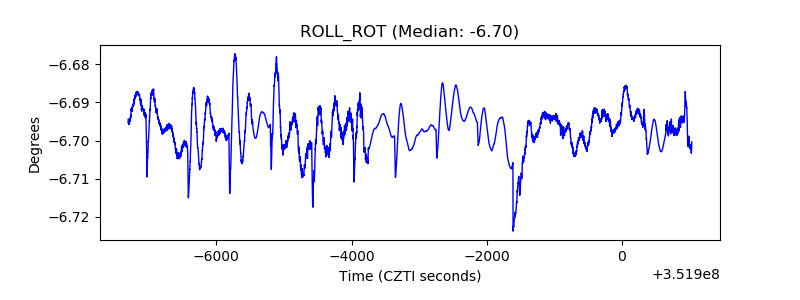 |
| _Roll_DEC | 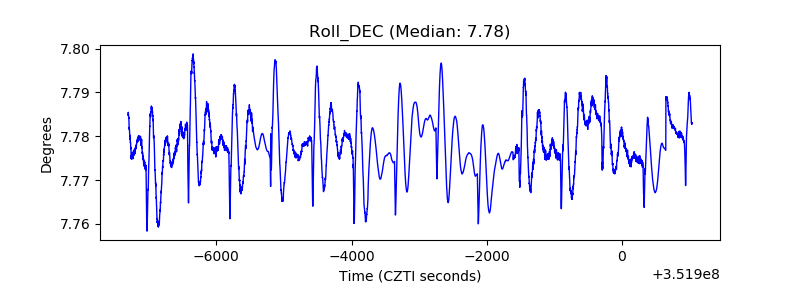 |
| _Roll_RA | 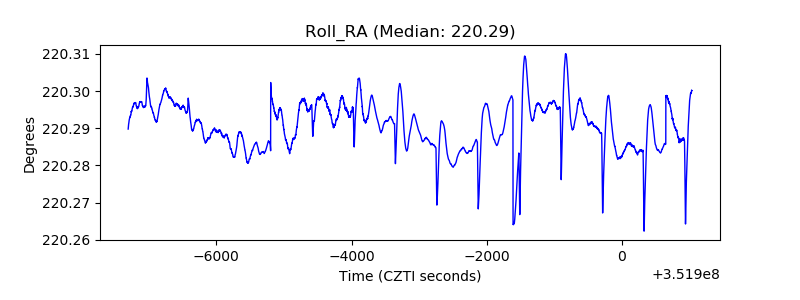 |
| Veto Counter | 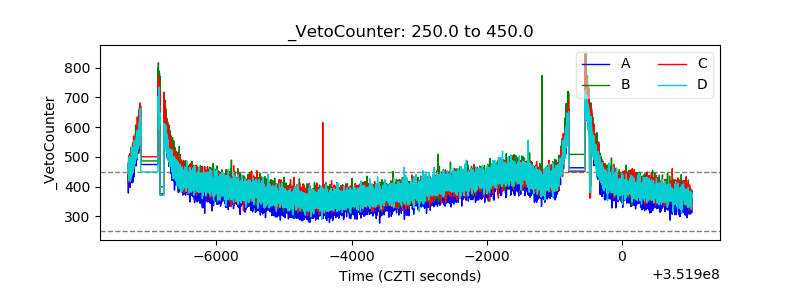 |