| Param | Original file | Final file |
|---|---|---|
| Filename | modeM0/AS1A10_045T08_9000004208_29265cztM0_level2.evt | modeM0/AS1A10_045T08_9000004208_29265cztM0_level2_quad_clean.evt |
| Size (bytes) | 2,550,769,920 | 319,276,800 |
| Size | 2.4 GB | 304.5 MB |
| Events in quadrant A | 13,068,510 | 1,997,439 |
| Events in quadrant B | 14,097,660 | 2,037,190 |
| Events in quadrant C | 22,589,417 | 1,897,215 |
| Events in quadrant D | 25,692,124 | 1,893,601 |
| Mode SS | |||
|---|---|---|---|
| Quadrant | BADHDUFLAG | Total packets | Discarded packets |
| A | 0 | 546 | 0 |
| B | 0 | 546 | 0 |
| C | 0 | 546 | 0 |
| D | 0 | 546 | 0 |
| Mode M0 | |||
|---|---|---|---|
| Quadrant | BADHDUFLAG | Total packets | Discarded packets |
| A | 0 | 55782 | 4 |
| B | 0 | 59328 | 4 |
| C | 0 | 86416 | 4 |
| D | 0 | 94731 | 4 |
| Mode M9 | |||
|---|---|---|---|
| Quadrant | BADHDUFLAG | Total packets | Discarded packets |
| A | 0 | 33 | 0 |
| B | 0 | 33 | 0 |
| C | 0 | 33 | 0 |
| D | 0 | 33 | 0 |
| Quadrant | Total seconds | Saturated seconds | Saturation percentage |
|---|---|---|---|
| A | 26812 | 241 | 0.898851% |
| B | 26813 | 368 | 1.372469% |
| C | 26813 | 2285 | 8.521986% |
| D | 26812 | 2889 | 10.775026% |
Noise dominated data is calculated using 1-second bins in cleaned event files. If a bin has >2000 counts, and if more than 50% of those come from <1% of pixels, then it is considered to be noise-dominated and hence unusable.
| Quadrant | # 1 sec bins | Bins with >0 counts | Bins with >2000 counts | High rate bins dominated by noise | Noise dominated (total time) | Noise dominated (detector-on time) | Marked lightcurve |
|---|---|---|---|---|---|---|---|
| A | 32448 | 26818 | 72 | 72 | 0.22% | 0.27% | 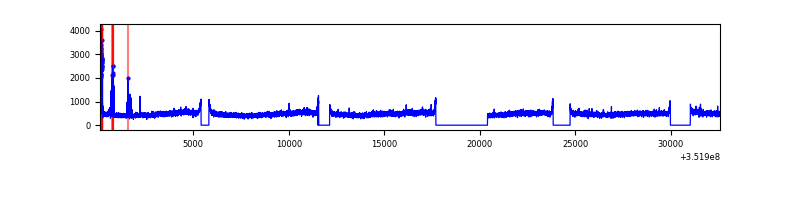 |
| B | 32449 | 26819 | 60 | 60 | 0.18% | 0.22% | 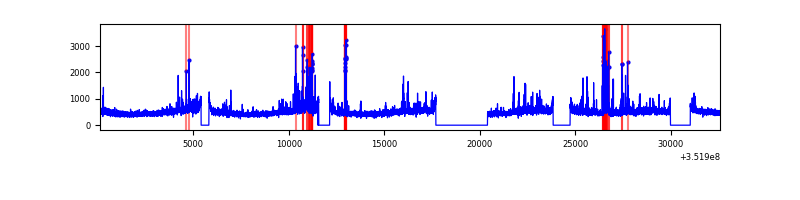 |
| C | 32449 | 26817 | 133 | 133 | 0.41% | 0.50% | 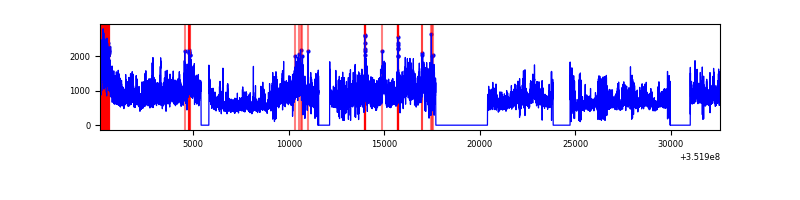 |
| D | 32448 | 26818 | 2131 | 2131 | 6.57% | 7.95% | 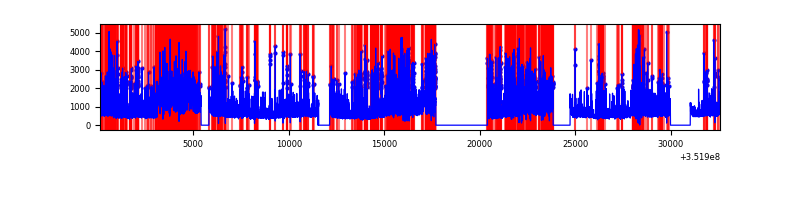 |
Top three noisy pixels from each quadrant. If the there are fewer than three noisy pixels in the level2.evt file, extra rows are filled as -1
| Pixel properties | Quadrant properties | ||||||
|---|---|---|---|---|---|---|---|
| Quadrant | DetID | PixID | Counts | Sigma | Mean | Median | Sigma |
| A | 15 | 174 | 311263 | 468.48 | 3287 | 3219 | 657.5 |
| A | 1 | 113 | 69533 | 100.85 | 3287 | 3219 | 657.5 |
| A | 13 | 254 | 49085 | 69.75 | 3287 | 3219 | 657.5 |
| B | 0 | 229 | 448563 | 715.78 | 3255 | 3168 | 622.3 |
| B | 10 | 245 | 351671 | 560.07 | 3255 | 3168 | 622.3 |
| B | 0 | 183 | 204183 | 323.04 | 3255 | 3168 | 622.3 |
| C | 3 | 233 | 9247036 | 12955.75 | 3065 | 3092 | 713.5 |
| C | 14 | 238 | 795243 | 1110.23 | 3065 | 3092 | 713.5 |
| C | 14 | 254 | 440303 | 612.77 | 3065 | 3092 | 713.5 |
| D | 1 | 52 | 8474852 | 10655.04 | 3043 | 2995 | 795.1 |
| D | 8 | 195 | 2825458 | 3549.81 | 3043 | 2995 | 795.1 |
| D | 7 | 223 | 1305581 | 1638.26 | 3043 | 2995 | 795.1 |
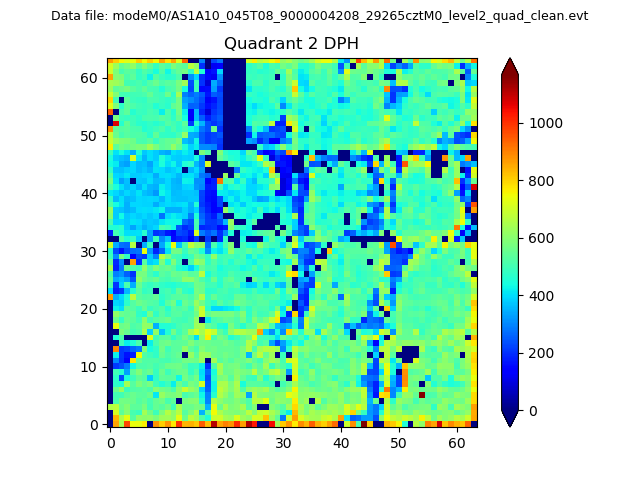
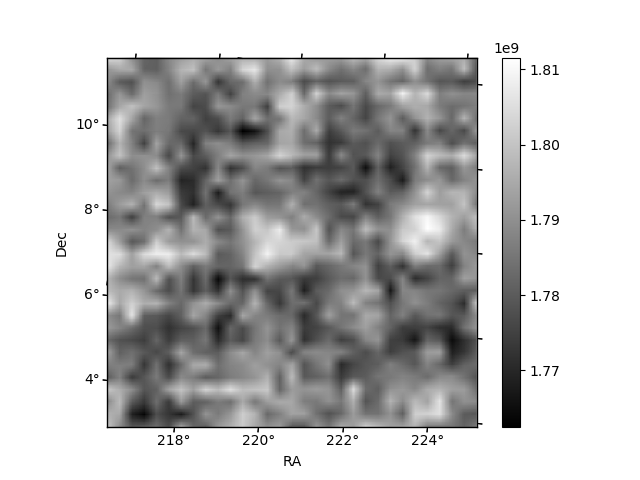
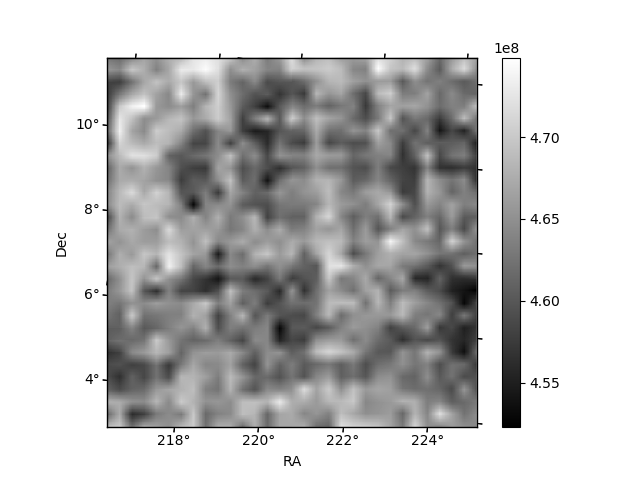
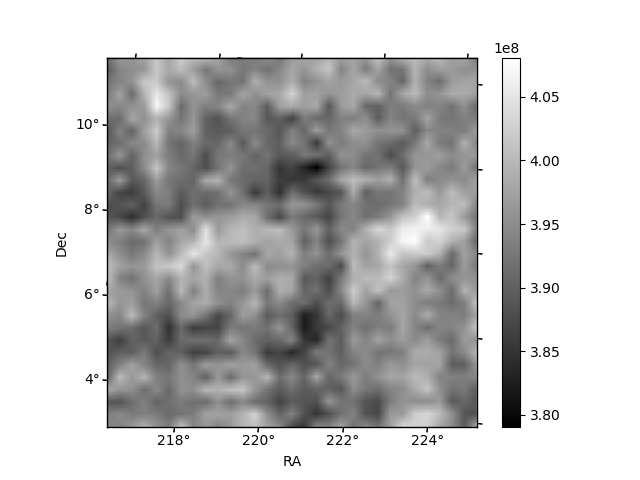
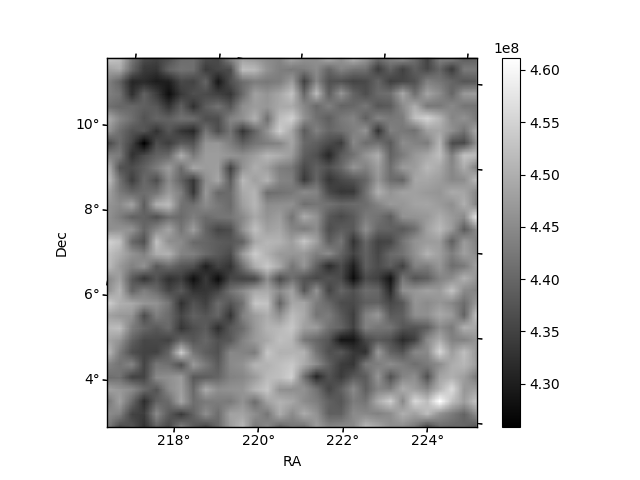
Histogram calculated using DETX and DETY for each event in the final _common_clean file
| Quadrant A | 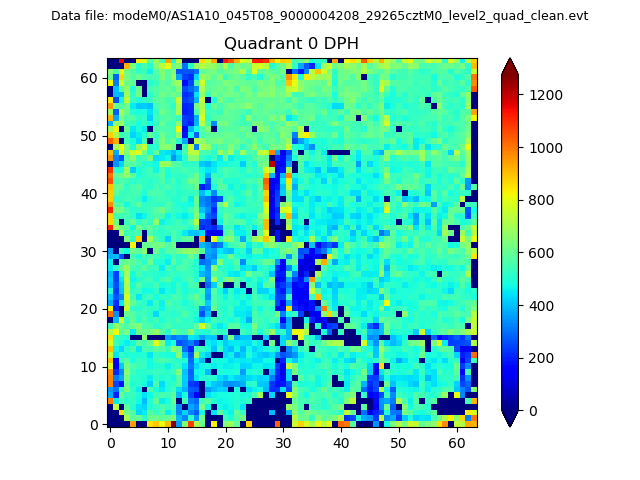 |
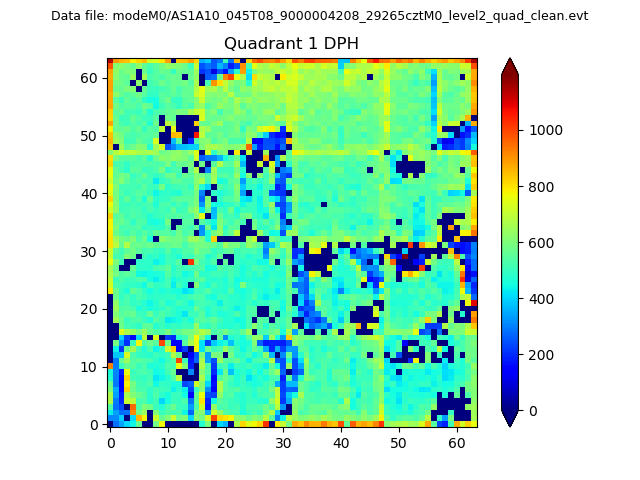 |
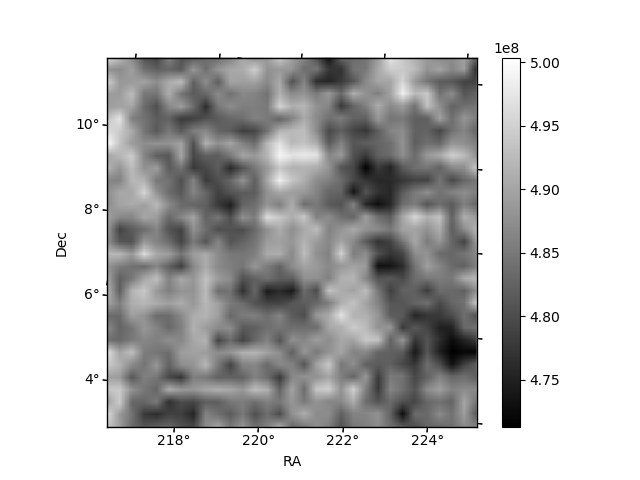
Quadrant B |
|---|---|---|---|
| Quadrant D | 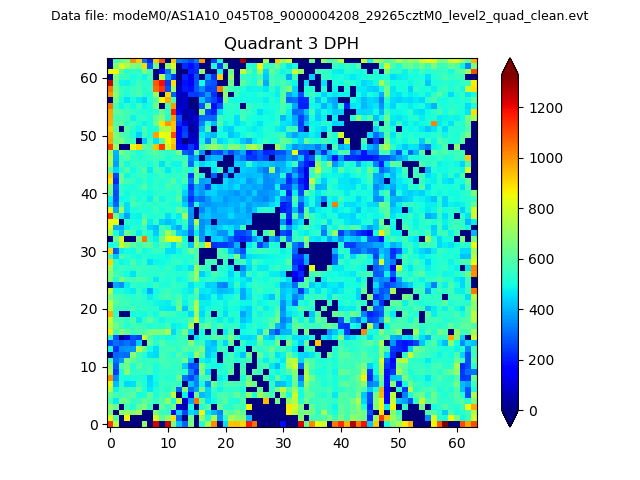 |
 |
Quadrant C |
| Plot type | Count rate plots | Images |
|---|---|---|
| Comparison with Poisson distribution Blue bars denote a histogram of data divided into 1 sec bins. Red curve is a Poisson curve with rate = median count rate of data. |
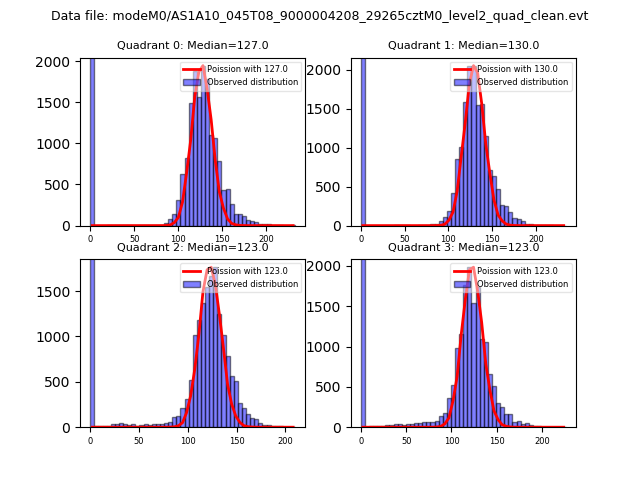 |
 |
| Quadrant-wise count rates Data is divided into 100 sec bins |
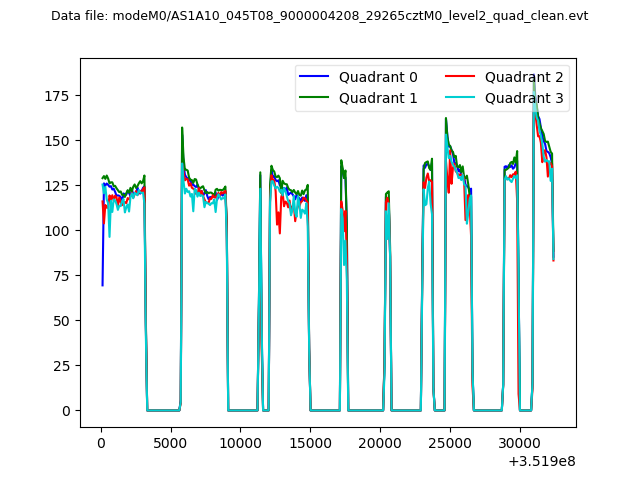 |
|
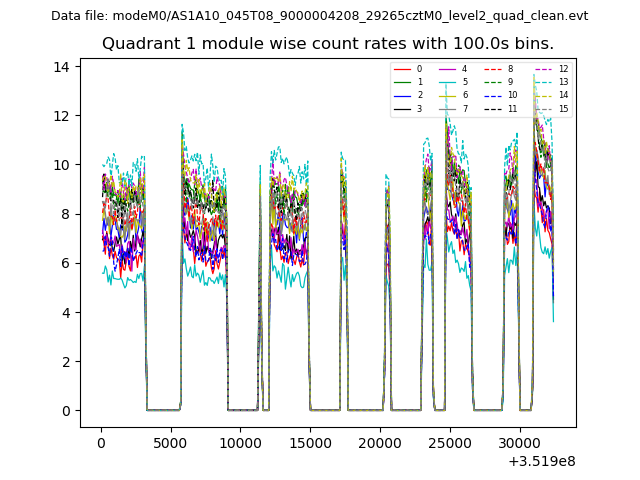
| Module-wise count rates for Quadrant A Data is divided into 100 sec bins |
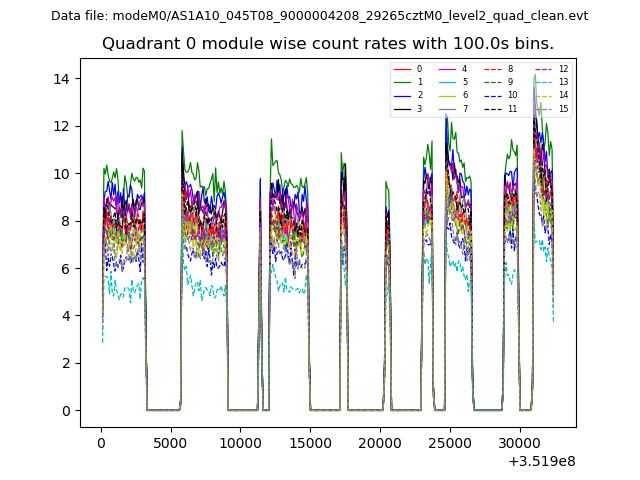 |
 |
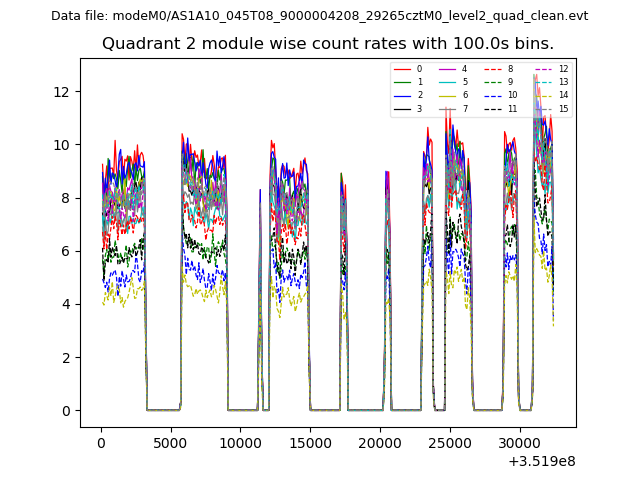
| Module-wise count rates for Quadrant B Data is divided into 100 sec bins |
 |
 |
| Module-wise count rates for Quadrant C Data is divided into 100 sec bins |
 |
 |
| Module-wise count rates for Quadrant D Data is divided into 100 sec bins |
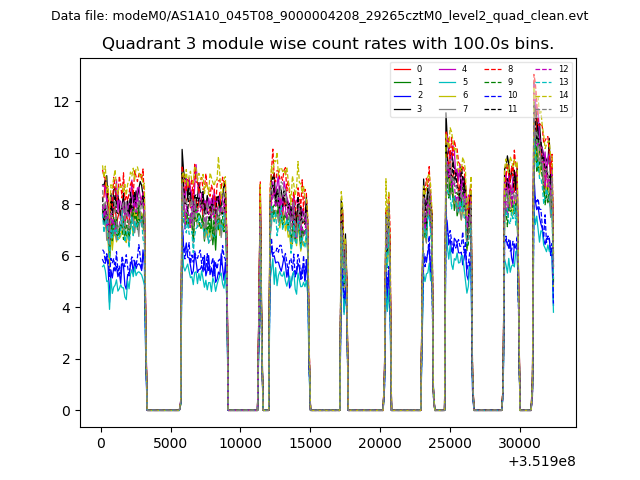 |
 |
| Parameter | Plot |
|---|---|
| CZT HV Monitor | 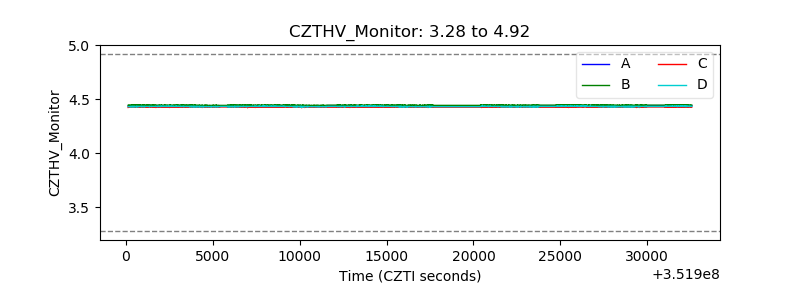 |
| D_VDD | 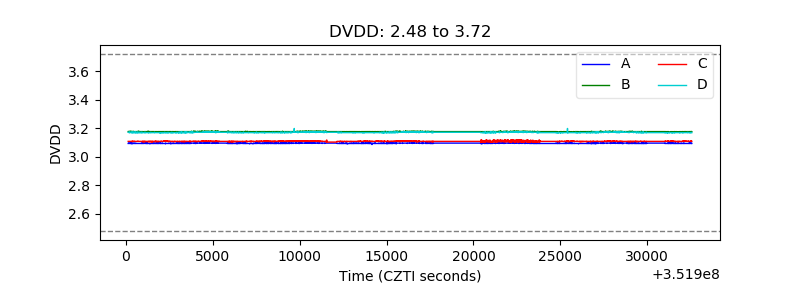 |
| Temperature 1 | 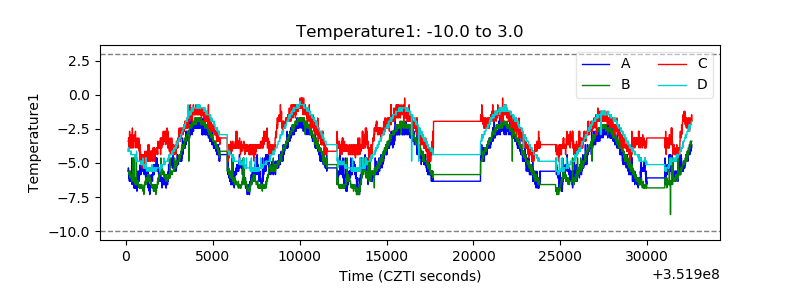 |
| Veto HV Monitor | 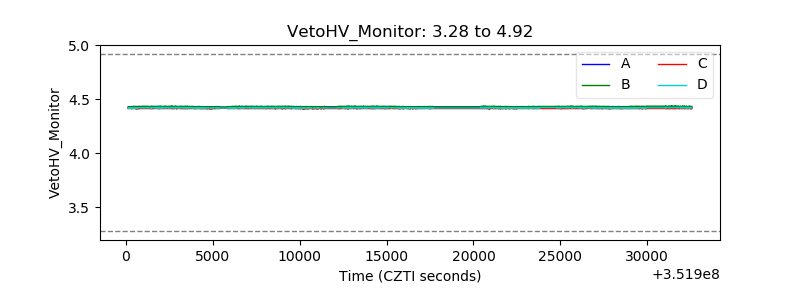 |
| Veto LLD | 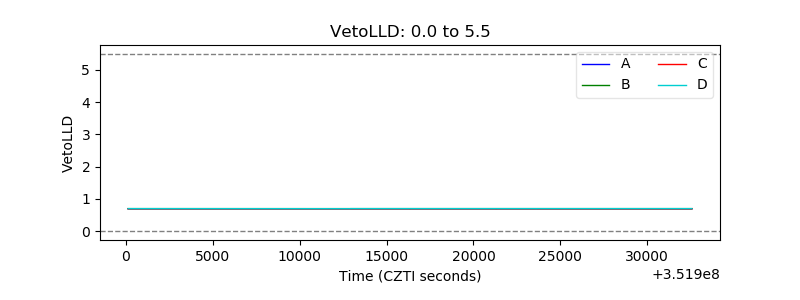 |
| Alpha Counter | 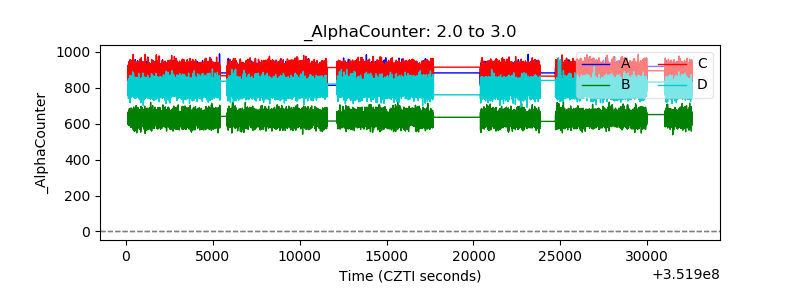 |
| _CPM_Rate | 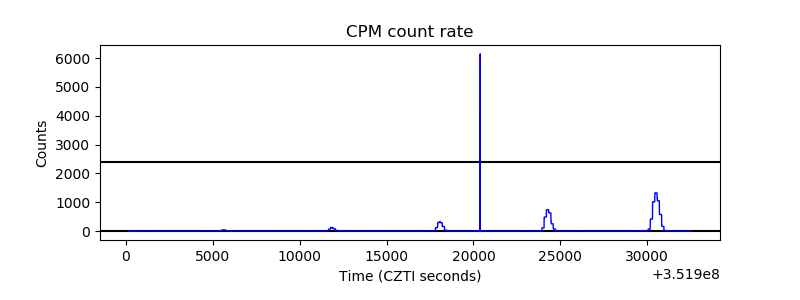 |
| CZT Counter | 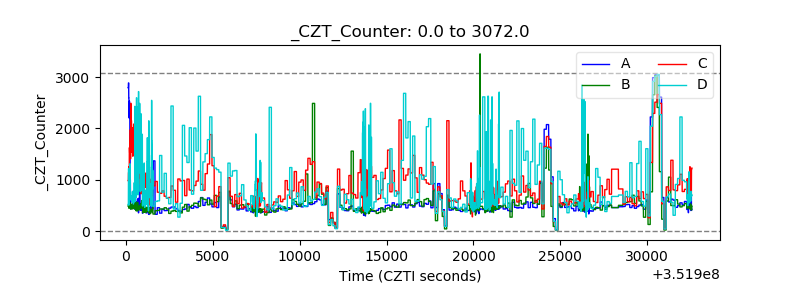 |
| +2.5 Volts monitor |  |
| +5 Volts monitor |  |
| _ROLL_ROT | 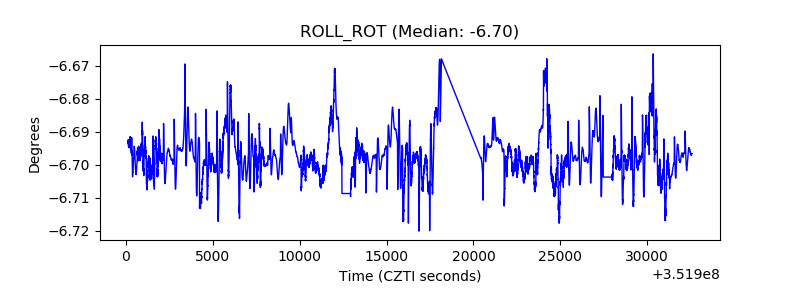 |
| _Roll_DEC | 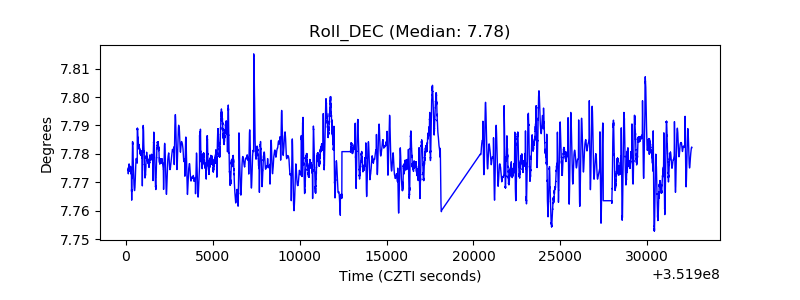 |
| _Roll_RA | 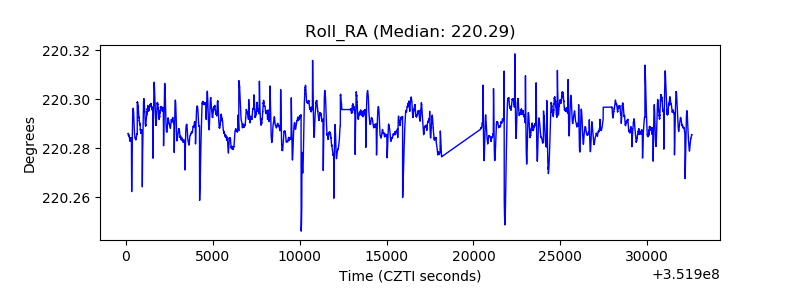 |
| Veto Counter | 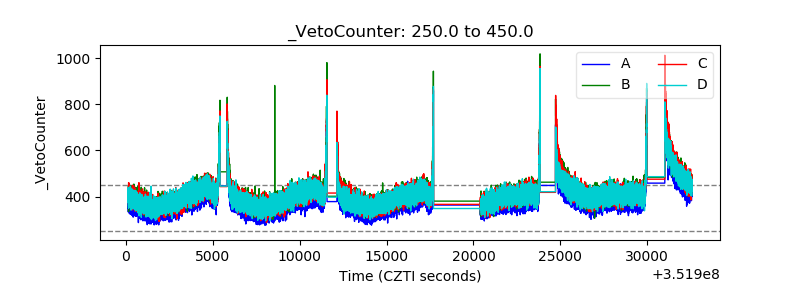 |