| Param | Original file | Final file |
|---|---|---|
| Filename | modeM0/AS1A10_045T08_9000004208_29266cztM0_level2.evt | modeM0/AS1A10_045T08_9000004208_29266cztM0_level2_quad_clean.evt |
| Size (bytes) | 3,160,739,520 | 415,869,120 |
| Size | 2.9 GB | 396.6 MB |
| Events in quadrant A | 16,411,584 | 2,621,064 |
| Events in quadrant B | 17,809,908 | 2,671,890 |
| Events in quadrant C | 28,644,776 | 2,492,017 |
| Events in quadrant D | 30,598,306 | 2,500,878 |
| Mode SS | |||
|---|---|---|---|
| Quadrant | BADHDUFLAG | Total packets | Discarded packets |
| A | 0 | 684 | 0 |
| B | 0 | 684 | 0 |
| C | 0 | 684 | 0 |
| D | 0 | 684 | 0 |
| Mode M0 | |||
|---|---|---|---|
| Quadrant | BADHDUFLAG | Total packets | Discarded packets |
| A | 0 | 69982 | 6 |
| B | 0 | 74593 | 6 |
| C | 0 | 109349 | 9 |
| D | 0 | 113815 | 6 |
| Mode M9 | |||
|---|---|---|---|
| Quadrant | BADHDUFLAG | Total packets | Discarded packets |
| A | 0 | 48 | 0 |
| B | 0 | 48 | 0 |
| C | 0 | 48 | 0 |
| D | 0 | 48 | 0 |
| Quadrant | Total seconds | Saturated seconds | Saturation percentage |
|---|---|---|---|
| A | 33612 | 296 | 0.880638% |
| B | 33613 | 430 | 1.279267% |
| C | 33612 | 2668 | 7.937641% |
| D | 33612 | 3065 | 9.118767% |
Noise dominated data is calculated using 1-second bins in cleaned event files. If a bin has >2000 counts, and if more than 50% of those come from <1% of pixels, then it is considered to be noise-dominated and hence unusable.
| Quadrant | # 1 sec bins | Bins with >0 counts | Bins with >2000 counts | High rate bins dominated by noise | Noise dominated (total time) | Noise dominated (detector-on time) | Marked lightcurve |
|---|---|---|---|---|---|---|---|
| A | 38442 | 33619 | 72 | 72 | 0.19% | 0.21% | 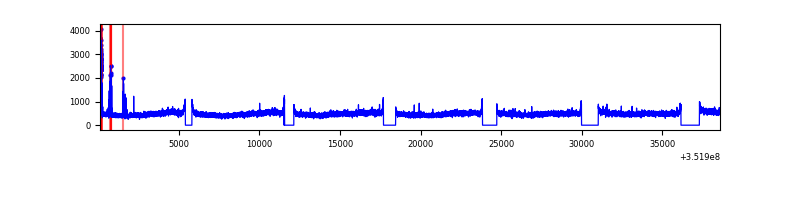 |
| B | 38443 | 33620 | 61 | 61 | 0.16% | 0.18% | 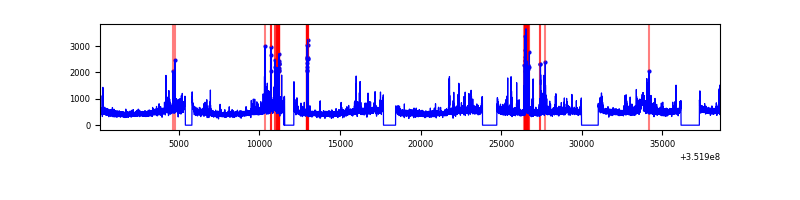 |
| C | 38442 | 33617 | 170 | 170 | 0.44% | 0.51% | 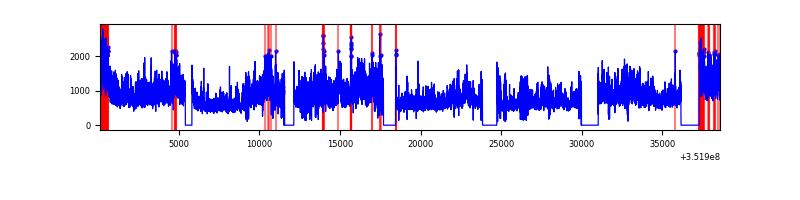 |
| D | 38442 | 33619 | 2257 | 2257 | 5.87% | 6.71% | 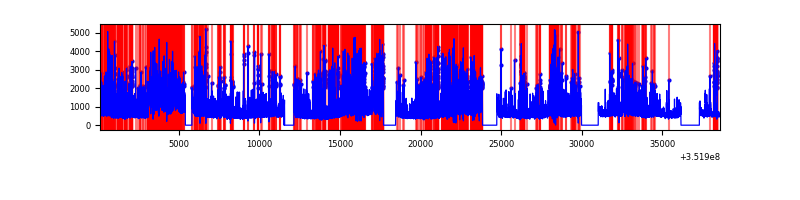 |
Top three noisy pixels from each quadrant. If the there are fewer than three noisy pixels in the level2.evt file, extra rows are filled as -1
| Pixel properties | Quadrant properties | ||||||
|---|---|---|---|---|---|---|---|
| Quadrant | DetID | PixID | Counts | Sigma | Mean | Median | Sigma |
| A | 15 | 174 | 314098 | 374.34 | 4152 | 4059 | 828.2 |
| A | 1 | 113 | 71738 | 81.72 | 4152 | 4059 | 828.2 |
| A | 13 | 254 | 62365 | 70.4 | 4152 | 4059 | 828.2 |
| B | 10 | 245 | 581144 | 734.04 | 4113 | 4008 | 786.3 |
| B | 0 | 229 | 492811 | 621.69 | 4113 | 4008 | 786.3 |
| B | 0 | 183 | 263537 | 330.08 | 4113 | 4008 | 786.3 |
| C | 3 | 233 | 11891611 | 13262.91 | 3880 | 3917 | 896.3 |
| C | 14 | 238 | 956547 | 1062.83 | 3880 | 3917 | 896.3 |
| C | 14 | 254 | 485327 | 537.1 | 3880 | 3917 | 896.3 |
| D | 1 | 52 | 9514825 | 9393.53 | 3874 | 3806 | 1012.5 |
| D | 8 | 195 | 3372999 | 3327.57 | 3874 | 3806 | 1012.5 |
| D | 7 | 223 | 1306676 | 1286.78 | 3874 | 3806 | 1012.5 |
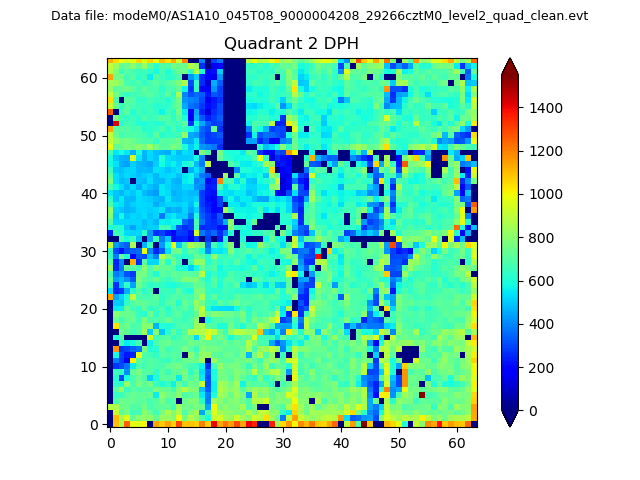
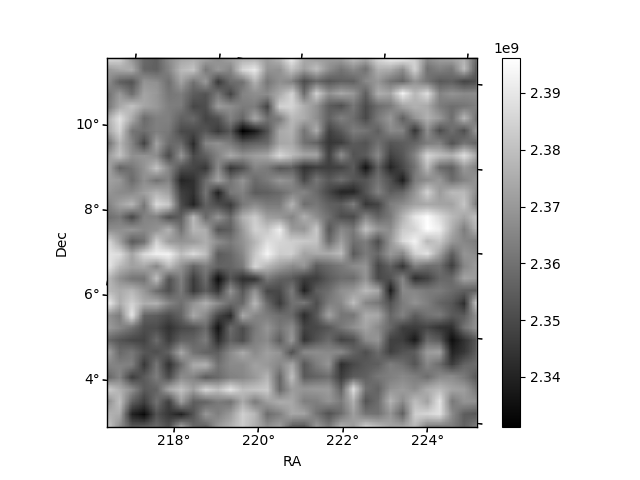
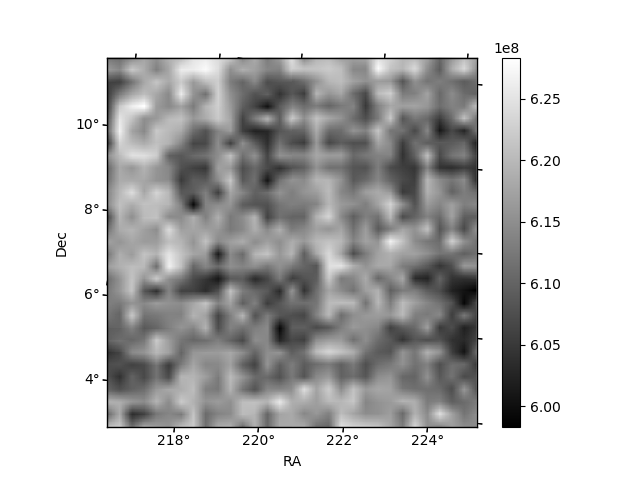
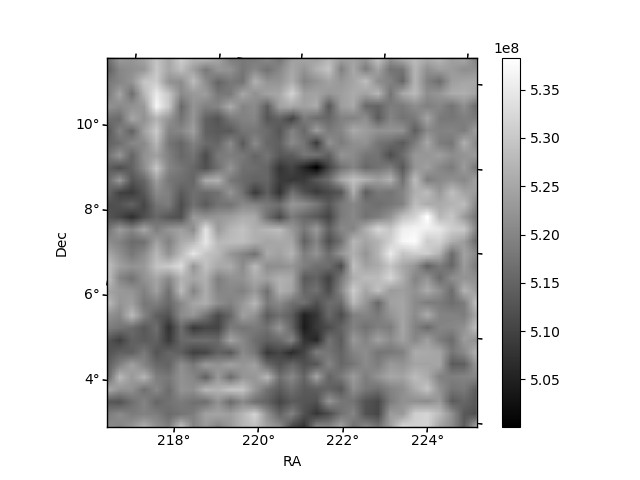
Histogram calculated using DETX and DETY for each event in the final _common_clean file
| Quadrant A | 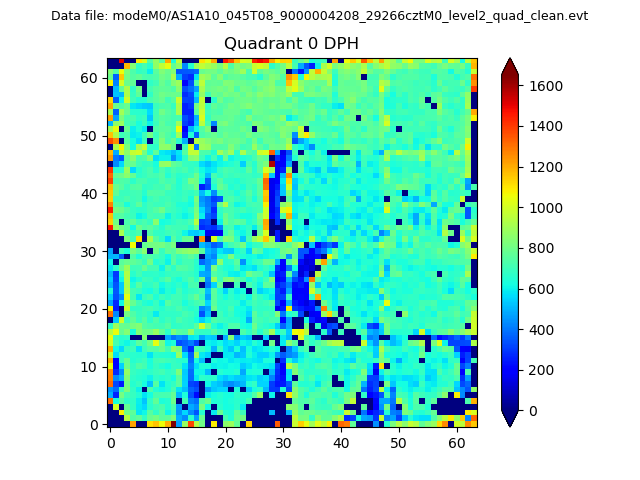 |
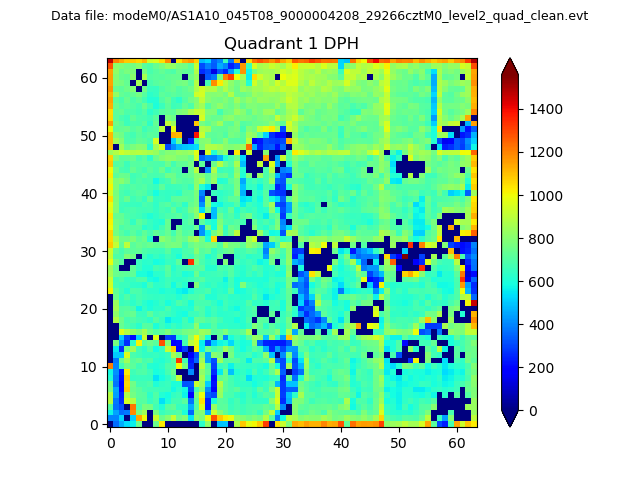 |
Quadrant B |
|---|---|---|---|
| Quadrant D | 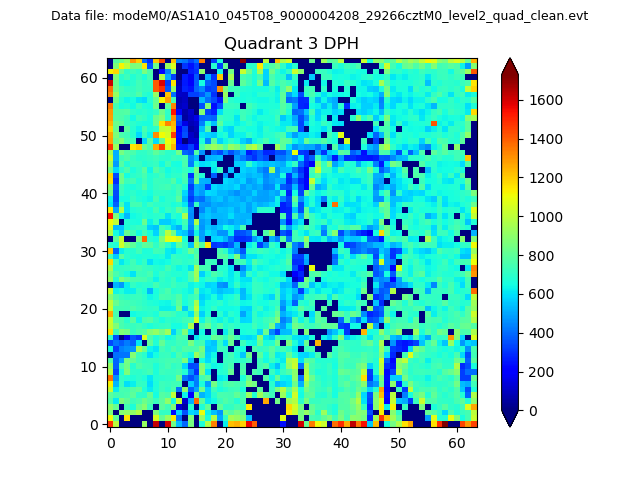 |
 |
Quadrant C |
| Plot type | Count rate plots | Images |
|---|---|---|
| Comparison with Poisson distribution Blue bars denote a histogram of data divided into 1 sec bins. Red curve is a Poisson curve with rate = median count rate of data. |
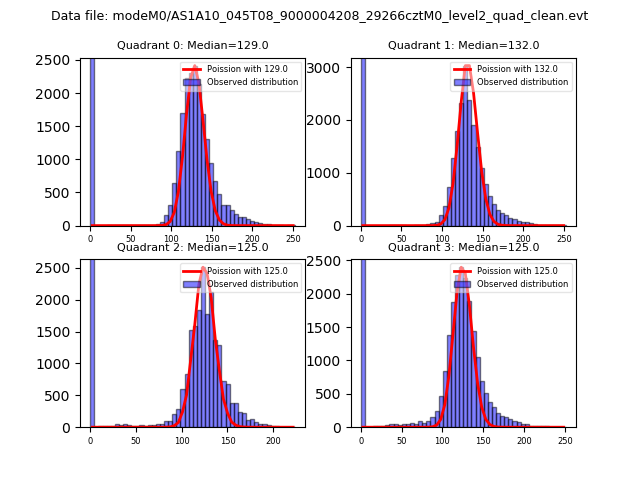 |
 |
| Quadrant-wise count rates Data is divided into 100 sec bins |
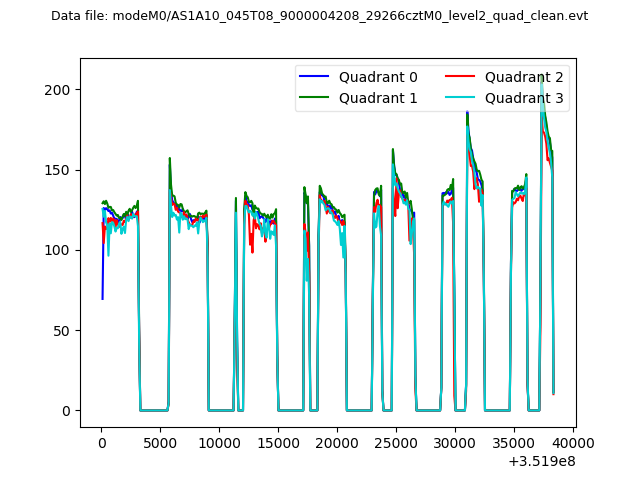 |
|
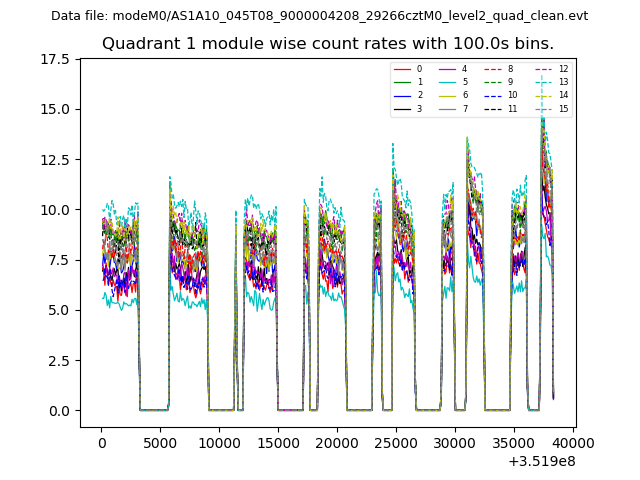
| Module-wise count rates for Quadrant A Data is divided into 100 sec bins |
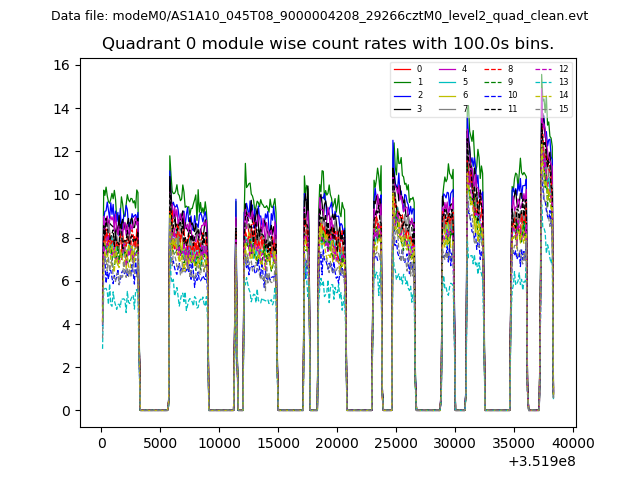 |
 |
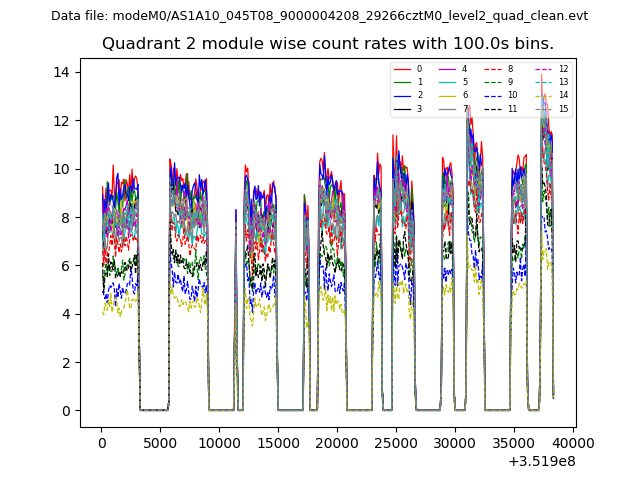
| Module-wise count rates for Quadrant B Data is divided into 100 sec bins |
 |
 |
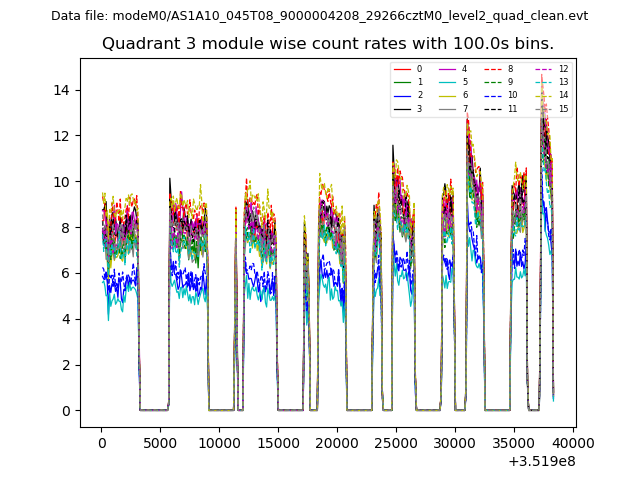
| Module-wise count rates for Quadrant C Data is divided into 100 sec bins |
 |
 |
| Module-wise count rates for Quadrant D Data is divided into 100 sec bins |
 |
 |
| Parameter | Plot |
|---|---|
| CZT HV Monitor | 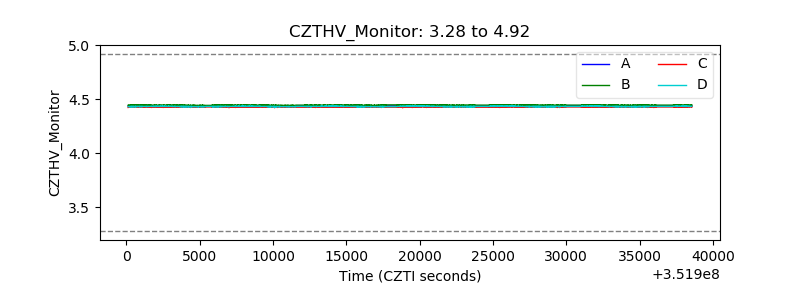 |
| D_VDD | 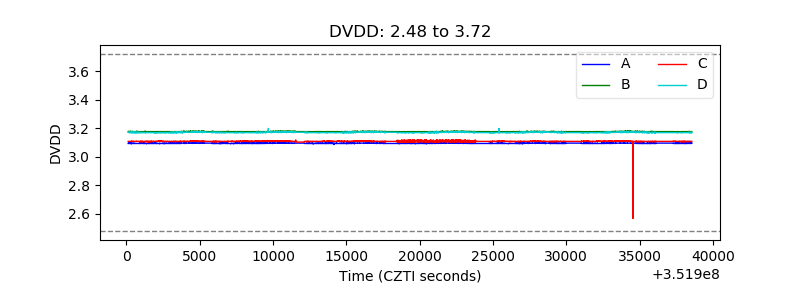 |
| Temperature 1 | 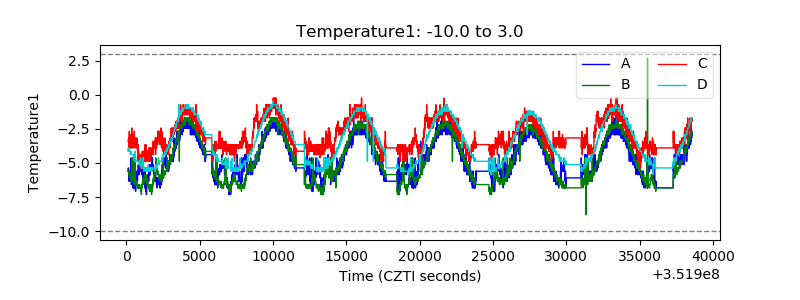 |
| Veto HV Monitor | 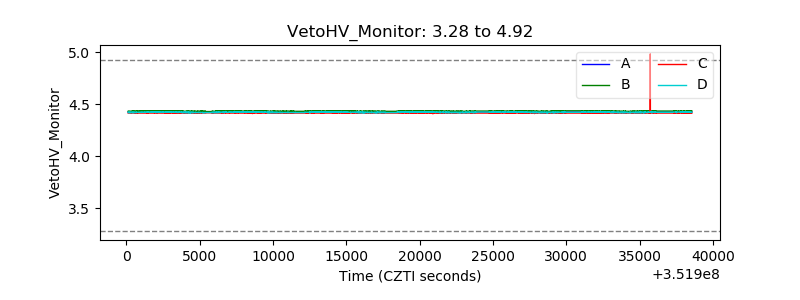 |
| Veto LLD | 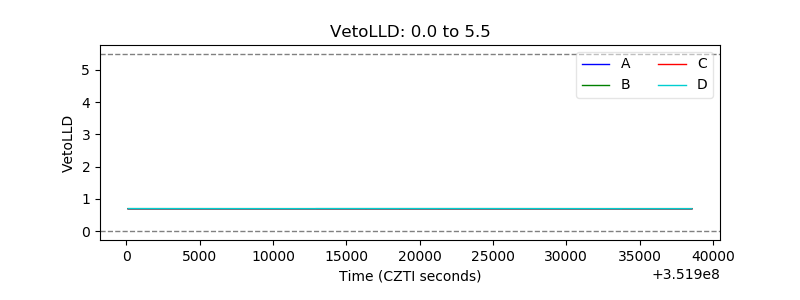 |
| Alpha Counter | 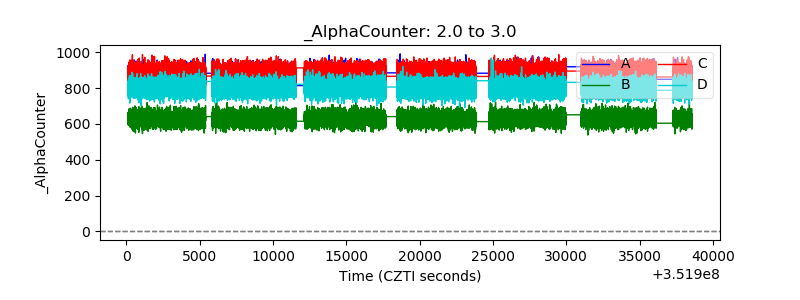 |
| _CPM_Rate | 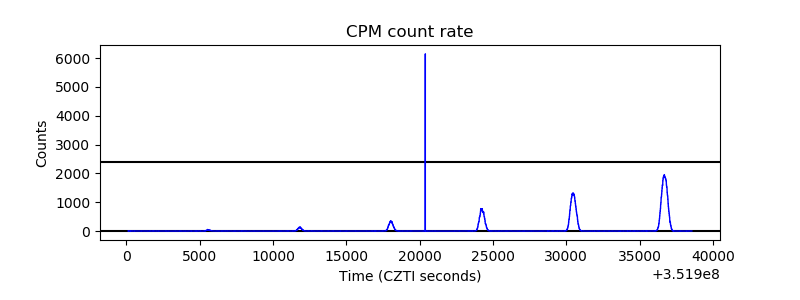 |
| CZT Counter | 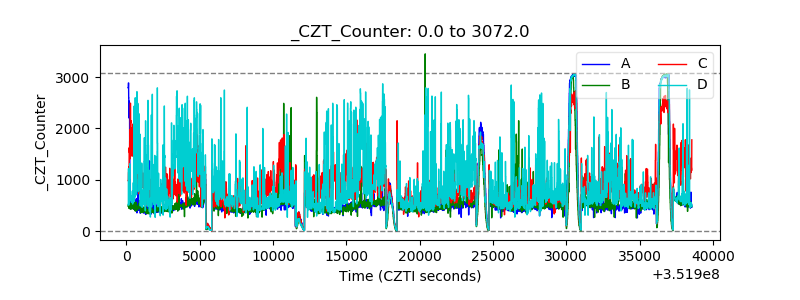 |
| +2.5 Volts monitor |  |
| +5 Volts monitor |  |
| _ROLL_ROT | 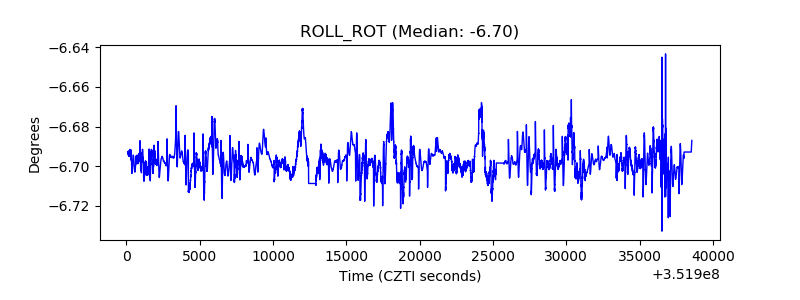 |
| _Roll_DEC | 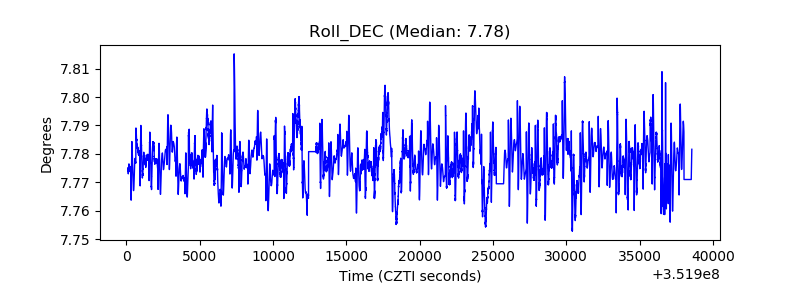 |
| _Roll_RA | 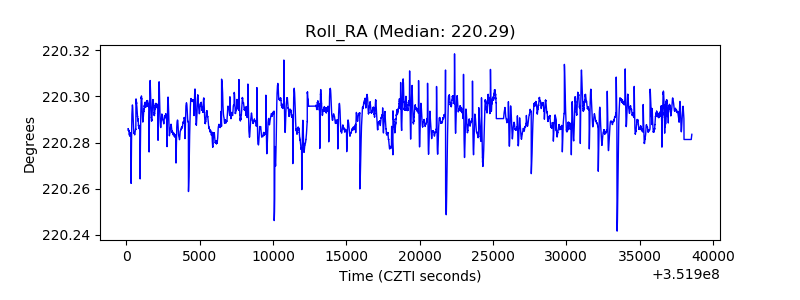 |
| Veto Counter | 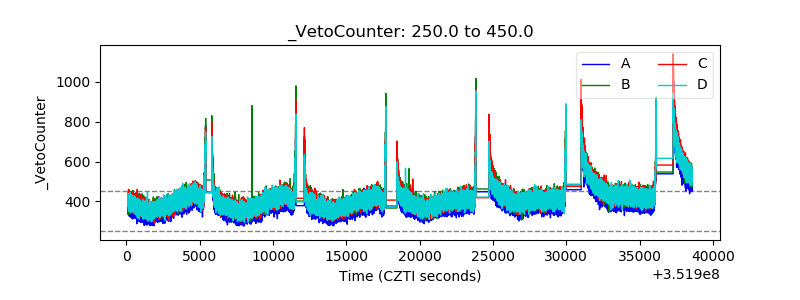 |