| Param | Original file | Final file |
|---|---|---|
| Filename | modeM0/AS1A10_045T08_9000004208_29267cztM0_level2.evt | modeM0/AS1A10_045T08_9000004208_29267cztM0_level2_quad_clean.evt |
| Size (bytes) | 626,310,720 | 72,164,160 |
| Size | 597.3 MB | 68.8 MB |
| Events in quadrant A | 3,168,904 | 466,709 |
| Events in quadrant B | 3,838,121 | 472,331 |
| Events in quadrant C | 7,549,081 | 383,067 |
| Events in quadrant D | 4,011,509 | 448,949 |
| Mode SS | |||
|---|---|---|---|
| Quadrant | BADHDUFLAG | Total packets | Discarded packets |
| A | 0 | 122 | 0 |
| B | 0 | 122 | 0 |
| C | 0 | 122 | 0 |
| D | 0 | 122 | 0 |
| Mode M0 | |||
|---|---|---|---|
| Quadrant | BADHDUFLAG | Total packets | Discarded packets |
| A | 0 | 12882 | 1 |
| B | 0 | 15322 | 1 |
| C | 0 | 26644 | 1 |
| D | 0 | 15653 | 2 |
| Mode M9 | |||
|---|---|---|---|
| Quadrant | BADHDUFLAG | Total packets | Discarded packets |
| A | 0 | 12 | 0 |
| B | 0 | 12 | 0 |
| C | 0 | 12 | 0 |
| D | 0 | 12 | 0 |
| Quadrant | Total seconds | Saturated seconds | Saturation percentage |
|---|---|---|---|
| A | 5913 | 71 | 1.200744% |
| B | 5914 | 103 | 1.741630% |
| C | 5914 | 1638 | 27.696990% |
| D | 5913 | 184 | 3.111788% |
Noise dominated data is calculated using 1-second bins in cleaned event files. If a bin has >2000 counts, and if more than 50% of those come from <1% of pixels, then it is considered to be noise-dominated and hence unusable.
| Quadrant | # 1 sec bins | Bins with >0 counts | Bins with >2000 counts | High rate bins dominated by noise | Noise dominated (total time) | Noise dominated (detector-on time) | Marked lightcurve |
|---|---|---|---|---|---|---|---|
| A | 7128 | 5914 | 0 | 0 | 0.00% | 0.00% | 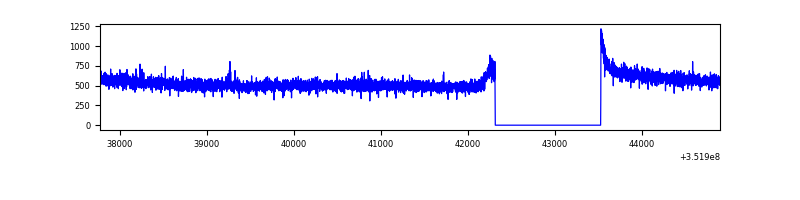 |
| B | 7129 | 5915 | 6 | 6 | 0.08% | 0.10% | 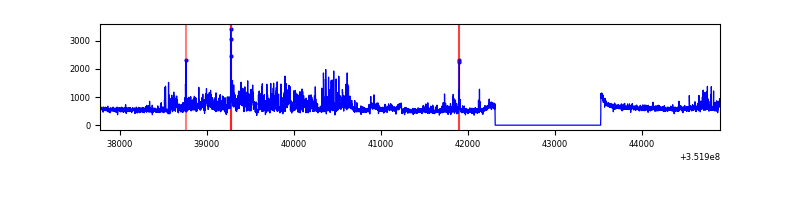 |
| C | 7129 | 5914 | 564 | 564 | 7.91% | 9.54% | 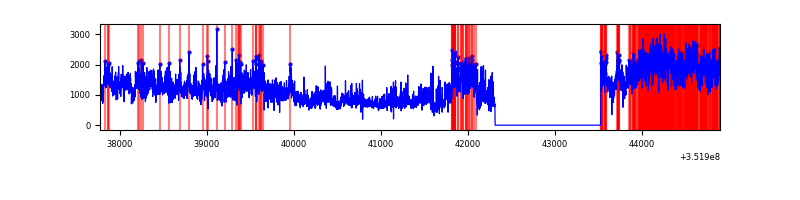 |
| D | 7128 | 5914 | 128 | 128 | 1.80% | 2.16% | 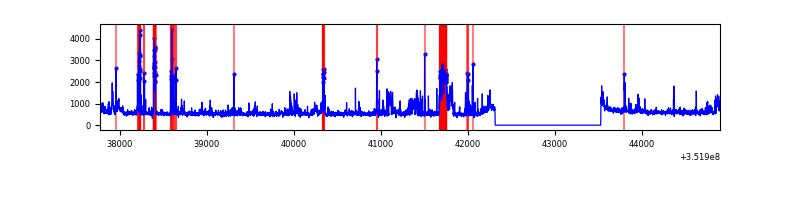 |
Top three noisy pixels from each quadrant. If the there are fewer than three noisy pixels in the level2.evt file, extra rows are filled as -1
| Pixel properties | Quadrant properties | ||||||
|---|---|---|---|---|---|---|---|
| Quadrant | DetID | PixID | Counts | Sigma | Mean | Median | Sigma |
| A | 13 | 254 | 11224 | 64.33 | 820 | 807 | 161.9 |
| A | 3 | 137 | 7287 | 40.02 | 820 | 807 | 161.9 |
| A | 0 | 226 | 6977 | 38.1 | 820 | 807 | 161.9 |
| B | 0 | 183 | 343831 | 2270.02 | 800 | 783 | 151.1 |
| B | 10 | 245 | 182954 | 1205.46 | 800 | 783 | 151.1 |
| B | 0 | 229 | 155813 | 1025.87 | 800 | 783 | 151.1 |
| C | 3 | 233 | 4365462 | 26876.46 | 702 | 710 | 162.4 |
| C | 14 | 238 | 243911 | 1497.54 | 702 | 710 | 162.4 |
| C | 14 | 254 | 188777 | 1158.04 | 702 | 710 | 162.4 |
| D | 1 | 52 | 531899 | 2592.71 | 785 | 773 | 204.9 |
| D | 7 | 238 | 195875 | 952.4 | 785 | 773 | 204.9 |
| D | 8 | 195 | 113336 | 549.48 | 785 | 773 | 204.9 |
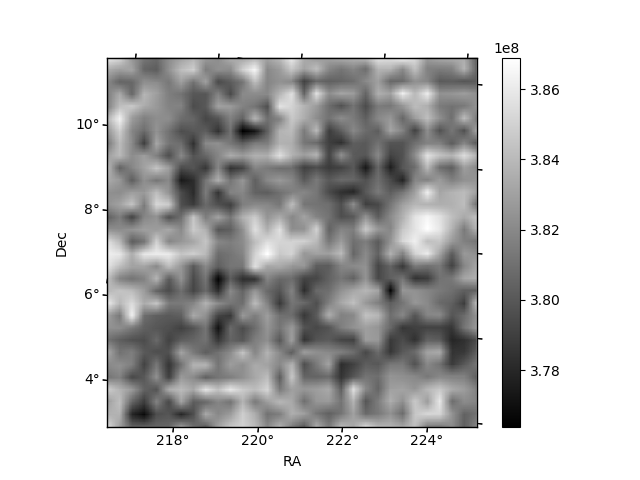
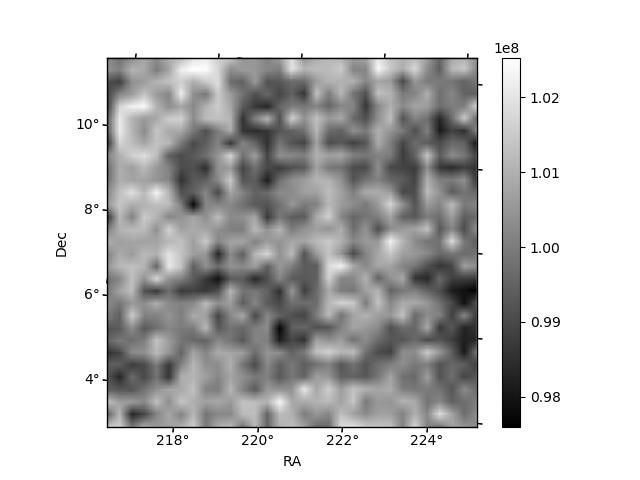
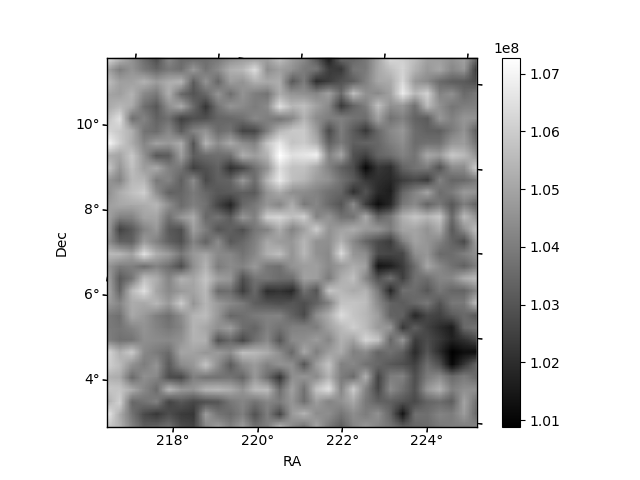
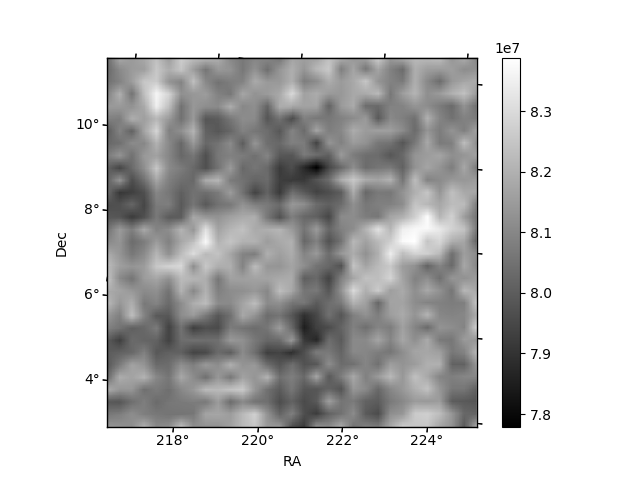
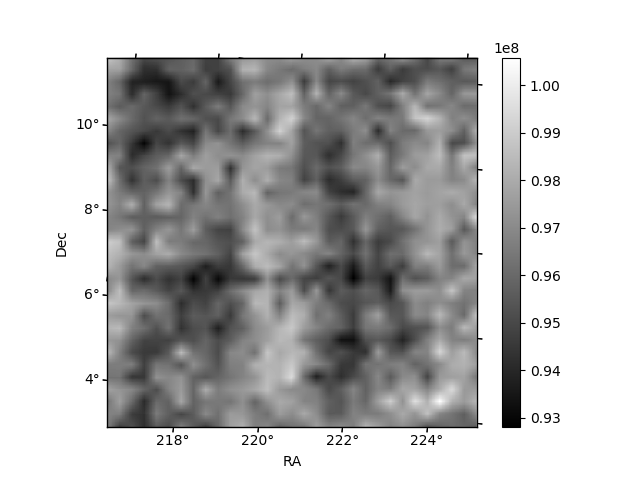
Histogram calculated using DETX and DETY for each event in the final _common_clean file
| Quadrant A | 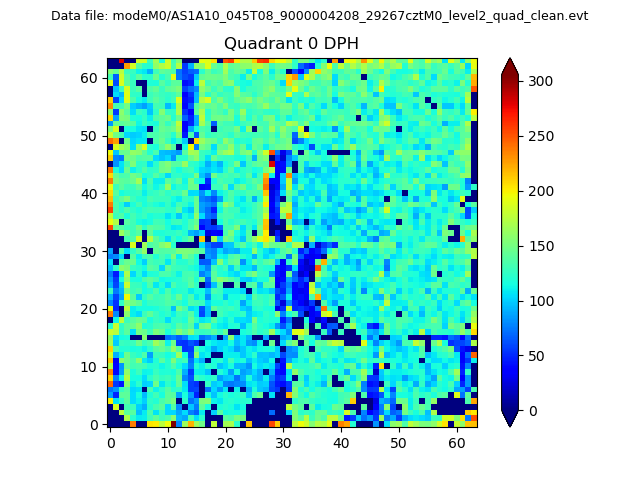 |
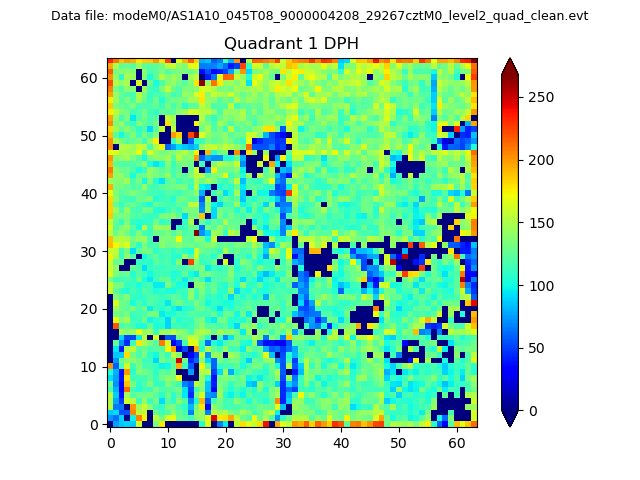 |
Quadrant B |
|---|---|---|---|
| Quadrant D | 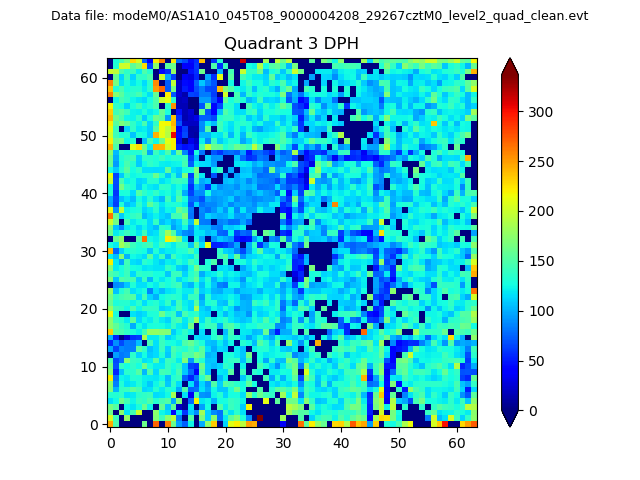 |
 |
Quadrant C |
| Plot type | Count rate plots | Images |
|---|---|---|
| Comparison with Poisson distribution Blue bars denote a histogram of data divided into 1 sec bins. Red curve is a Poisson curve with rate = median count rate of data. |
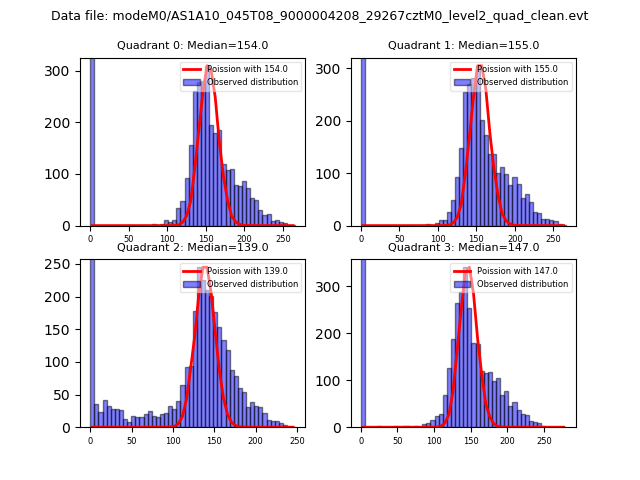 |
 |
| Quadrant-wise count rates Data is divided into 100 sec bins |
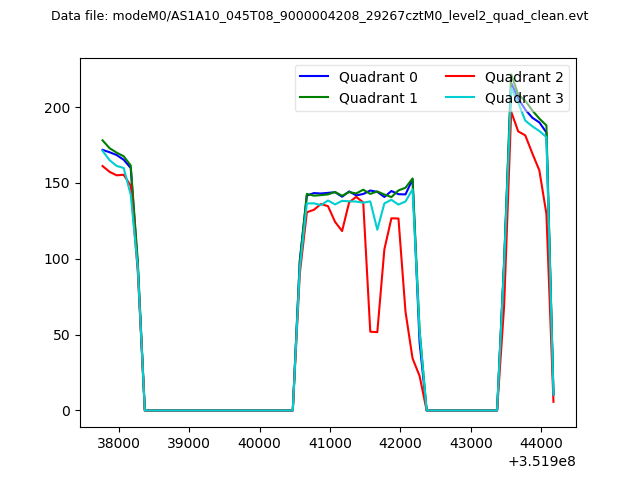 |
|
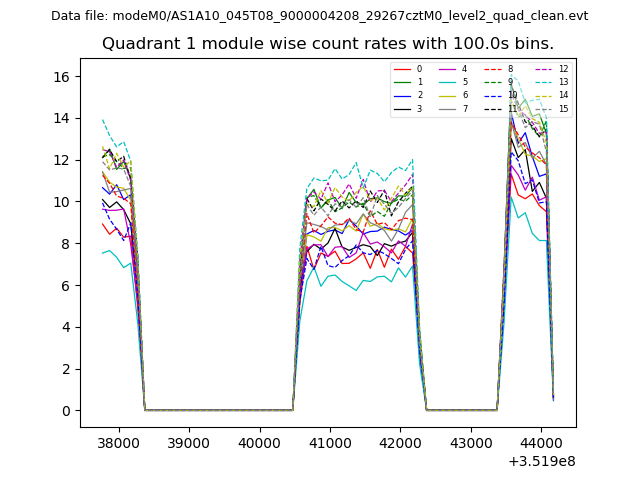
| Module-wise count rates for Quadrant A Data is divided into 100 sec bins |
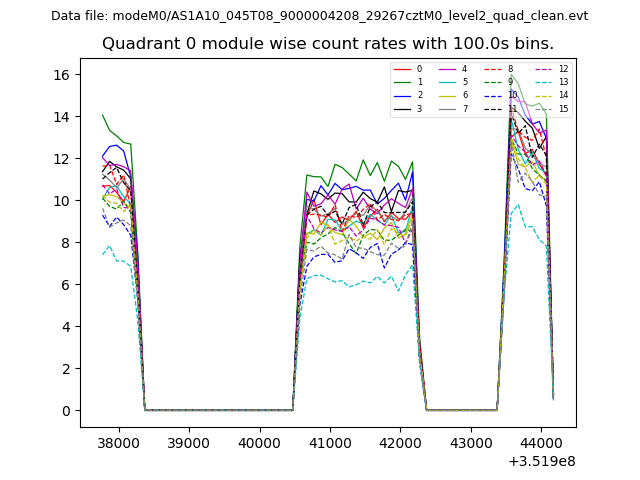 |
 |
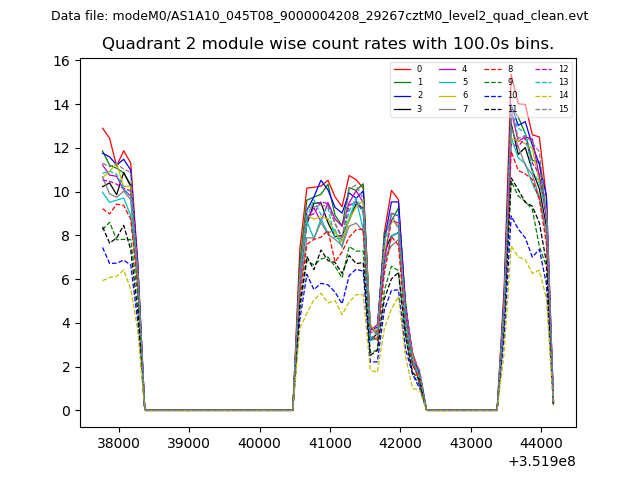
| Module-wise count rates for Quadrant B Data is divided into 100 sec bins |
 |
 |
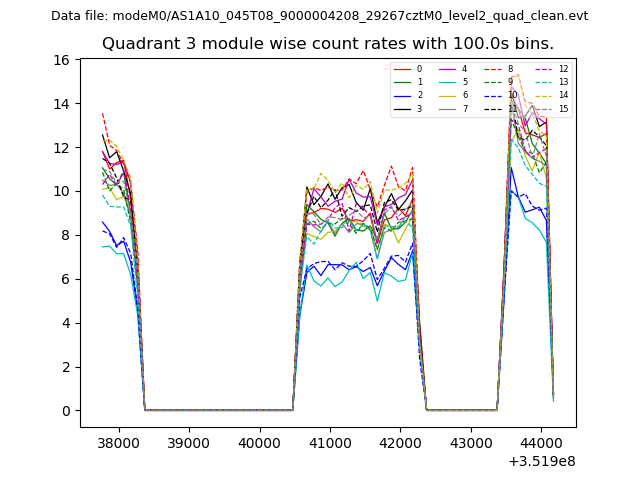
| Module-wise count rates for Quadrant C Data is divided into 100 sec bins |
 |
 |
| Module-wise count rates for Quadrant D Data is divided into 100 sec bins |
 |
 |
| Parameter | Plot |
|---|---|
| CZT HV Monitor | 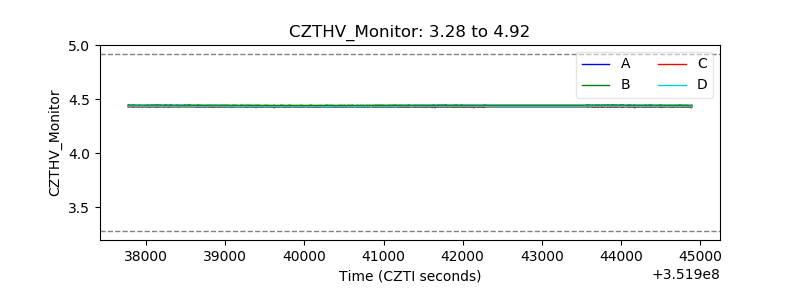 |
| D_VDD | 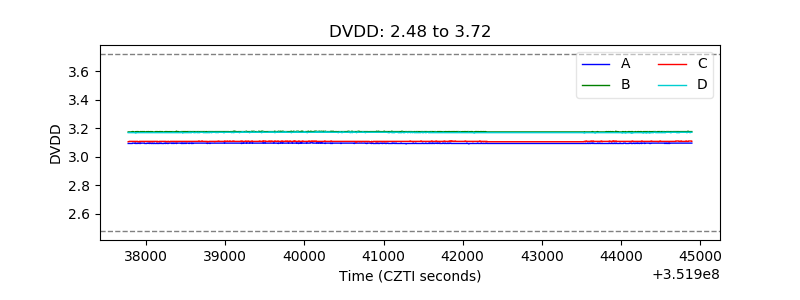 |
| Temperature 1 | 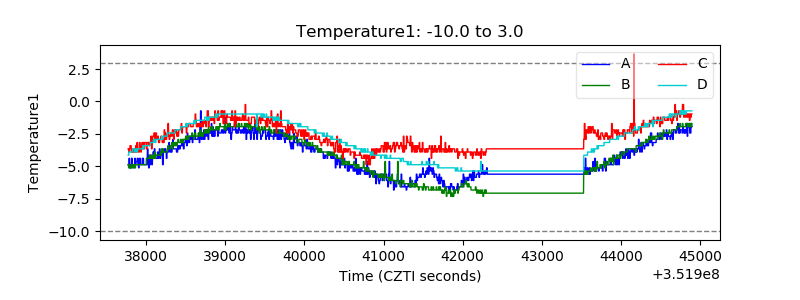 |
| Veto HV Monitor | 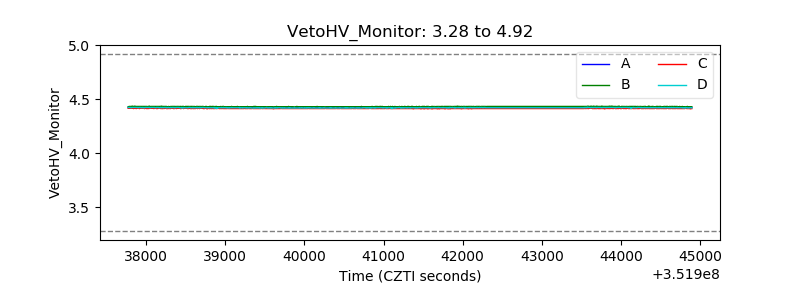 |
| Veto LLD | 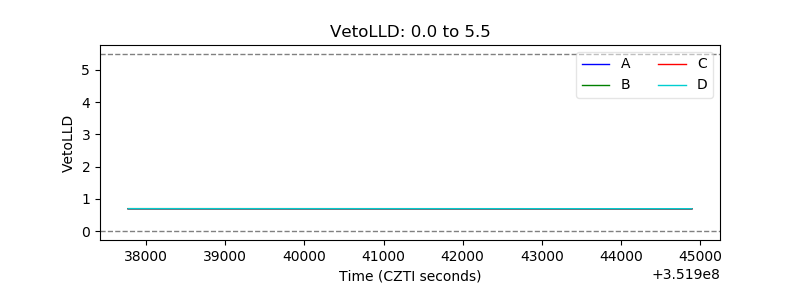 |
| Alpha Counter | 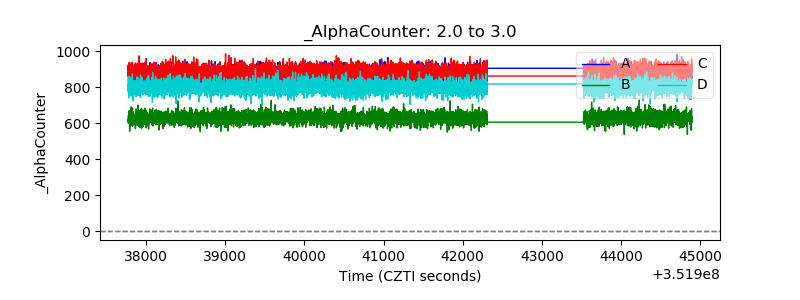 |
| _CPM_Rate | 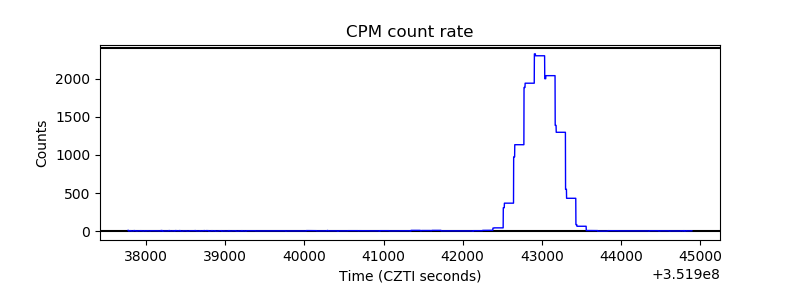 |
| CZT Counter |  |
| +2.5 Volts monitor |  |
| +5 Volts monitor |  |
| _ROLL_ROT | 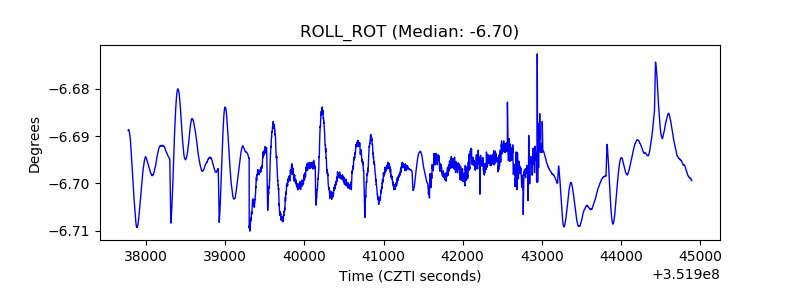 |
| _Roll_DEC | 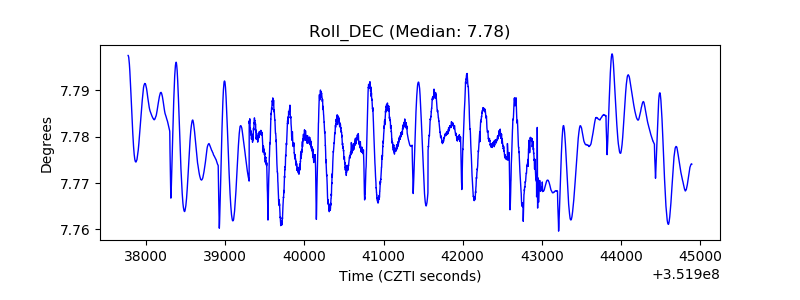 |
| _Roll_RA |  |
| Veto Counter | 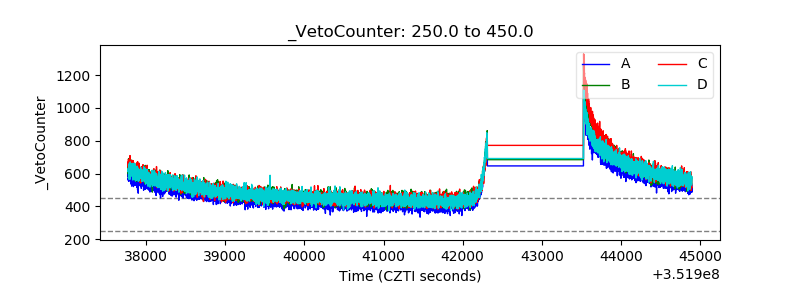 |