| Param | Original file | Final file |
|---|---|---|
| Filename | modeM0/AS1A10_045T08_9000004208_29270cztM0_level2.evt | modeM0/AS1A10_045T08_9000004208_29270cztM0_level2_quad_clean.evt |
| Size (bytes) | 712,517,760 | 71,153,280 |
| Size | 679.5 MB | 67.9 MB |
| Events in quadrant A | 3,491,692 | 434,937 |
| Events in quadrant B | 4,188,839 | 435,062 |
| Events in quadrant C | 7,051,501 | 414,755 |
| Events in quadrant D | 6,404,974 | 412,598 |
| Mode SS | |||
|---|---|---|---|
| Quadrant | BADHDUFLAG | Total packets | Discarded packets |
| A | 0 | 132 | 0 |
| B | 0 | 132 | 0 |
| C | 0 | 132 | 0 |
| D | 0 | 132 | 0 |
| Mode M0 | |||
|---|---|---|---|
| Quadrant | BADHDUFLAG | Total packets | Discarded packets |
| A | 0 | 14348 | 2 |
| B | 0 | 16813 | 2 |
| C | 0 | 25644 | 2 |
| D | 0 | 23764 | 2 |
| Mode M9 | |||
|---|---|---|---|
| Quadrant | BADHDUFLAG | Total packets | Discarded packets |
| A | 0 | 15 | 0 |
| B | 0 | 16 | 0 |
| C | 0 | 16 | 0 |
| D | 0 | 16 | 0 |
| Quadrant | Total seconds | Saturated seconds | Saturation percentage |
|---|---|---|---|
| A | 6554 | 120 | 1.830943% |
| B | 6554 | 231 | 3.524565% |
| C | 6554 | 757 | 11.550198% |
| D | 6553 | 459 | 7.004425% |
Noise dominated data is calculated using 1-second bins in cleaned event files. If a bin has >2000 counts, and if more than 50% of those come from <1% of pixels, then it is considered to be noise-dominated and hence unusable.
| Quadrant | # 1 sec bins | Bins with >0 counts | Bins with >2000 counts | High rate bins dominated by noise | Noise dominated (total time) | Noise dominated (detector-on time) | Marked lightcurve |
|---|---|---|---|---|---|---|---|
| A | 7678 | 6554 | 0 | 0 | 0.00% | 0.00% | 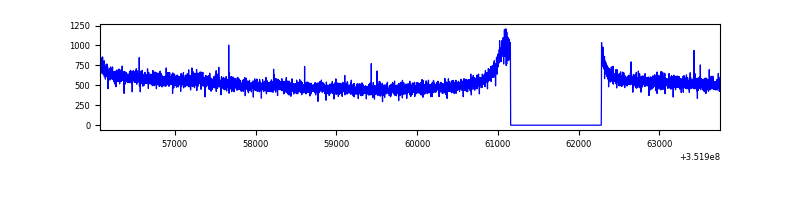 |
| B | 7678 | 6554 | 29 | 29 | 0.38% | 0.44% | 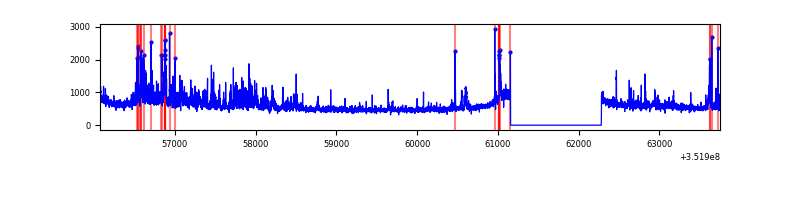 |
| C | 7678 | 6554 | 132 | 132 | 1.72% | 2.01% | 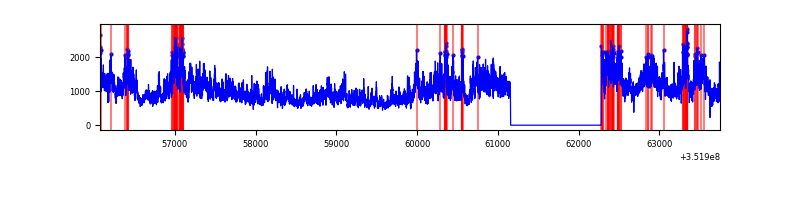 |
| D | 7677 | 6553 | 256 | 256 | 3.33% | 3.91% | 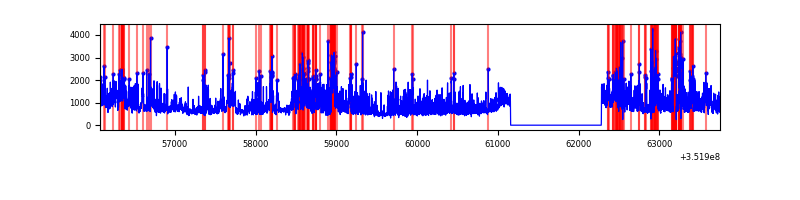 |
Top three noisy pixels from each quadrant. If the there are fewer than three noisy pixels in the level2.evt file, extra rows are filled as -1
| Pixel properties | Quadrant properties | ||||||
|---|---|---|---|---|---|---|---|
| Quadrant | DetID | PixID | Counts | Sigma | Mean | Median | Sigma |
| A | 13 | 254 | 12298 | 63.23 | 903 | 888 | 180.4 |
| A | 3 | 137 | 8422 | 41.75 | 903 | 888 | 180.4 |
| A | 0 | 226 | 7640 | 37.42 | 903 | 888 | 180.4 |
| B | 0 | 229 | 257940 | 1532.38 | 883 | 861 | 167.8 |
| B | 0 | 183 | 256438 | 1523.43 | 883 | 861 | 167.8 |
| B | 10 | 245 | 194134 | 1152.05 | 883 | 861 | 167.8 |
| C | 3 | 233 | 3548758 | 18009.71 | 845 | 853 | 197.0 |
| C | 14 | 238 | 139034 | 701.43 | 845 | 853 | 197.0 |
| C | 7 | 247 | 48232 | 240.5 | 845 | 853 | 197.0 |
| D | 1 | 52 | 1588753 | 7776.21 | 862 | 843 | 204.2 |
| D | 8 | 195 | 1261838 | 6175.26 | 862 | 843 | 204.2 |
| D | 13 | 153 | 92947 | 451.05 | 862 | 843 | 204.2 |
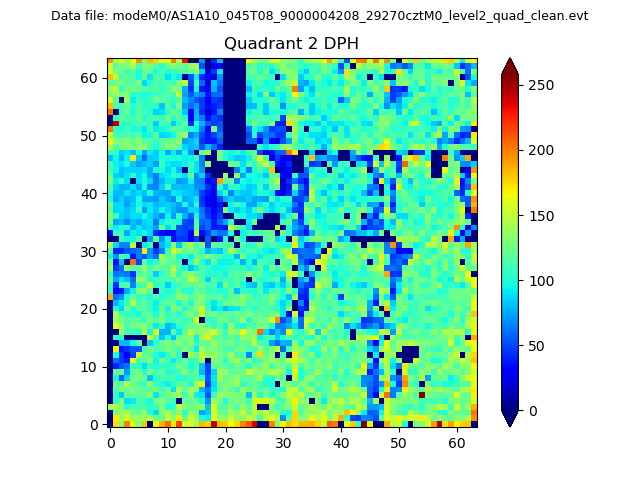
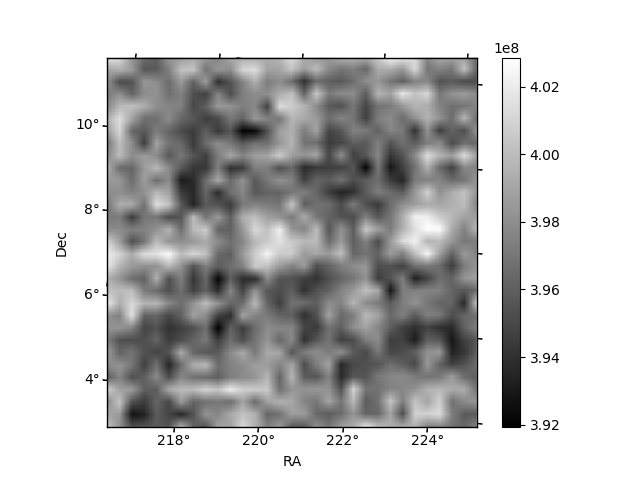
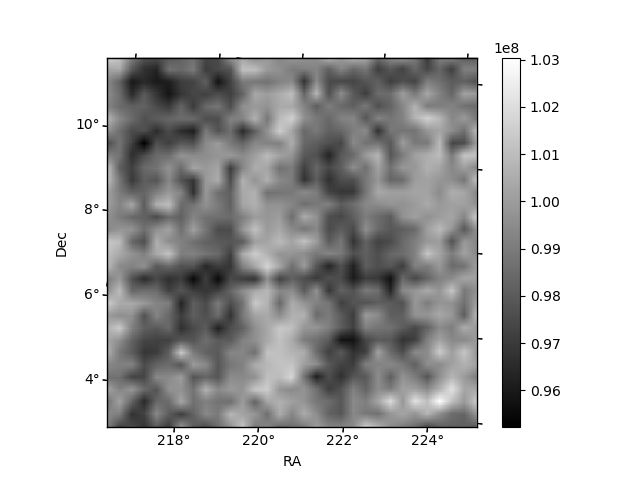
Histogram calculated using DETX and DETY for each event in the final _common_clean file
| Quadrant A | 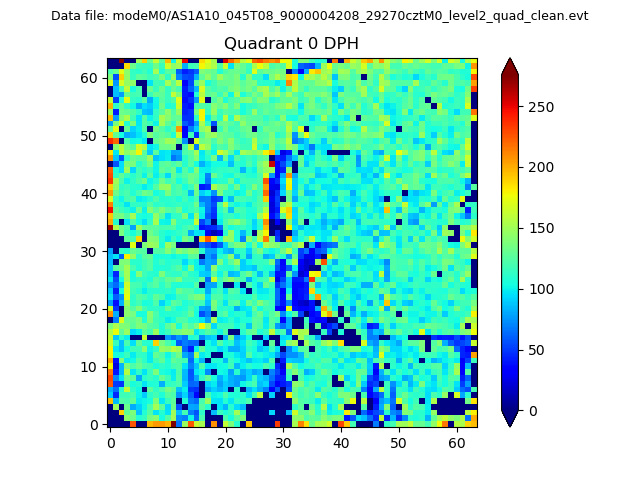 |
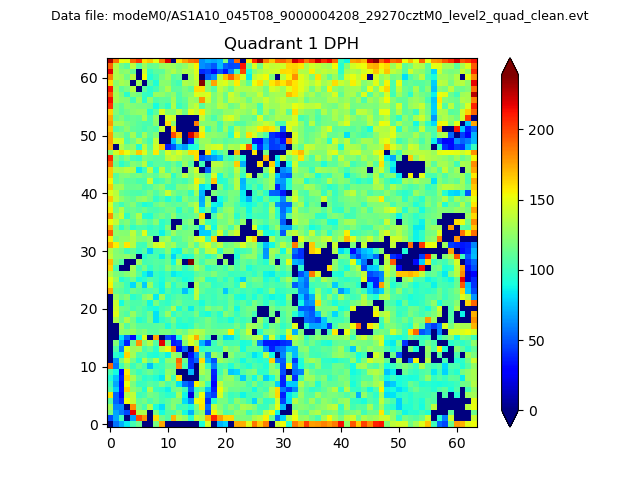 |
Quadrant B |
|---|---|---|---|
| Quadrant D | 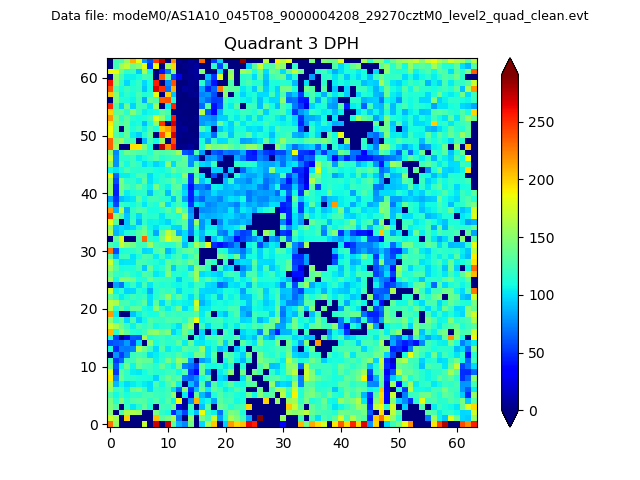 |
 |
Quadrant C |
| Plot type | Count rate plots | Images |
|---|---|---|
| Comparison with Poisson distribution Blue bars denote a histogram of data divided into 1 sec bins. Red curve is a Poisson curve with rate = median count rate of data. |
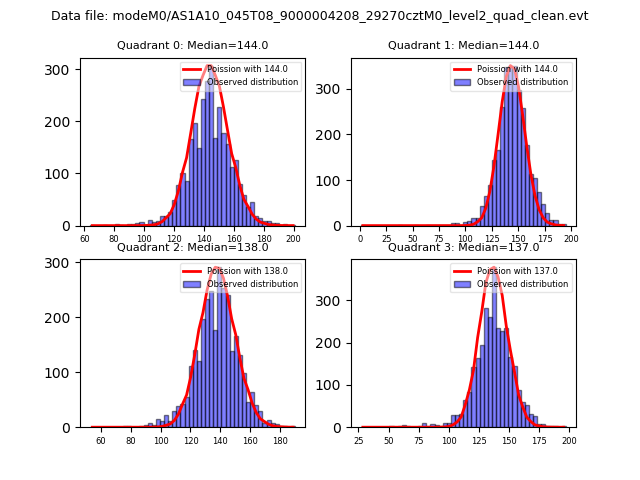 |
 |
| Quadrant-wise count rates Data is divided into 100 sec bins |
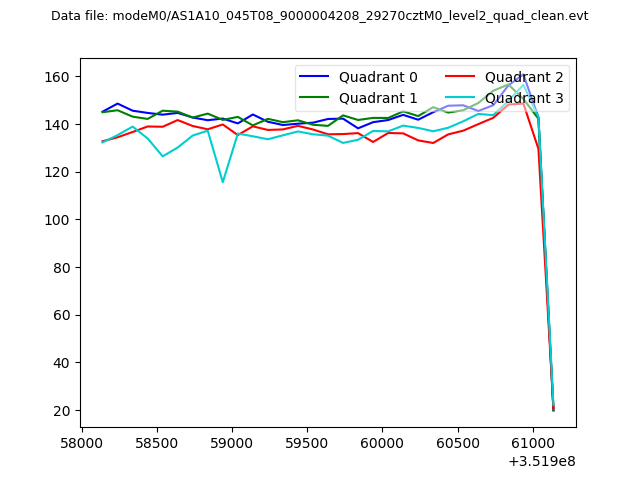 |
|
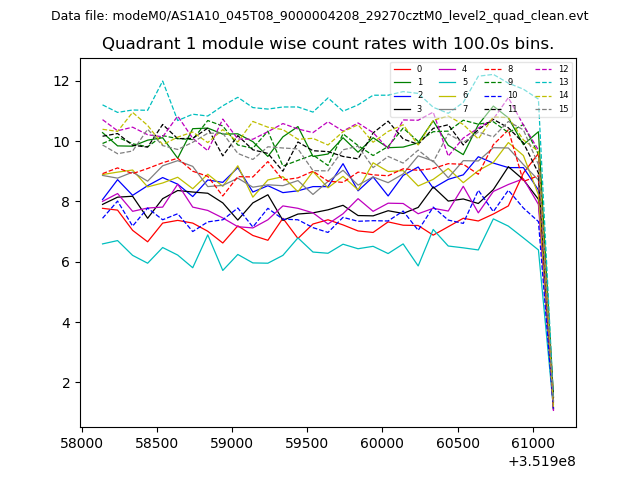
| Module-wise count rates for Quadrant A Data is divided into 100 sec bins |
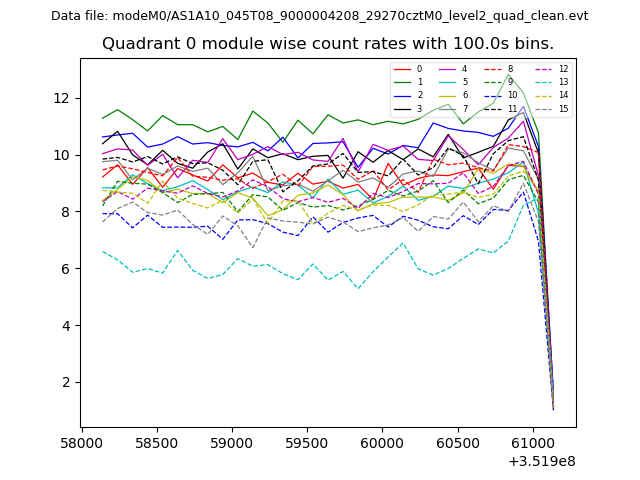 |
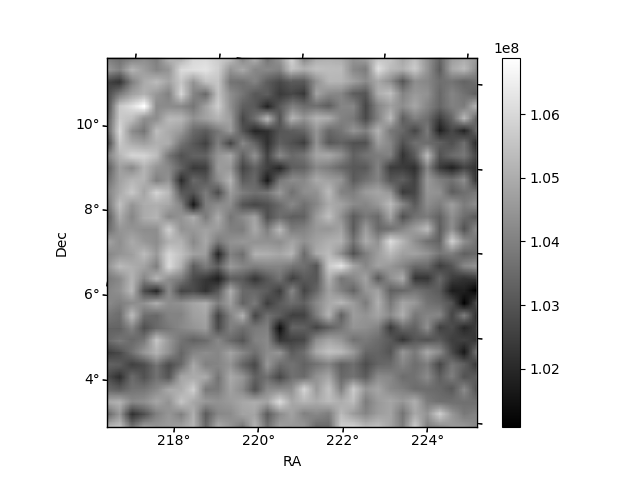 |
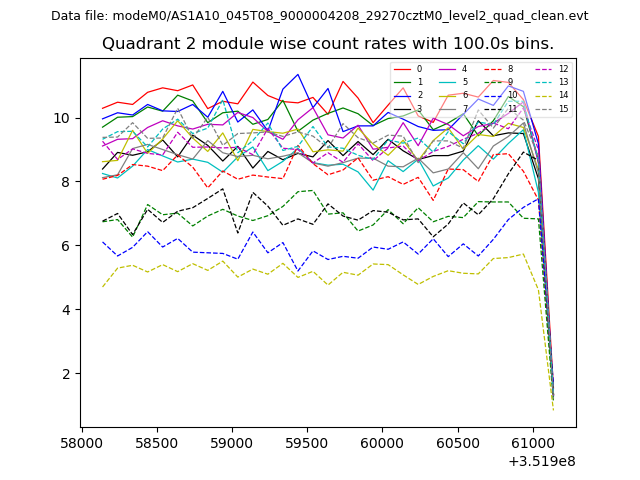
| Module-wise count rates for Quadrant B Data is divided into 100 sec bins |
 |
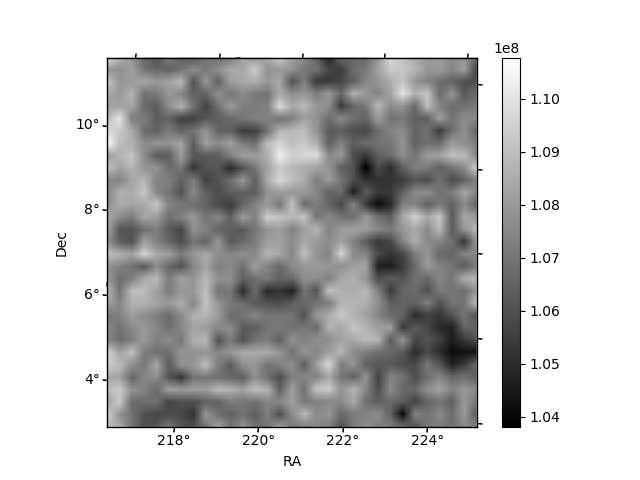 |
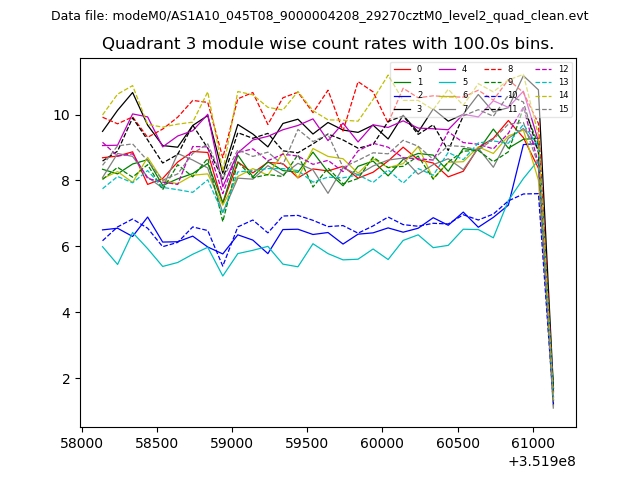
| Module-wise count rates for Quadrant C Data is divided into 100 sec bins |
 |
 |
| Module-wise count rates for Quadrant D Data is divided into 100 sec bins |
 |
 |
| Parameter | Plot |
|---|---|
| CZT HV Monitor | 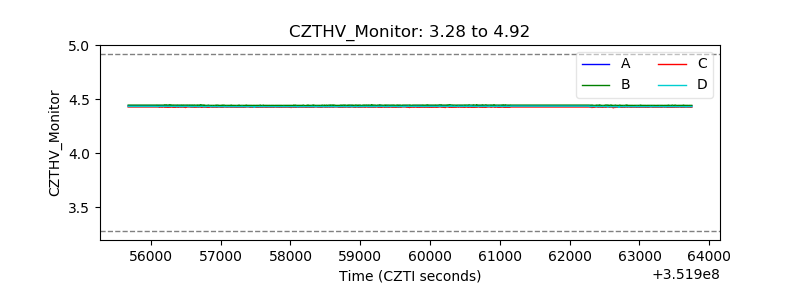 |
| D_VDD | 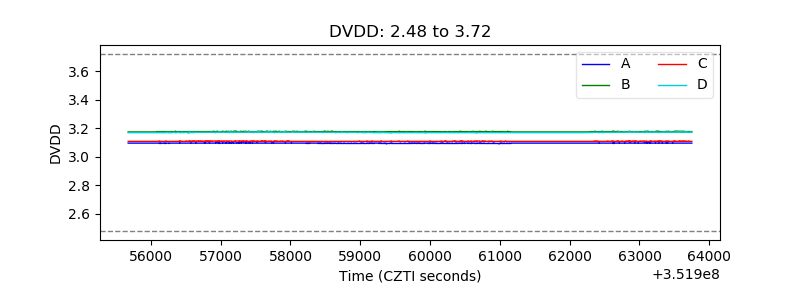 |
| Temperature 1 | 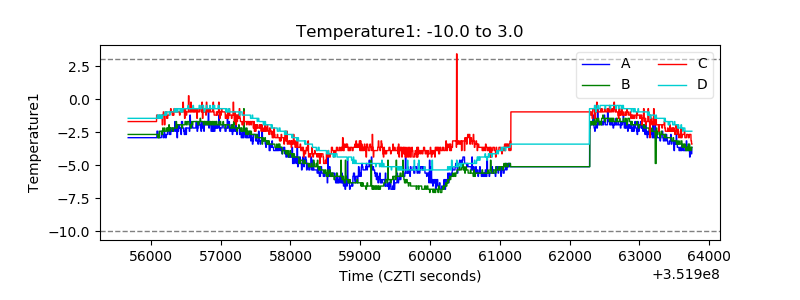 |
| Veto HV Monitor | 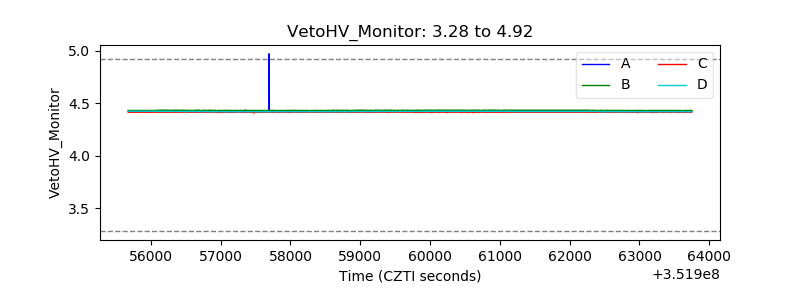 |
| Veto LLD | 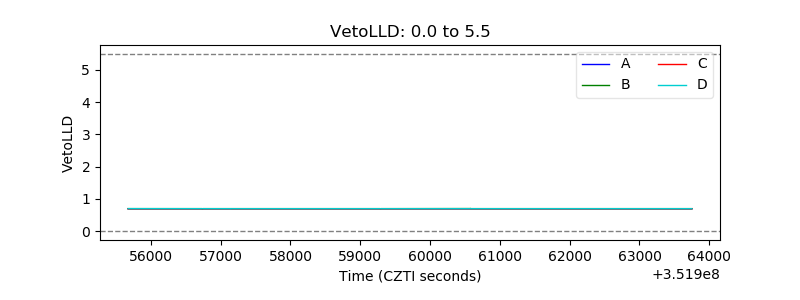 |
| Alpha Counter | 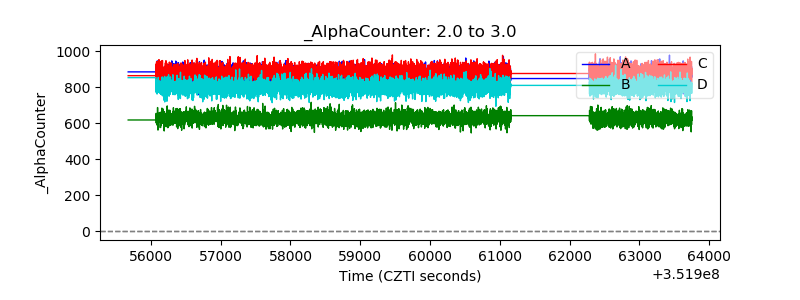 |
| _CPM_Rate | 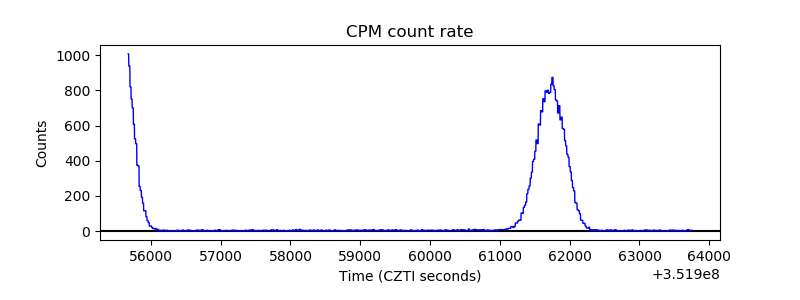 |
| CZT Counter | 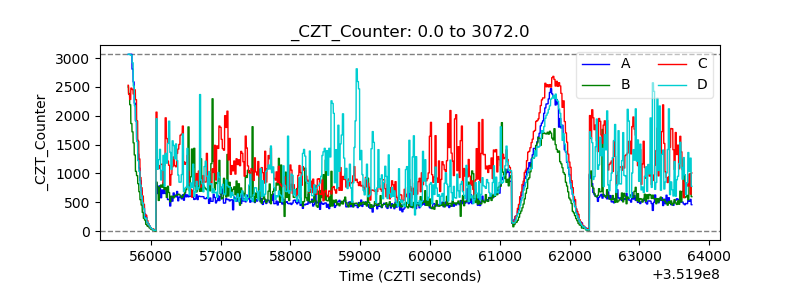 |
| +2.5 Volts monitor | 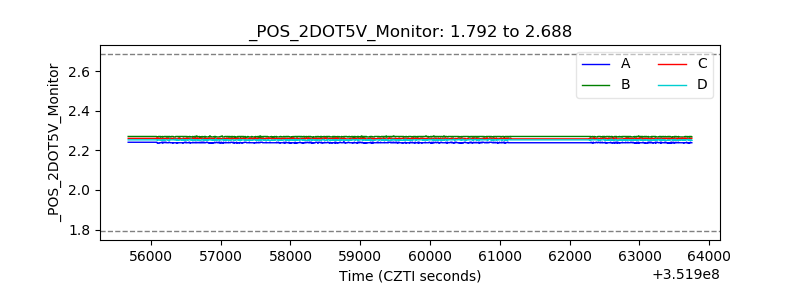 |
| +5 Volts monitor |  |
| _ROLL_ROT | 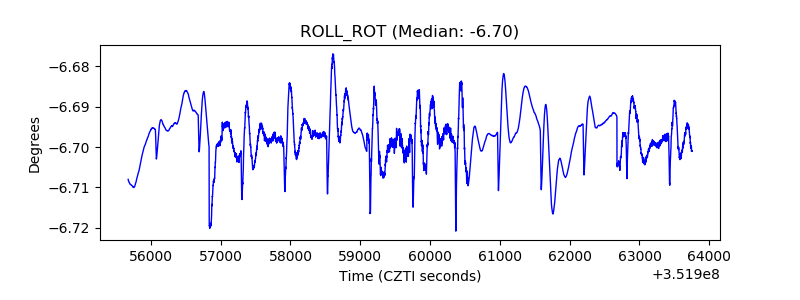 |
| _Roll_DEC | 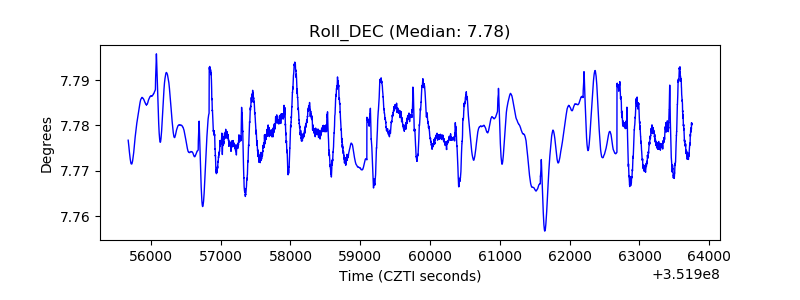 |
| _Roll_RA | 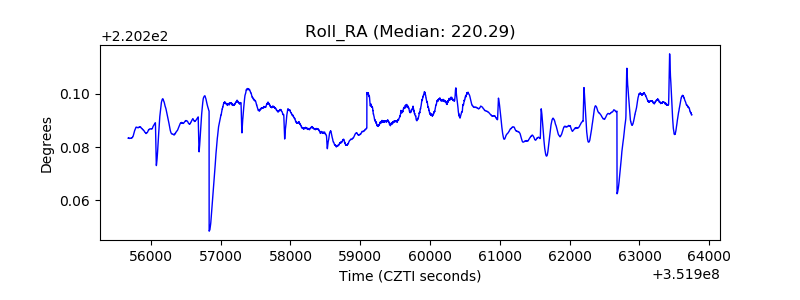 |
| Veto Counter | 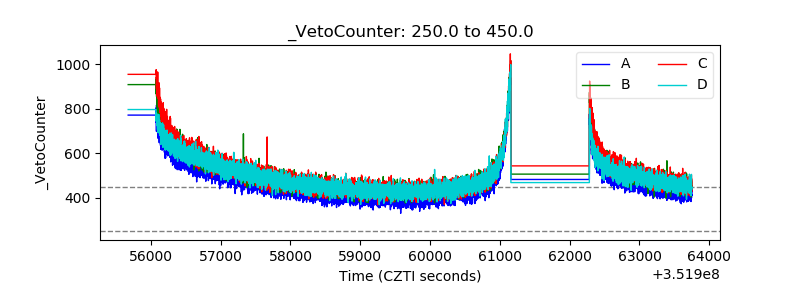 |